

SUMMARY
Members of the KDM5 histone H3 lysine 4 demethylase family are associated with therapeutic resistance, including endocrine resistance in breast cancer, but the underlying mechanism is poorly defined. Here we show that genetic deletion of KDM5A/B or inhibition of KDM5 activity increases sensitivity to anti-estrogens by modulating estrogen receptor (ER) signaling and by decreasing cellular transcriptomic heterogeneity. Higher KDM5B expression levels are associated with higher transcriptomic heterogeneity and poor prognosis in ER+ breast tumors. Single cell RNA-seq, cellular barcoding, and mathematical modeling demonstrate that endocrine-resistance is due to selection for pre-existing genetically distinct cells, while KDM5 inhibitor-resistance is acquired. Our findings highlight the importance of cellular phenotypic heterogeneity in therapeutic resistance and identify KDM5A/B as key regulators of this process.
Grphical Abstract

INTRODUCTION
Modulation of chromatin structure due to post-translational modification of histones plays a key role in establishing cell type-specific gene expression patterns and alterations of this process are involved in tumorigenesis (Flavahan et al., 2017). Frequent mutations of genes encoding for chromatin modifying enzymes and histones in multiple human cancer types further emphasize the role of perturbed epigenetic programs in tumor evolution (Feinberg et al., 2016). However, the functional consequences of these mutations remain relatively poorly characterized.
In breast cancer, epigenetic regulators and transcription factors are among the most frequently mutated genes, especially in luminal tumors (TCGA, 2012). More recent sequencing of endocrineresistant metastatic breast tumors has identified alterations previously not detected in primary tumors, such as ESR1 mutations in a subset of cases (Jeselsohn et al., 2015). Most of these ESR1 mutations occur in the ligand-binding domain (e.g., ESR1Y537S) and confer decreased sensitivity to antiestrogens such as fulvestrant and tamoxifen. The majority (~70%) of breast cancer patients are diagnosed with ER+ hormone-dependent tumors and many progress to treatment-resistant metastatic disease. Therefore, a better understanding of the mechanisms of endocrine resistance and identification of strategies to decrease or prevent it would have high clinical impact.
We previously reported that KDM5B, encoding a histone H3 lysine 4 (H3K4) demethylase, is an oncogene in luminal ER+ breast cancer due to its frequent amplification and overexpression, and its higher activity being associated with shorter disease-free survival in breast cancer patients treated with endocrine therapy (Yamamoto et al., 2014). KDM5B was also identified as a gene required for tumor maintenance in melanoma (Roesch et al., 2010), and its increased expression is associated with resistance to BRAF inhibitors and chemotherapy (Roesch et al., 2013). Other KDM5 family members such as KDM5A have also been implicated in therapeutic resistance in lung and other cancer types (Sharma et al., 2010), triggering an interest in developing KDM5 inhibitors (KDM5i) for cancer treatment (Horton et al., 2016; Johansson et al., 2016; Vinogradova et al., 2016). However, the mechanisms by which the KDM5 family of histone demethylases (HDMs) contribute to tumorigenesis and therapy resistance remains poorly defined.
RESULTS
The effect of KDM5B and KDM5A on sensitivity to endocrine therapies
To explore the function of KDM5B and KDM5A in response and resistance to endocrine therapies in breast cancer, we deleted KDM5B and KDM5A in the MCF7 ER+ estrogen-dependent luminal breast cancer cell line using CRISPR-Cas9. Both KDM5B-KO and KDM5A-KO cells demonstrated increased sensitivity to fulvestrant compared to parental MCF7 cells (Figure 1A). KDM5B-KO cells and KDM5A-KO cells also showed decreased cell proliferation (Figure S1A) and increased H3K4me3 levels (Figure S1B) at early passage, however, at later passages these phenotypic differences disappeared (Figure S1A) likely due to selection for cells that can compensate for the loss. Hence to be able to inhibit all KDM5 activity in a dynamic manner, we utilized two recently developed small molecule inhibitors of the KDM5 family of enzymes KDM5-C49 (C49) and its cell permeable ethyl ester derivative KDM5-C70 (C70) (Johansson et al., 2016) to further characterize the link between KDM5 activity and endocrine therapies.
Figure 1. The role of KDM5B and KDM5A on endocrine therapies and transcriptomic variability.
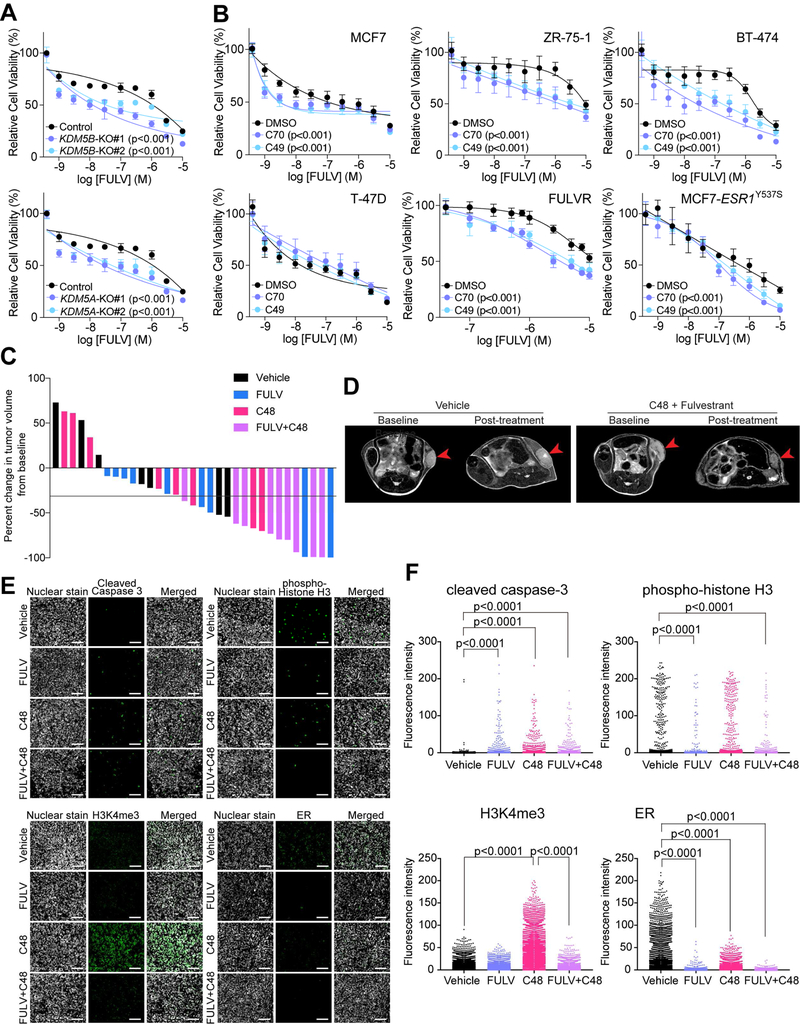
(A) Cellular viability after fulvestrant treatment of parental MCF7, KDM5B-KO and KDM5A-KO cells. (B) Cellular viability after fulvestrant treatment of a panel of breast cancer cell lines pre-treated with DMSO or KDM5i. (C) Graph depicting percent change in tumor volume from baseline in control, fulvestrant (FULV), C48, and combined treatment groups. Black line marks 30% decrease in volume, which is commonly used as a cut off to define response in clinical studies. (D) Representative MRI images of tumors before and after treatment in vehicle and combined C48+FULV group. (E) Representative immunofluorescence analysis of the indicated markers in tumors of the four treatment groups. Scale bar, 100 µm. (F) Graphs depicting quantification of immunofluorescence images. In (A) and (B), Error bars represent s.d., n = 6. See also Figure S1 and Table S1.
We confirmed the specificity of these inhibitors by mass spectrometry analysis of histone modifications (Creech et al., 2015) and by testing their effects on KDM5A/B-KO cells. We found that among all histone modifications analyzed, only H3K4me3 showed a significant increase after C70 and C49 treatment (Figure S1C). Similarly, while both KDM5i effectively decreased the growth of parental MCF7 cells, deletion of KDM5B or KDM5A diminished this effect (Figures S1D,E). These results imply that KDM5B and KDM5A are key mediators of KDM5i-mediated growth suppression in these cells. Immunoblot analysis also demonstrated increased H3K4me3 levels after KDM5i treatment in parental MCF7 but not in KDM5B-KO cells (Figure S1F). In line with our previous studies demonstrating that KDM5B is more relevant in luminal breast cancer cells (Yamamoto et al., 2014), we confirmed higher KDM5B expression levels in luminal compared to basal-like breast cancer cells (Figure S1G,H) and that ER+ primary tumors with higher KDM5B expression levels were more likely to develop local and distant metastatic recurrence in tamoxifen-treated breast cancer patients (Figure S1I). We also observed significant growth inhibition in luminal but not in non-luminal breast cancer cell lines following KDM5i treatment even though increased H3K4me3 was detected in all lines tested (Figure S1J,K). Gene expression profiling of MCF7 cells at different time points following C70 treatment demonstrated progressive gene expression changes (Table S1) and upregulated genes showed enrichment in TGFβ signaling (Figure S1L), which is in agreement with our prior data using siKDM5B (Yamamoto et al., 2014). Based on these experiments, we conclude that C49 and C70 appear to mimic the loss of KDM5B or KDM5A in breast cancer cells.
To investigate whether decreasing KDM5 activity would enhance sensitivity to endocrine therapies, we pre-treated ER+ breast cancer cell lines (MCF7, ZR-75–1, BT-474, T-47D), fulvestrant-resistant (FULVR), and ESR1Y537S mutant-expressing derivatives with KDM5i followed by combined treatment with fulvestrant. We found that inhibition of KDM5 increased cellular sensitivity to fulvestrant in all cell lines tested except in T-47D cells (Figure 1B). To validate these findings in vivo, we performed xenograft assays using MCF7 cells and C48, a KDM5i suitable for in vivo use (Liang et al., 2016). We first confirmed that C48 also increased cellular sensitivity to fulvestrant in cell culture (Fig. S1M). Next, we treated pre-established MCF7 xenografts with fulvestrant, C48, and their combination. Combined treatment led to a significant decrease in tumor volume, while neither compound by itself had the same effect (Figure 1C,D). Tumor histology was not affected by any of the treatments based on analysis of hematoxylin-eosin stained slides (Figure S1N). However, assessment of cell proliferation and apoptosis by immunofluorescence for phospho-histone H3 and cleaved caspase 3, respectively, demonstrated a significant increase in apoptosis in all treatment groups and decreased proliferation after fulvestrant and combined treatment (Figure 1E,F). Immunofluorescence for H3K4me3 and ER also confirmed significantly increased H3K4me3 after C48 and decreased ER after fulvestrant treatment (Figure 1E,F), which we also confirmed in cell culture and by immunoblot (Figure S1O,P). These findings suggest that KDM5 HDMs regulate sensitivity to endocrine therapy in both hormone-sensitive and endocrine-resistant cells both in vitro and in vivo.
KDM5 activity, H3K4me3 broadness, and variability in gene expression
Recent studies have shown that genes marked by the broadest H3K4me3 promoter domains exhibit enhanced transcriptional consistency (Benayoun et al., 2014) implying that regulators of H3K4me3 peak broadness such as KDM5 may regulate cellular transcriptomic heterogeneity. To test this hypothesis, we investigated changes in H3K4me3 chromatin patterns following KDM5 inhibition by performing ChIP-seq for H3K4me3 and H3K4me2 in a panel of breast cancer cell lines. Because our prior data demonstrated that KDM5B histone demethylase activity may be modulated by CTCF (higher HDM activity at KDM5B-CTCF overlapping peaks) (Yamamoto et al., 2014), we also performed ChIP-seq for CTCF. C70 treatment globally increased the broadness of promoter H3K4me3 peaks over time without increasing peak height, while H3K4me2 peak heights were slightly decreased (Figure 2A and Figure S2A). Increased H3K4me3 peak broadness was also confirmed in both KDM5B-KO and KDM5A-KO cells (Figure S2B). The correlation between promoter H3K4me3 peak width and transcript levels remained constant during C70 treatment (Figure S2C), although an increase in broadness led to an increase in gene expression (Figure S2D). The increase in H3K4me3 peak broadness was significantly higher at KDM5B-CTCF overlapping versus non-overlapping sites (Figure S2E) in line with our previous findings demonstrating significant differences in H3K4me3 levels between KDM5B-CTCF overlapping vs. non-overlapping sites (Yamamoto et al., 2014). The top 500 genes with H3K4me3 peak broadness increase were also associated with enriched binding of transcriptional elongation mark H3K79me2 after C70 treatment (Figure S2F), implying that changes in H3K4me3 peak broadness may influence transcriptional elongation. At loci with the most significant increase in H3K4me3 peak broadness, such as in ZMYND8 encoding for a KDM5D co-repressor (Li et al., 2016), KDM5B and H3K4me3 peaks showed a clear overlap, suggesting that the decrease in KDM5B activity is directly linked to increased H3K4me3 broadness (Figure 2B).
Figure 2. KDM5 activity and H3K4me3 peak broadness.

(A) H3K4me3 and H3K4me2 peak width plotted against peak height before and at different time points (day 0–14) after treatment with KDM5-C70 inhibitor. Mean values are shown as dotted lines. Shaded areas indicate interquartile range. (B) Gene tracks depicting KDM5B and H3K4me3 signal at selected genomic loci. X-axis shows position along the chromosome with gene structures drawn below, whereas y-axis shows genomic occupancy in units of reads per million reads (RPM). (C) Correlation between promoter H3K4me3 peak broadness changes and changes in percent of cells expressing the corresponding gene in KDM5C70-treated cells. Enrichment analysis of H3K4me3 width increase in C70 is performed against the genes with increased percent of expressing cells in C70 for all genes or genes without expression change. H3K4me3 width changes are calculated as the average width changes across all six cell lines. *** fdr<0.001; ** fdr<0.01; * fdr<0.25. (D) Plot depicting percentage of cells expressing ZMYND8 in MCF7 and C70-treated MCF7 cells. All single cells are ranked and grouped into 10 groups based on their sequence depth to avoid variability due to this. The percent of expressing cells is calculated for each group, and a weighted t-test is performed to access the significance of the difference between two samples. The box indicates the interquartile range (IQR), the line inside the box shows the median and whiskers show the locations of either 1.5×IQR above the third quartile or 1.5×IQR below the first quartile. See also Figure S2.
To assess whether these dynamic changes in H3K4me3 peak broadness alter cell-to-cell variability in gene expression, we performed inDrop single-cell RNA-seq (scRNA-seq) (Zilionis et al., 2017) to characterize the expression profiles of 500–2,000 individual cells in parental and C70-treated cells. We found that an increase in H3K4me3 broadness was significantly associated with an increase in the fraction of cells expressing the associated genes, with ZMYND8 being the top upregulated gene (Figures 2C,D). Limiting the analysis to genes without expression changes in bulk samples provided similar results (Figure 2C), thus excluding the bias from changes in gene expression on fraction of expressing cells. These results suggest that changes in H3K4me3 peak broadness following KDM5 inhibition lead to more uniform cellular gene expression patterns.
KDM5 activity and cellular transcriptomic heterogeneity
Cellular heterogeneity of phenotypic features is a key mechanism underlying disease progression and therapeutic resistance (Huang, 2013), yet its regulation at the molecular level is poorly understood. We hypothesized that modulating KDM5 activity might affect cell-to-cell transcriptomic heterogeneity and impact therapeutic resistance via this mechanism. To test this hypothesis, we analyzed scRNA-seq data of breast cancer cell lines before and after treatment with C70 or FULV (Figure S3A) and investigated the cell-to-cell variability for the expression of selected genes using the Gini coefficient (Jiang et al., 2016), where a higher Gini coefficient value indicates more heterogeneous expression. We also generated and analyzed derivatives of MCF7 cells that acquired resistance to C70 during prolonged culture (C70R) to gain insights into the relationship between acquired resistance to KDM5i and cellular transcriptomic heterogeneity. The majority of genes detected had a relatively high Gini index (Figure 3A), suggesting that most genes were expressed heterogeneously, although confounding due to technical issues of scRNA-seq cannot be excluded. Thus, we also performed CYTOF using a panel of markers corresponding to cellular states and activity of signaling pathways and confirmed that the Gini indices calculated based on inDrop and CyTOF data were correlated (Figure S3B). The Gini indices of both KDM5B and KDM5A were >0.5, suggesting relatively heterogeneous expression of these genes (Figures 3A and S3C). Consistent with the increase in the fraction of cells expressing ZMYND8 after C70 treatment, ZMYND8 had a lower Gini index in C70treated cells compared to untreated control (Figure 3A,B). The Gini indices of luminal lineage-specific genes (e.g., GATA3 and FOXA1) were < 0.5 in luminal but > 0.9 in mesenchymal SUM159 cells, while mesenchymal-lineage-specific genes (e.g., VIM) showed the opposite pattern (Figures 3A and S3C). The observed differences are not likely to be due to differences in cell proliferation as there was no significant difference in the distribution of cells in different phases of cell cycle among samples (Figure S3D).
Figure 3. KDM5 activity and transcriptomic heterogeneity.

(A) Gini index of single-cell inDrop data. The distribution of Gini coefficients of all genes in each sample is shown as grey density plot. Selected luminal (blue), basal/mesenchymal (red), KDM5i-induced (green), and housekeeping (black) genes are highlighted. (B) Violin plot showing distribution of normalized expression of ZMYND8 based on single cell RNA-seq data. Dots within violin represent the transcript counts in single cells. The “-” and “+” inside the violin indicate the median and mean values, respectively. (C) Graphs depicting cell-to-cell distance in the indicated cell populations. Wilcoxon rank-sum test p values are shown. Note the analysis of pair-wised distances between all single cells generates a large number of data points, which makes the p value less informative than the relative differences between mean values (shown on the right side) and box profiles. The box indicates the interquartile range (IQR), the line inside the box shows the median and whiskers show the locations of either 1.5×IQR above the third quartile or 1.5×IQR below the first quartile. (D) Plot depicting the number of genes with changes in Gini index after KDM5-C70 treatment. (E) Top signaling pathways enriched among genes with decreasing Gini index after KDM5-C70 treatment in MCF7 and FULVR cells. (F) Shannon’s equitability showing a correlation between KDM5B gene expression and transcriptomic heterogeneity in ER+ (n = 808) breast tumors in the TCGA data set. All tumors are stratified into four groups with identical sample size based on KDM5B expression levels from low (1) to high (4). (G) Shannon’s equitability showing a correlation between KDM5B gene expression and transcriptomic heterogeneity in ER+ (n = 108) distant metastases of breast cancer in the Metastatic Breast Cancer Project data set. Patient stratification is as same as in (F). (H) Patient survival between high and low transcriptome heterogeneity in all (n = 1,093), ER+ (n = 808) and ER− (n = 237) breast tumors in the TCGA data. All patients are stratified into two groups with identical sample size based on the transcriptome heterogeneity. In (F) and (G), the outer violin indicates the entire distribution, the inner violin in white indicates the interquartile range, the “.” and “+” inside the violin show the median and mean value, respectively. See also Figure S3.
To assess the effects of KDM5 activity on cellular transcriptomic heterogeneity, we determined the cell-to-cell distance among cells based on single cell RNA-seq data. Interestingly, KDM5i treatment decreased cell-to-cell transcriptomic heterogeneity of luminal ER+ breast cancer cells, with the exception of T-47D cells, and increased it in the SUM159 mesenchymal cell line (Figure 3C). In contrast to short-term C70 treated cells, the cell-to-cell transcriptomic heterogeneity of KDM5iresistant C70R cells was similar to parental MCF7 cells. Fulvestrant-treated MCF7 cells had higher heterogeneity than parental MCF7 cells and this was further increased in the FULVR population, but decreased after KDM5i treatment (Figure 3C). Analysis of changes in the Gini index also demonstrated a decrease for the majority of genes after C70 treatment in luminal ER+, but not in the SUM159 mesenchymal breast cancer cell line, further suggesting that KDM5 inhibition decreases transcriptomic heterogeneity especially in hormone-sensitive and endocrine-resistant cells (Figure 3D). The observation that C70 treatment does not decrease cellular transcriptomic heterogeneity in T47D cells (Figure 3C) and does not sensitize these cells to fulvestrant (Figure 1B) further supports our hypothesis that KDM5 inhibition decreases therapeutic resistance by decreasing cell population heterogeneity. Metacore analysis of genes with a decreased Gini index after C70 treatment demonstrated enrichment for proliferation and survival-related pathways including IGF and ESR1/AP1 signaling (Figure 3E), which may contribute to the enhanced responsiveness of C70-treated cells to fulvestrant. These results provide strong experimental data to support our hypothesis that KDM5 HDMs are key regulators of cellular transcriptomic heterogeneity and can decrease therapeutic resistance via this function. Furthermore, they also demonstrate that endocrine resistance is associated with increased cellular transcriptomic heterogeneity.
To validate these findings in human primary breast tumor samples, we calculated the Shannon’s equitability of transcriptomic heterogeneity of breast tumors in three different ways (based on the gene, exon, and exon-junction levels) in the TCGA breast cancer patient cohort (TCGA, 2012) and analyzed potential associations of the extent of heterogeneity with KDM5B mRNA levels. The KDM5B mRNA level showed a statistically significant association with Shannon’s equitability when analyzing all or only ER+ breast tumors, but this association was not or much less significant in ER− tumors depending on how transcriptional heterogeneity was calculated (Figures 3F and S3E). KDM5B mRNA levels also showed significant association with Shannon’s equitability in treatment-resistant distant metastases of ER+ breast cancer (Figure 3G), implying that KDM5B may play a role in both disease progression and therapy resistance. To assess if this observation is unique to KDM5B, we also analyzed possible associations between transcriptomic heterogeneity and the expression of each of the 18 known HDMs and 12 housekeeping genes in the TCGA data (Figure S3F). We found that higher expressions of multiple histone demethylases correlated with higher transcriptomic heterogeneity, but only KDM5B, KDM5C, and KDM6B, showed significant correlation only in luminal ER+ but not in ER− breast tumors. In contrast, housekeeping genes showed the opposite pattern and their lower expression was correlated with higher transcriptomic heterogeneity. These data imply that histone demethylases in general may play a role in regulating transcriptomic heterogeneity within tumors, but only KDM5B, KDM5C, and KDM6B are specific mediators of this heterogeneity in ER+ breast cancers.
To investigate if transcriptomic heterogeneity is simply a reflection of genetic heterogeneity, we also analyzed associations between subclonal mutation fraction and KDM5B mRNA levels in the TCGA cohort. KDM5B mRNA levels were negatively correlated with subclonal mutation fraction in ER− tumors but it was not significant in ER+ tumors (Figure S3G). Similarly, the percent of subclonal mutations in KDM5i- and endocrine-resistant MCF7 cells did not correlate with transcriptomic heterogeneity (Figure S3H). To investigate the clinical relevance of transcriptomic heterogeneity in breast cancer, we analyzed molecular data from 1,093 invasive breast carcinomas in the TCGA. Patients with high transcriptomic heterogeneity ER+ tumors had shorter overall survival than patients with low transcriptomic heterogeneity tumors (Figure 3H). High transcriptomic heterogeneity had a hazard ratio of 1.85 (95% CI 1.11–3.08, p = 0.0169) in ER+ tumors compared to low transcriptomic heterogeneity. Thus, our results suggest that cellular phenotypic but not genetic heterogeneity may underlie resistance to endocrine therapies in ER+ breast tumors and that this trait is regulated by KDM5 HDM activity.
Mechanism of acquired KDM5i resistance
KDM5i are potential therapeutic agents in breast and other cancer types (Johansson et al., 2016). However, inherent or acquired resistance to targeted therapies inevitably occurs during cancer treatment (Gerlinger et al., 2014). Characterizing mechanisms of resistance can aid in the identification of key downstream targets of drugs that mediate their tumor suppressive effects. Thus, we generated and analyzed derivatives of MCF7 cells that acquired resistance to C70 (C70R) and C49 (C49R) during prolonged culture. The IC50 of KDM5i-resistant (KDM5IR) cells significantly increased compared to the parental line, and each cell line was resistant to both KDM5i (Figure 4A) and displayed morphology changes characterized by tighter epithelial clusters (Figure 4B). Consistent with this enhanced epithelial morphology, gene expression profiling demonstrated a decrease in EMT-related genes (Figure S4A and Table S2). C70R and C49R cells showed largely overlapping gene expression differences compared to parental MCF7 cells (Figure S4B), which was also reflected in the commonality of signaling pathways enriched in differentially expressed genes (Figure S4A). Interestingly, the top 500 genes up-regulated in C70R compared to MCF7 cells showed enrichment in genes highly expressed in FULVR and tamoxifen-resistant (TAMR) cells, while the opposite was observed for down-regulated genes (Figure 4C and Table S3), implying that resistance to endocrine therapies and KDM5i may have common underlying mechanisms. Indeed, FULVR, TAMR, and ESR1Y537S-expressing MCF7 cells were also more resistant to KDM5i than parental MCF7 cells (Figure 4D), although KDM5IR cells retained sensitivity to endocrine therapies (Figure S4C).
Figure 4. Characterization of acquired KDM5i resistance.
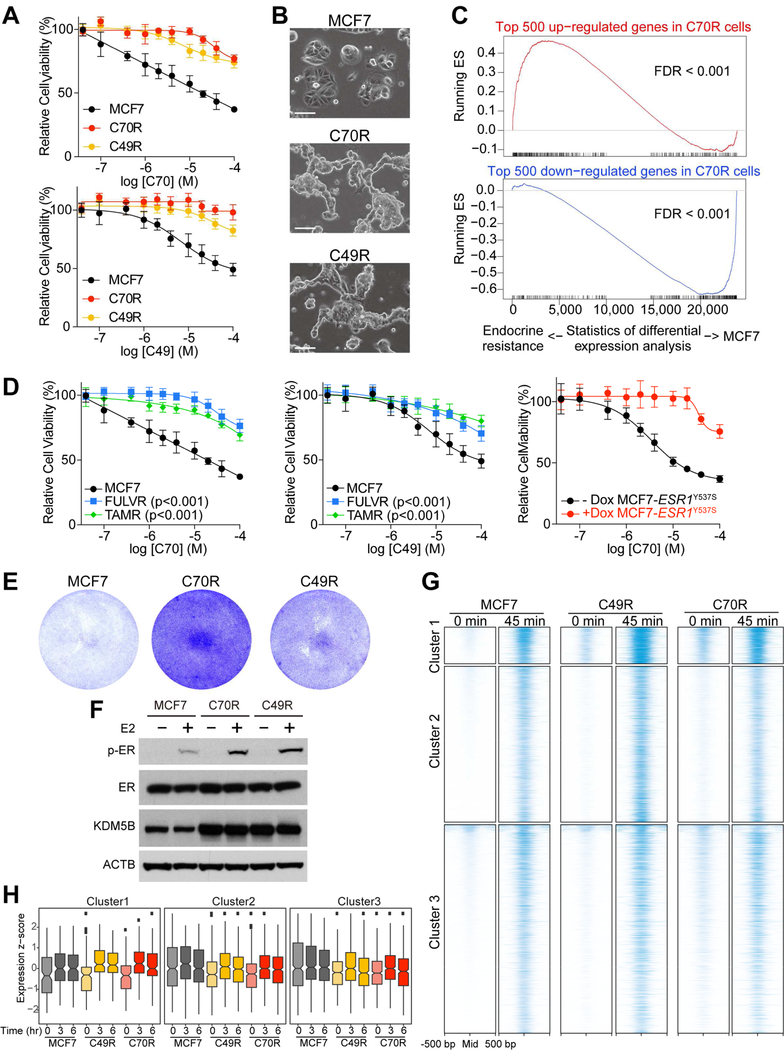
(A) Cellular viability of MCF7, C70R and, C49R cells after treatment with C70 or C49. (B) Morphology of MCF7, C70R, and C49R cells. Scale bars, 100 µm. (C) GSEA plots depicting the relationship between genes in C70R cells and genes in endocrine resistant cells. Genes are ranked by the statistical significance of differential expression analysis between MCF7 and endocrine resistant cells (FULVR and TAMR) in x-axis, with up genes in endocrine resistant cells on the left side. The enrichment score of top 500 up or down genes in C70R compared to MCF7 cells are plotted as red and blue curve, respectively. (D) Cellular viability after treatment with C70 or C49 in FULVR, TAMR, and in MCF7-ESR1Y537S cells. (E) Colony growth of MCF7 and KDM5i-resistant cells in charcoal-stripped medium. (F) Immunoblot for the indicated proteins following E2 treatment. (G) ER chromatin binding peaks (±500 bp peak summit) in MCF7, C49R, and C70R cells after estrogen deprivation (0 min) and 45 min after E2 treatment. Only the ER binding peaks responding to E2 treatment in MCF7 cells are shown. (H) Integrated analysis of associations between gene expression changes at different time points (0–6 hr) after E2 treatment and ER chromatin binding in the indicated clusters and cell lines. The box indicates the interquartile range (IQR), the line inside the box shows the median and whiskers show the locations of either 1.5×IQR above the third quartile or 1.5×IQR below the first quartile. In (A) and (D), Error bars represent s.d., n = 6. See also Figure S4 and Tables S2, S3, S4.
We then sought to further explore the potential relatedness of endocrine and KDM5i resistance in ER+ breast cancer cells. Pathway analysis of genes upregulated in KDM5IR cells compared to KDM5i-treated parental MCF7 cells showed enrichment in ER and AR (androgen receptor) signaling (Figure S4D) implying a gain of hormonal responsiveness. Similarly, we confirmed that ER protein levels decreased after short-term C70 treatment in most cell lines but was close to parental MCF7 levels in C70R and C49R cells (Figure S4E,F). In line with this finding, we found that KDM5IR cells can proliferate without estrogen (Figure 4E) and showed higher levels of phosphorylated ER after estradiol (E2) treatment compared to MCF7 cells (Figure 4F). To assess whether these observations are due to alterations in ER chromatin binding in KDM5IR cells, we performed ER ChIP-seq before and after E2 stimulation. MCF7 cells cultured in estrogen-depleted conditions had very few ER binding peaks with a dramatic increase 45 min after E2 stimulation (Figure 4G), which is consistent with previous studies (Figure S4G), although, as expected, some variability was observed among different batches of MCF7 cells (Ben-David et al., 2018). In contrast, in KDM5IR cells a subset of ER binding peaks (cluster 1) was present even in estrogen-depleted conditions and increased to a much higher level after E2-treatment than what was observed in parental cells (Figure 4G). The increased ER binding was functionally relevant as we detected more pronounced upregulation of associated genes following E2 treatment in KDM5IR compared to parental MCF7 cells, especially for cluster 1 genes (Figure 4H and Table S4). Cluster 1 genes also showed significant enrichment for genes highly expressed in KDM5IR cells (Figure S4H) implying that the increased ER binding may contribute to the upregulation of the associated genes. Pathway analysis showed that cluster 1 genes were enriched for glucocorticoid receptor signaling and metabolic processes (Figure S4I), and thus, their higher basal level and enhanced upregulation following E2 treatment in KDM5i-resistant cells may explain the E2-independence and faster growth of these cells.
To explore potential other changes in the epigenetic landscape of KDM5IR cells in further detail, we performed mass spectrometry analysis of histone modifications. We detected an increase in multiple histone modifications (Figure S4J), which was also confirmed by immunoblotting (Figures S4K). Among all modifications analyzed, only H3K27me3 and H3K27me2 containing peptides were more abundant in both C70R and C49R compared to parental MCF7 cells. Investigating the expression of enzymes that regulate H3K27 methylation in our RNA-seq data revealed a significant (1.5x fold change, q value = 1.5e-06) increase of SUZ12, a component of the PRC2 complex that also contains the EZH2 H3K27 methyltransferase (Schuettengruber et al., 2017), which we verified by immunoblot analysis (Figure S4K). To evaluate the role of H3K27me3 upregulation in KDM5i resistance, we then tested the effect of the EZH2 inhibitor GSK126 (McCabe et al., 2012) on sensitivity to KDM5i. We found that treatment with GSK126 decreased global H3K27me3 levels and rendered both C70R and C49R cells more sensitive to KDM5i (Figures S4L,M). These results suggest that the increased PRC2 activity and H3K27me3 in KDM5IR cells led to the acquisition of a less-differentiated more basal/stem cell-like epigenetic state (Laugesen and Helin, 2014) associated with decreased sensitivity to KDM5 inhibition. These results also imply that KDM5i-resistance is likely due to epigenetic mechanisms.
Single cell profiling of drug-resistant cells
We then explored our single cell RNA-seq data to determine whether we could detect rare cells with gene expression signatures of drug-resistant cells prior to treatment and whether drug-resistant and drug-treated cells show similar gene expression profiles. Thus, we selected genes differentially expressed between parental MCF7 and FULVR or fulvestrant-treated cells based on bulk RNA-seq data (Figure S5A, Table S5) and investigated if single cells could be classified into one of these three transcriptionally distinct groups (i.e., parental MCF7, FULVR, and MCF7+FULV). While almost all single cells in FULVR population were classified as FULVR, very few such cells were present in parental MCF7 and in fulvestrant-treated cell populations (Figure 5A), implying that drug-resistant clones were selected from a mixed population during treatment. The majority of FULV-treated cells were classified as “MCF7+FULV” and FULVR cells lacked such a cell population further suggesting that FULVR cells represent a distinct subpopulation (Figure 5A). Similarly, we defined the transcriptional signatures of KDM5-C70-treated and C70R cells (Figure S5B) and classified single cells into one of the three states (i.e., parental MCF7, C70R, and MCF7+C70). In contrast to FULVR cells, cells classified as “MCF7+C70” were present in the C70R cell population although the majority of C70R cells had C70R signature (Figure 5B). In parental MCF7 cells the majority of single cells were classified as “parental” with a few cells representing C70R and MCF7+C70 states, while the “parental” state was rarely detected in C70R cells (Figure 5B). CYTOF experiments also confirmed that FULVR cells represent a very distinct cell population, while fulvestrant and C70-treated, and C70R cells are more related to parental MCF7 cells (Figure 5C). Thus, two different types of single cell analysis methods suggested that resistance to fulvestrant is due to selection for a distinct cell population, while resistance to C70 inhibitor treatment is not due to selection for such a cell population but rather attributable to changes in the epigenetic state such as upregulation of H3K27me3 (Figures S4L,M).
Figure 5. Single cell profiling of drug-resistant cells.

(A) Hexagonal plots depicting the bootstrap classification of single cells in populations of MCF7, fulvestrant-treated (MCF7+FULV), and FULVR cells. Each point is one single cell and is positioned along axes according to its bootstrapping classification score for the indicated cell identity. Black, green, and blue cells are classified as MCF7, MCF7+FULV, and FULVR cells, and grey cells are unclassified. A few cells are classified as combination of two cell identities and are represented by mixed color of the two, and positioned at the edges of 2, 6, and 10 o’clock. (B) Hexagonal plots depicting the bootstrap classification of single cells in populations of MCF7, C70-treated MCF7 (MCF7+C70), and C70R cells. Each point is one single cell and is positioned along axes according to its bootstrapping classification score for the indicated cell identity. Black, light blue, and red cells are classified as MCF7, MCF7+C70, and C70R cells, and grey cells are unclassified. A few cells are classified as combination of two cell identities and are represented by mixed color of the two, and positioned at the edges of 2, 6, and 10 o’clock. (C) Projection of SPADE tree for each cell line. Colors and size of the node correspond to the percentage of cells that belongs to a given cluster. Light gray dots mark cells with low marker expression in all channels. (D) Relative proportions of cells in FULVR population with MCF7, MCF7+C70, and C70R gene signature. (E) Relative proportions of cells in C70R population with MCF7, MCF7+FULV, and FULVR gene signature. See also Figure S5 and Table S5.
Lastly, we explored our inDrop data for potential overlaps between endocrine- and KDM5iresistant cell populations. In line with our observation that FULVR cells are also resistant to KDM5i, we detected an increase in the percent of cells with C70R signature in the FULVR population (Figure 5D). In contrast, the FULVR signature was present in the same fraction of C70R cells as in parental MCF7 population (Figure 5E). Analysis of the cellular expression pattern of selected estrogen-regulated genes (e.g.,TFF1 and CDKN1A) and genes related to endocrine (e.g., SPDEF) and KDM5i (e.g., ZMYND8 and PARP16) resistance were consistent with these findings (Figure S5C). These molecular data provide a mechanistic explanation for our functional data on the relatedness of responses and resistance to anti-estrogens and KDM5i.
Modes of resistance to anti-estrogens and KDM5i
To investigate whether there is a pre-existing resistant population selected during treatment or a de novo acquisition of this phenotype, we labeled MCF7 cells with the ClonTracer barcode library (Bhang et al., 2015), which enables the high-resolution tracking of more than 1 million cancer cells during drug treatment (Figure S6A). To distinguish pre-existing clones from acquired alterations, four replicates of barcoded cells with comparable starting barcode representations were subjected to longterm inhibitor treatment until resistance was achieved as confirmed by a significant (p<0.001) shift in the IC50 curves (Figure 6A). FULVR cells became ER-independent as downregulation of ER did not affect their viability (Figure S6B,C). If resistance is driven by newly acquired alterations, distinct barcoded populations would emerge in independent replicates, while if pre-existing clones were the major source of resistance, there should be selective enrichment for the same sets of barcodes in multiple replicates. The treatment with FULV or TAM significantly reduced the barcode complexity (Figures 6B,C and S6D) and more than 90% of the barcodes were shared by all four replicates (Figures 6D and S6E). These findings strongly indicate that the vast majority of fulvestrant- and tamoxifen-resistant clones were pre-existing in the parental MCF7 cell population and were highly selected during treatment. Moreover, the barcodes found in fulvestrant-resistant clones appeared to be largely overlapping with the barcodes found in tamoxifen-resistant clones (Figure 6E), indicating that these two different endocrine therapies select for the same pre-existing cell population. In contrast, there was minimal selection during C70 and C49 treatment since the barcode pool of the KDM5i-resistant population was not appreciably different from parental MCF7 cells at the same passage (Figures 6F,G and S6D,E), suggesting resistance to KDM5i is not due to selection for preexisting resistant cells.
Figure 6. Resistance to anti-estrogens and KDM5i in MCF7 cells.

(A) Cellular viability after treatment with C70 and C49, fulvestrant or tamoxifen in parental and cells with acquired resistance to the indicated agents. Error bars represent s.d., n = 6. (B) Bar graph depicting percentage of unique barcodes in FULVR and TAMR relative to parental MCF7 cells at same passage. (C) Pie chart depicting percentage of barcodes overlapping between MCF7 and FULVR/TAMR cells. (D) Bar graph depicting percentage of total barcodes shared among all replicates in each of the indicated cell populations. (E) Pie chart depicting percentage of barcodes overlapping between FULVR and TAMR. (F) Bar graph depicting percentage of unique barcodes in C70R and C49R relative to MCF7 cells at same passage. (G) Pie chart depicting percentage of barcodes overlapping between MCF7 and C70R/C49R cells. (H) Panels show model-predicted percentages of total barcodes shared by quadruplicates after simulation for different mutation probabilities (µ) and seeded fractions of preexisting resistant barcodes (ρ) in the treatment with the indicated inhibitors compared to the same statistic from the experimental data (horizontal line). The growth rates in simulations were based on experimental data. (I) Mutated genes detected in resistant but not in MCF7 cells. Colors and stars indicate the type of mutations and significance of downstream GSEA in the corresponding resistant cell lines, respectively. The significance of downstream GSEA represents the downstream genes of mutations are significantly enriched in up/down regulated genes in the corresponding resistant cell lines. See also Figure S6 and Table S6.
We then performed mathematical modeling of the barcode data in order to estimate the fraction of pre-existing barcodes in the FULVR, TAMR, C70R, and C49R cells. We utilized a stochastic population dynamics model (Bhang et al., 2015; McDonald and Michor, 2017) parameterized using the growth kinetics of parental as well as endocrine- and KDM5IR cells (Figure 6H). For each experimental condition, we performed 10 independent runs of the stochastic simulations (see STAR Methods) and estimated the fraction of pre-existing barcodes for each condition and for different estimates of the rates per cell division that generate a resistant cell type from the parental population. Given the experimentally observed high fraction of resistant barcodes shared by replicates relative to parental cells (FULV:MCF7 ratio=23.94) (Figure S6F), we found that expected rates of generating resistant cell types (mutation probability) were less than 10−5 per cell division in FULV treatment (Figure S6G), which is in agreement with experimental findings showing the selection of preexisting resistant clones. At this mutation probability, we identified the fraction of preexisting barcodes between 0.5% to 1.0% for FULVR (Figure S6G) based on the horizontal line showing the proportion of preexisting resistant barcodes identified in the experiment (Figure 6H). Similarly, we identified the preexisting proportion of barcodes as around 1.0% for tamoxifen-resistant populations at a similar mutation probability. In C70R and C49R cells, we found that the larger mutation rate (0.05–0.1% mutations per cell division) fits to the horizontal line (Figure 6H) to recapitulate the observed proportion of about 4%. Finally, to determine if the resistant cell populations were genetically distinct, we performed exome sequencing of resistant and parental MCF7 cells and also sequenced the lentiviral integration sites. We found numerous genetic variants present in both fulvestrant- and tamoxifen-resistant cells, and GSEA showed that the expression of genes downstream of some of the genetic variants were significantly altered (Figure 6I and Table S6). Several of the genetic variants found in both FULVR and TAMR cells were related to glutamate metabolism (e.g., HIF1A, PCDHGA12, TMX4, and TNR) and almost all of them were also detected in metastatic lesions of breast cancer patients resistant to endocrine therapies (Cohen et al., 2017) confirming their physiologic relevance.
DISCUSSION
Hormone-dependent ER+ luminal tumors constitute the most common subtype representing ~70% of all breast cancer cases. Although endocrine therapies are effective for the treatment of both early and advanced-stage disease, inherent and acquired resistance is a major clinical challenge (Osborne and Schiff, 2011). Numerous mechanisms have been proposed to explain endocrine resistance including changes in ER regulators and growth factor signaling pathways (Musgrove and Sutherland, 2009; Osborne and Schiff, 2011). Exome sequencing of metastatic lesions in endocrine-resistant disease identified ESR1 mutations implying that genetic alterations are likely to be responsible for resistance in a subset of cases (Jeselsohn et al., 2017). We have previously shown that a high KDM5B PARADIGM (Vaske et al., 2010) activity score is associated with shorter disease-specific survival in endocrine therapy-treated ER+ breast cancer patients implicating KDM5B in endocrine resistance (Yamamoto et al., 2014). Here we describe a comprehensive characterization of mechanisms of response and resistance to KDM5 inhibitors and their relevance for endocrine sensitivity. We found that inhibition of KDM5B and KDM5A increases sensitivity to fulvestrant in both hormone-sensitive and endocrine-resistant cells. Single cell analysis of drug-sensitive and resistant populations using inDrop and CyTOF as well as lentiviral barcoding confirmed that endocrine resistance is due to the selection for a pre-existing distinct cell population.
Despite the importance of intratumor phenotypic heterogeneity for tumor progression and therapy resistance (Marusyk et al., 2012; Marusyk and Polyak, 2010), our understanding of regulators of this process and our ability to modulate them are very limited. Recent advances in genomic sequencing and single cell technologies have enabled the detailed characterization of tumors at the single cell level (Macaulay et al., 2017). Although most of the single cell studies thus far have focused on defining individual cell types (Tirosh et al., 2016), single cell RNA-seq has also been used to characterize cell-to-cell variability in immune cells in aging (Martinez-Jimenez et al., 2017). Epigenetic regulators such as histone modifying enzymes are critical for the establishment of cell type-specific gene expression patterns, and thus, they are also likely to play a role in modulating cell-to-cell variability in transcription, but this has been mostly investigated in lower level organisms during aging (Booth and Brunet, 2016). We have previously shown that neoplastic and stem cell-like mammary epithelial cells have higher transcriptomic diversity than normal and more differentiated cells based on the analysis of bulk gene expression data (Wu et al., 2010). Here we describe that KDM5B is a regulator of cellular transcriptomic heterogeneity in ER+ luminal breast cancer and its higher expression in ER+ breast tumors is associated with higher transcriptomic, but not genetic heterogeneity and shorter overall survival. Higher cell-to-cell variability increases the probability of therapeutic resistance (Chisholm et al., 2016). Most studies analyzing intratumor heterogeneity have focused on genetic alterations and in many cases therapeutic resistance is due to mutations in genes and pathways targeted by the treatment (McGranahan and Swanton, 2017). However, non-genetic variability such as epigenetic heterogeneity also contributes to therapeutic resistance by multiple different mechanisms (Brock et al., 2009). One possibility is that the distinct epigenetic state of the cells could determine cellular response to treatment (Shibue and Weinberg, 2017). Another option is that subpopulations of phenotypically different cells (e.g., persisters) provide a temporary pool for selection during treatment and facilitate the outgrowth of drug-resistant mutants as demonstrated by the emergence of EGFR(T790M)-positive clones from drug-tolerant subpopulations of lung cancer cells (Hata et al., 2016). Because KDM5B regulates both differentiated luminal epithelial epigenetic states and cellular transcriptomic diversity, KDM5i could decrease the probability of therapeutic resistance in different ways in multiple different cancer types including ER+ luminal breast cancers.
In summary, our data highlights the importance of cellular phenotypic heterogeneity in therapeutic responses and identifies members of the KDM5 HDM family as key epigenetic regulators of this process suggesting that inhibiting KDM5 activity could decrease resistance to cancer therapies.
STAR*METHODS
CONTACT FOR REAGENT AND RESOURCE SHARING
Further information and requests for resources and reagents should be directed to and will be fulfilled by the Lead Contact, Kornelia Polyak, Dana-Farber Cancer Institute, 450 Brookline Ave., Boston, MA 02215, USA. E-mail: kornelia_polyak@dfci.harvard.edu; tel: 617–632-2106; fax: 617–582-8490.
EXPERIMENTAL MODEL AND SUBJECT DETAILS
Breast cancer cohort data
We obtained the normalized gene counts, isoform counts and exon counts data (Level 3, RNAseqV2) and clinical data from The Cancer Genome Atlas (TCGA) Broad GDAC Firehose database (https://gdac.broadinstitute.org/). Normalized microarray gene expression and clinical data of a cohort of 132 primary tumors from tamoxifen-treated patients followed up more than 5-years were obtained from GEO accession number GSE9893 (Chanrion et al., 2008). We also analyzed an unpublished dataset of RNA-seq gene expression RPKM (Reads Per Kilobase of transcript, per Million mapped reads) of a cohort of 109 ER+ distant metastases that are part of the Metastatic Breast Cancer Project (Cohen et al., 2017). Breast cancer patients were >18 years of age and all but one female. Informed consent was obtained from all patients and the study was approved by the Dana-Farber/Harvard Cancer Center Institutional Review Board (DF/HCC Protocol 05–246).
Breast cancer cell lines
Breast cancer cell lines were obtained from ATCC or generously provided by Steve Ethier (SUM cell lines, University of Michigan) and Marc Lippman (MCF7 cells, University of Michigan) and cultured following the provider’s recommendations. Briefly, MCF7, C70R and C49R cells were cultured in DMEM supplemented with 10% FBS, 1% penicillin/streptomycin and 10 µg/ml insulin. FULVR, TAMR, and MCF7 as their corresponding control were cultured in RPMI without phenol red supplemented with 10% charcoal-stripped FBS, 1% penicillin/streptomycin and 10 µg/ml insulin. For estrogen deprivation/stimulation experiments cells were cultured in RPMI without phenol red supplemented with 10% charcoal-stripped FBS, 1% penicillin/streptomycin. Fulvestrant-resistant cells were generated by culturing parental MCF7 cells in phenol red-free RPMI containing 10% charcoal stripped FBS over a period of 3 months in the presence of 10µM fulvestrant, and then maintained them in 1µM fulvestrant.
Barcoding and selection for resistant cells
High-complexity barcode library, ClonTracer, was as a kind gift from Frank Stegmeier (Novartis). Barcoding experiments were performed as previously described. Briefly, MCF7 cells were barcoded by lentiviral infection using 8 µg/ml polybrene. After a 24 h incubation with virus, infected cells were selected with 2 µg/ml puromycin. To ensure that the majority of cells were labeled with a single bar- code per cell, for lentiviral infection we used a target m.o.i. of approximately 0.2, corresponding to 20% infectivity after puromycin selection. Infected cell populations were expanded in culture for the minimal time period to obtain a sufficient number of cells to set up replicate experiments. Barcoded MCF7 cells were treated with four different inhibitors: fulvestrant (10 µM), 4-OHT (5 µM), KDM5-C70 (10 µM) and KDM5-C49 (10 µM). The control groups were treated with 0.1% DMSO. Each group was cultured in quadruplicate. Cells were cultured in DMEM supplemented with 10% FBS, 1% penicillin/streptomycin and 10 µg/ml insulin for KDM5-C70, KDM5-C49 and their corresponding control or RPMI without phenol red supplemented with 10% charcoal-stripped FBS, 1% penicillin/streptomycin and 10 µg/ml insulin for fulvestrant, 4-OHT and their corresponding control. To keep the baseline control population as close as possible to that of the treatment group, each treatment group was cultured at the same passage as their corresponding control group, because random barcode loss during passaging has been reported previously. Genomic DNA was extracted from the frozen cell populations with a QIAamp DNA Mini Kit (Qiagen). We used PCR to amplify the barcode sequence for NGS by introducing Illumina adaptors and 5-bp-long index sequences. Uniquely indexed libraries were pooled in equimolar ratios and sequenced on an Illumina NextSeq500 with single-end 75 bp reads by the Dana-Farber Cancer Institute Molecular Biology Core Facilities.
METHOD DETAILS
Cellular viability assay
Cellular viability assays (N = 6) were performed using CellTiter-Glo (Promega) ten days after treatments and repeated 2–3 times. Cells were plated in 96-well plates and treated with inhibitors. Cells were cultured at 37°C with 5% CO, and the medium was replaced with fresh medium (with or without inhibitors) every two days.
ChIP-seq and RNA-seq
For KDM5B ChIP-seq, 1 × 10⁷ cells were fixed with 2mM DSG (Thermo Fisher Scientific cat#20593) for 30 min at room temperature. DSG was then removed and replaced with fixing buffer (50 mM HEPES-NaOH (pH 7.5), 100 mM NaCl, 1 mM EDTA) containing 1% paraformaldehyde (Electron Microscopy Sciences, 15714) and crosslinked for 10 min at 37°C. For histone modification ChIP-seq, 5 × 10⁶ cells were fixed with 1% paraformaldehyde for 10 min at room temperature. For ER ChIP-seq, 1 × 10⁷ cells were fixed with 1% paraformaldehyde for 10 min at 37°C. Crosslinking was quenched by adding glycine to a final concentration of 0.125 M. Cells were washed with ice-cold PBS and harvested in PBS. The nuclear fraction was extracted by first resuspending the pellet in 1 ml of lysis buffer (50 mM HEPES-NaOH (pH 8.0), 140 mM NaCl, 1mM EDTA, 10% glycerol, 0.5% NP-40, and 0.25% Triton X-100) for 10 min at 4°C. Cells were p elleted, and washed in 1 ml of wash buffer (10 mM Tris-HCL (pH 8.0), 200 mM NaCl, 1 mM EDTA) for 10 min at 4°C. Cells were then pelleted and resuspended in 1 ml of shearing buffer (10 mM Tris-HCl (pH 8), 1 mM EDTA, 0.1% SDS) and sonicated in a Covaris sonicator. Lysate was centrifuged for 5 min at 14,000 rpm to purify the debris. Then 100 µl of 10% Triton X-100 and 30 µl of 5M NaCl were added. The sample was then incubated with 20 µl of Dynabeads Protein G (LifeTechnologies,10003D) for 1 h at 4°C. Primary antibodies were added to each tube and immunoprecipitation (IP) was conducted overnight in the cold room. Crosslinked complexes were precipitated with Dynabeads Protein G for 2 hr at 4°C. The beads were then washed in low salt wash buffer (20 mM Tris-HCl pH 8, 150 mM NaCl, 10 mM EDTA, and 1% SDS) for 5 min at 4°C, high salt wash buffer (50 mM Tris-HCl pH 8, 10 mM EDTA, and 1% SDS) for 5 min at 4°C and LiCl wash buffer (50 mM Tris-HCl pH 8, 10 m M EDTA, and 1% SDS) for 5 min at 4°C. DNA was eluted in elution buffer (100 mM sodium bicarbonate and 1% SDS). Cross-links were reversed overnight at 65 °C. RNA and protein were digested with 0.2 mg/ml RNase A for 30 min at 37°C followed by 0.2 mg/ml Proteinase K for 1 h at 55°C. DNA was purified with phenol-chloroform extraction and isopropanol precipitation. ChIP-seq libraries were prepared using the Rubicon ThruPLEX DNA-seq Kit from 1 ng of purified ChIP DNA or input DNA according to the manufacturer’s protocol. RNA-seq: Total RNA was extracted using the RNeasy Mini Kit (Qiagen). RNA-seq libraries were prepared using Illumina TruSeq Stranded mRNA sample preparation kits from 500 ng of purified total RNA according to the manufacturer’s protocol. The finished dsDNA libraries were quantified by Qubit fluorometer, Agilent TapeStation 2200, and RT-qPCR using the Kapa Biosystems library quantification kit according to manufacturer’s protocols. Uniquely indexed libraries were pooled in equimolar ratios and sequenced on an Illumina NextSeq500 with single-end 75 bp reads in the DanaFarber Cancer Institute Molecular Biology Core Facilities.
Xenograft assays
For xenograft assays 5–6-weeks old female NOD.Cg-Prkdcscid Il2rgtm1Wjl/SzJ mice were purchased from The Jackson Laboratory. Twenty-four hours prior to implantation of MCF7 cells, estrogen pellets (0.18 mg/pellet 17β-estradiol, 90-day release, Innovative Research of America) were implanted subcutaneously between the scapulae of mice. Tumors were induced by bilateral orthotopic mammary fat pad injection of 5 × 10⁶ cells suspended in 100 µl of culture medium/Matrigel Growth Factor Reduced Basement Membrane Matrix, Phenol Red-Free (Corning) in a 1:1 ratio. Animal experiments were performed by the Lurie Family Imaging Center following protocols approved by the Dana-Farber Cancer Institute Animal Care and Use Committee. After 27 days, mice were randomized to treatment groups based on tumor size. Mice were administered FULV (5 mg per dose, weekly), KDM5 inhibitor 48 (100 mg per kg, BID), combination of FULV and 48, or vehicle only (control) for 21 days. Tumors implanted in mice were imaged using magnetic resonance imaging (MRI). Mice were euthanized and tumors collected 22 days after injection.
Immunoblotting
Cells were lysed in RIPA buffer. Proteins were resolved in SDS-polyacrylamide gels (4–12%) and transferred to PVDF membranes by using a Tris-glycine buffer system. Membranes were blocked with 2.5% milk powder in 0.1% Tween20 in TBS (TBS-T) for 1 h at room temperature followed by incubation with primary antibodies in 2.5% milk TBS-T. The membranes were developed with Immobilon substrate (EMD Millipore).
Immunofluorescence analyses
After deparaffinization and rehydration, slides were subjected to antigen retrieval in citrate buffer (pH 6; Dako) for 20 min in a steamer. Blocking solution (100% goat serum) was applied for 10 min. Incubation with primary antibody in PBS with 5% goat serum was held overnight at 4 °C in a moist chamber. Secondary antibody was applied for 1 h at room temperature. Samples were mounted with VectaShield HardSet Antifade Mounting Medium with DAPI (Vector Laboratories). Imaging was performed in Servicebio (http://www.servicebio.com).
Antibodies and inhibitors
Compounds KDM5-C49 and KDM5-C70 were synthesized following the reported procedure (Tumber et al., 2017), and also sourced from commercial vendors. All the chemical reagents and anhydrous solvents were purchased from Sigma-Aldrich and Strem. Preparative purification was performed on a Waters semi-preparative HPLC system using a Phenomenex Luna C18 column (5 micron, 30 × 75 mm) at a flow rate of 45 mL/min. The mobile phase consisted of acetonitrile and water (each containing 0.1% trifluoroacetic acid). A gradient of 10% to 50% acetonitrile over 8 min was used during the purification. Fraction collection was triggered by UV detection (220 nm). Analytical analysis was performed on an Agilent LC/MS (Agilent Technologies, Santa Clara, CA). A 7 min gradient of 4% to 100% Acetonitrile (containing 0.025% trifluoroacetic acid) in water (containing 0.05% trifluoroacetic acid) was used with an 8 min run or a 3 min gradient of 4% to 100% Acetonitrile (containing 0.025% trifluoroacetic acid) in water (containing 0.05% trifluoroacetic acid) was used with a 4.5 min run time at a flow rate of 1 mL/min. Phenomenex Luna C18 column (3 micron, 3 × 75 mm) or Phenomenex Gemini Phenyl column (3 micron, 3 × 100 mm) was used at a temperature of 50 °C. Purity determination was performed using an Agilent Diode Array Detector. Mass determination was performed using an Agilent 6130 mass spectrometer with electrospray ionization in the positive mode. 1H NMR spectra were recorded on Varian 400 MHz spectrometers. Chemical shifts are reported in ppm with undeuterated solvent (DMSO-d6 at 2.49 ppm) as internal standard for DMSO-d6 solutions. All of the analogs tested in the biological assays have purity greater than 95%, based on both analytical methods. High resolution mass spectrometry was recorded on Agilent 6210 Time-of-Flight LC/MS system. Confirmation of molecular formula was accomplished using electrospray ionization in the positive mode with the Agilent Masshunter software (version B.02). Fulvestrant (I4409), 4hydroxytamoxifen (4-OHT, T176) and β-Estradiol (E2758) were from Sigma, GSK126 was purchased from Sellechem, and KDM5 inhibitor 48 was provided by Genentech under a Material Transfer Agreement. Antibodies used for immunoblotting were anti-KDM5B (Sigma, HPA027179), antiH3K4me3 (Abcam, ab1012), anti-H3K4me2 (Millipore, 07–030), anti-H3K4me1 (Abcam, ab8895), and anti-Histone H3 (Abcam, ab1791), β actin (Sigma, A2228), anti-H3K27Ac (Abcam, ab4729), antiH3K27me3 (Abcam, ab6002), anti-H3K27me2 (Abcam, ab24684), anti-H3K36me2 (Abcam, ab9049), anti-H3K9Ac (Abcam, ab4441), anti-H3K79me2 (Abcam, ab3594), anti-SUZ12 (Cell Signaling, 3737), anti-EZH2 (Cell signaling, 5246), anti-ERα (Cell Signaling, 8644) , anti-phospho-ERα Ser118 (Cell Signaling, 2511). The antibodies used for ChIP were anti-KDM5B (Novus Biologicals, 22260002), anti-H3K4me3 (Abcam, ab8580), anti-H3K4me2 (Millipore, 07–030) and anti-ERα (Cell Signaling, 8644). Antibodies used for Immunofluorescence were anti-Cleaved Caspase-3 (Cell Signaling, 9661; 1:200 dilution), anti-Histone H3 phospho S10 (Abcam, ab5176; 1:200 dilution), anti-H3K4me3 (Abcam, ab8580; 1:500 dilution) and goat anti-rabbit IgG (H+L) conjugated to Alexa Fluor 488 (Thermo Fisher Scientific; 1:100 dilution).
CRISPR experiments
Lentiviral Blast-Cas9, lentiviral sgRNA non-targeting control, KDM5B lentiviral sgRNA and KDM5A lentiviral sgRNA were purchased from Dharmacon. Following selection with blasticidin for Cas9, MCF7 cells were infected with each sgRNA and selected with puromycin. Knockout efficacy was determined by western blotting and cells were seeded for cell viability assays as described above.
inDrop
8 × 10⁴ cells were pelleted and resuspended in 1 ml of 15% OptiPrep Density Gradient Medium (Sigma). Single-cell RNA-seq was performed using the inDrop protocol on a custom system as described (Zilionis et al., 2017). Hydrogel beads with version 3 oligonucleotide design were purchased from the Harvard Single Cell Core (https://iccb.med.harvard.edu/single-cell-core). Microfluidic encapsulation chips were purchased from 1CellBio (part no. 10080). Library preparation was performed as described (Zilionis et al., 2017).
Mass cytometry
Antibodies used for mass cytometry in this study are listed in a table above. All antibodies were purchased in carrier-free buffers from the indicated sources and conjugated with the respective lanthanide metals by the CyTOF Antibody Resource and Core at Brigham Women’s Hospital, Boston, MA, USA. Cells were treated with 50 µM IdU-127 (Fluidigm, South San Francisco, CA, USA) for 30 min and 100 µM of the intercalator-103Rh (Fluidigm) for 15 min at 37°C in their respective medium. Next, 1×10⁶ cells of each sample were barcoded using the Cell-ID 20-Plex Pd Barcoding Kit (Fluidigm) according to the manufacturer’s instructions. Barcoded samples were pooled and stained simultaneously. Cells were fixed for 10 min with paraformaldehyde (Electron Microscopy Sciences, Hattfield, PA, USA) at a final concentration of 1.6 % followed by Fc-receptor block (Human TruStain FcX, Biolegend, San Diego, CA) for 10 min and surface antibody staining for 30 min at room temperature. Subsequently, cells were permeabilized with methanol for 10 min on ice and incubated with the antibody cocktail for intracellular epitopes for 30 min. Cells were kept at 4°C overnight in Fix and Perm Buffer (Fluidigm) supplemented with Intercalator-IR (Fluidigm) 1:2000. Prior to analysis cells were washed with water, resuspended in water containing EQ™ Four Element Calibration Beads (Fluidigm) (1:10) and filtered through a 35 µm strainer. Samples were acquired at a CyTOF Helios instrument (Fluidigm), normalized as previously described (Bendall et al., 2011) and analyzed with Cytobank (Cytobank, Inc., Mountain View, CA). For all washes during staining Cell Staining Media (PBS with 0.5% BSA, 0.02% NaN3) was used.
Mass spectrometry analysis of histone modifications
Briefly, histones were isolated from cell nuclei using acid extraction, biochemically prepared, and analyzed by mass spectrometry against a reference of stable isotope-labeled synthetic peptide standards exactly as described (Creech et al., 2015).
QUANTIFICATION AND STATISTICAL ANALYSIS
ChIP-seq analysis
Adapter sequences of ChIP-seq raw reads are removed by using cutadapt (DOI:10.14806/ej.17.1.200). Trimmed reads are aligned by bowtie2 using default parameters to version hg19 of human genome. The samtools (Li et al., 2009) and picard (http://broadinstitute.github.io/picard) are used to sort and remove duplicated reads to avoid PCR bias from the sequencing process. Each group of libraries after the above pre-processing is down-sampled (without replacement) to a fixed number of reads. Peak calling (identification of regions of ChIP-seq enrichment over background) is performed by using MACS2 (Zhang et al., 2008) with parameters of “--extsize=146 –nomodel”. The “broad peak” option is on when identifying binding regions of KDM5B, H3K4me3 and H3K4me2.
RNA-seq analysis
Raw RNA-seq reads are aligned to version hg19 of human genome by using Tophat2 (Kim et al., 2013) with the default parameters. Gene counts are quantified by using HT-seq (Anders et al., 2015) with REFSEQ annotation. Differentially expressed genes are identified by using DEseq2 (Love et al., 2014) with cutoff of q value < 0.01 and fold change > 1.5, ranked by the statistics.
Barcoding data analysis
We followed the method used in Bhang et al. 2015 with small modifications. In details, all sequencing reads are trimmed by using 3’ adaptor sequence: AGCAGAGCTACGCACTCTATGCTAGTGCTAGAGATCGGAAGAGCACACGTCTGAACTCCAGTCA CTCACGATCGTATCTCGTATGCCGTCTTCTGCTTG with minimum alignment length of 40-nt. The trimmed reads with Ns or less than 30-nt or without the WS x 15 pattern are removed. Then the 30-nt barcode sequences are extracted from the 3’ prime end of the trimmed sequences. Barcodes with an estimated Phred quality score of at least 10 for all nucleotides and with an average Phred quality score greater than 30 are kept as qualified barcodes. The barcodes with only one count are excluded from the analyses to avoid the noise derived from the sequencing error.
Exome Sequencing
Exome sequencing was performed in the Dana-Farber Cancer Institute Center for Cancer Genome Discovery.
Library Preparation and Sequencing:
Sequencing libraries were prepared as previously described (Brastianos et al., 2013). Briefly, gDNA from five cell lines and one human CEPH normal (http://hapmap.ncbi.nlm.nih.gov/citinghapmap.html.en) were fragmented to 250 bp using Adaptive Focused Acoustics (AFA) ultra-sonication (Covaris Inc., Woburn, MA) and further purified using Agencourt AMPure XP beads (Beckman Coulter, Inc., Indianapolis, IN). A total of 50 ng of size-selected DNA was ligated to DNA barcoded adaptors during library preparation (KAPA HTP DNA Library Preparation Kit, KK8234, Kapa Biosystems, Inc., Wilmington, MA). Each library was made with sample-specific barcodes and quantified using an Illumina MiSeq Nano flow cell (Illumina Inc., San Diego, CA). For exome enrichment, the 6 libraries were pooled in 3 × 2-plex to a total of 750 ng per pool, and exonic regions were captured with the SureSelect Target Enrichment system using the Human All Exon V5 hybrid capture kit (Agilent Technologies, Santa Clara, CA). All captures were further pooled and sequenced in two lanes of the HiSeq 2500 system in Rapid Run Mode (Illumina Inc., San Diego, CA).
Demultiplexing, Mapping, SNV, Indel and Copy Number Calling:
Samples sequenced in the same lane were demultiplexed using the Picard tools. Read pairs were aligned to the hg19 reference sequence using the Burrows-Wheeler Aligner (Li and Durbin, 2009), and data were sorted and duplicate-marked using Picard tools. The alignments were further refined using the Genome Analysis Toolkit (GATK) (DePristo et al., 2011; McKenna et al., 2010) for localized realignment around indel sites (https://software.broadinstitute.org/gatk/documentation/tooldocs/current/org_broadinstitute_gatk_tools _walkers_indels_IndelRealigner.php). Recalibration of quality scores was also performed using the GATK (http://gatkforums.broadinstitute.org/discussion/44/base-quality-score-recalibration-bqsr). Mutation analysis for single nucleotide variants (SNV) was performed using MuTect v1.1.4 (Cibulskis et al., 2013) in paired mode using the CEPH as the “project normal,” and indel calling was performed using the GATK SomaticIndelDetector tool. SNVs and indels were annotated using Variant Effect Predictor (McLaren et al., 2010). Copy number variants were identified using RobustCNV, an algorithm in development at the CCGD (manuscript in preparation). RobustCNV relies on localized changes in the mapping depth of sequenced reads to identify changes in copy number at the loci sampled during targeted capture. This strategy includes a normalization step in which systematic bias in mapping depth is reduced or removed using robust regression to fit the observed tumor mapping depth against a panel of normals (PoN) sampled with the same capture bait set. Observed values are then normalized against predicted values and expressed as log2ratios. A second normalization step is then done to remove GC bias using a loess fit. Finally, log2ratios are centered on segments determined to be diploid based on the allele fraction of heterozygous SNPs in the targeted panel. Normalized coverage data is next segmented using Circular Binary Segmentation (Olshen et al., 2004) with the DNAcopy Bioconductor package. Finally, segments are assigned “gain,” “loss,” or “normal-copy” calls using a cutoff derived from the within-segment standard deviation of post-normalized mapping depths and a tuning parameter which was set based on comparisons to array-CGH calls in separate validation experiments.
Resistant cell-specific mutations and downstream GSEA analysis
Resistant cell-specific mutations in each cell line were defined as mutations observed in that resistant cell line with variant allele frequency > 10% and coverage > 30, but not observed in parental MCF7 cell line. Downstream GSEA is a pathway-based algorithm. We searched seven available pathway databases (KEGG, BIOCARTA, REACTOME, NCI, SPIKE, HUMANCYC and PANTHER) to identified downstream genesets of each resistant-specific mutation. Then we used GSEA algorithm to calculate whether these downstream genesets are significantly differentially expressed between parental MCF7 and corresponding resistant cell line. The GSEA q value can thus represent the functional effect of each resistant cell-specific mutation.
List of lentiviral integration sites in drug-resistant single clones:
| Clone name | Insertion Site | Intergenic/Intronic/Exonic | Nearest Gene |
Nearest Exon | Distance (bp) |
|---|---|---|---|---|---|
| bFULVR_1 | Chr6: 111656384 | Intronic | REV3L | Upstream of exon 23 | 441 |
| bFULVR_2 | Chr10: 5058744 | Intronic | AKR1C2 | Downstream of exon 1 | 1,348 |
| bFULVR_3 | Chr3: 167413258 | Intronic | PDCD10 | Downstream of exon 6 | 126 |
| bFULVR_4 | Chr3: 177415316 | Intergenic | PROP1 | Downstream of gene | 3,920 |
| bFULVR_5 | Chr3: 5058744 | Intronic | AKR1C2 | Downstream of exon 1 | 1,348 |
| bFULVR_6 | Chr3: 167413258 | Intronic | PDCD10 | Downstream of exon 6 | 126 |
| bTAMR_1 | Chr22: 42268989 | Intronic | SREBF2 | Upstream of exon 5 | 813 |
| bTAM R_2 | Chr16: 90017249 | Intronic | DEF8 | Downstream of exon 2 | 1,203 |
| bTAM R_3 | ChrS: 60786357 | Intronic | ZSWIM6 | Upstream of exon 3 | 256 |
| bTAM R_4 | 90017249 | Intronic | DEF8 | Downstream of exon 2 | 1,203 |
| bTAM R_5 | 57650363 | Intronic | DHX40 | Upstream of exon 4 | 114 |
| bTAM R_6 | Chr19: 49751444 | Intergenic | TRPM4 | Downstream of gene | 36,346 |
| bTAM R_7 | ChrS: 60786357 | Intronic | ZSWIM6 | Upstream of exon 3 | 256 |
Genetic heterogeneity and clonality analysis of cell lines
The aligned files (bam) are prepared as described in “Exome sequencing” section. FACETS (Shen and Seshan, 2016) is used to estimate the absolute copy number, ploidy and tumor purity of parental and resistant cell lines from aligned files. The cancer cell fraction (CCF) of the mutations identified by MuTect2 (Van der Auwera et al., 2013) are then estimated based on the absolute copy number, ploidy, tumor purity and variant allele frequency (VAF) as previously described (Landau et al., 2013; Lohr et al., 2014; McGranahan et al., 2015). All mutations are classified as either clonal or subclonal according to the confidence interval of the CCF estimates. Mutations are defined as clonal if the 95% confidence interval overlapped 1 and subclonal otherwise, which is used in (McGranahan et al., 2015). Thus, the genetic heterogeneity/diversity of each cell line can be approximated by using the proportion of subclonal mutations to all mutations.
Transcriptomic heterogeneity estimation in clinical samples
To access the relationship between KDM5B expression level and transcriptomic heterogeneity in primary human breast tumors, we stratified patients into four groups with identical sample size based on the KDM5B expression level in ER+ and ER− tumors, respectively. We then calculated Shannon’s equitability using gene, exon and junction level counts, respectively, within each patient to estimate the transcriptomic heterogeneity at different levels. The Shannon’s equitability is a normalized version of Shannon’s index, in which “0” represents no heterogeneity and “1” represents the highest heterogeneity. The Shannon’s equitability was chosen here because the total number of population (genes) may vary for different samples. High Shannon’s equitability represents higher transcriptomic heterogeneity. The same analysis was applied for other histone demethylases and housekeeping genes. Patient survival was compared between low and high transcriptome heterogeneity cases (cut by median of transcriptome heterogeneity across patients) in all patients, ER+ patients and ER− patients in TCGA dataset.
Width versus height analysis of histone marks
Promoter H3K4me3 and H3K4me2 peaks were compared in a panel of breast cancer cell lines before and after treatment with KDM5-C70. All peaks were ranked by their height (read counts at the summit) from low to high and divided into 20 groups. For each of the height group (represented by the mean value in x-axis), the mean and the interquartile range of the peak width in bp are calculated and plotted in y-axis.
inDrop data analysis
Preprocessing of the inDrop data:
Single-cell RNA-seq data generated by inDrop version 3 were processed using the indrops pipeline developed by the Klein laboratory (https://github.com/indrops/indrops, v.0.3.1.1, commit 7979ee8a212fcec5ba726a8ccf8b7b8fa9db52cf, using Python 2.7, Rsem 1.3.0, Bowtie 1.1.1, Samtools 1.3.1, JDK 1.8.0_45) (Zilionis et al., 2017). Default parameters were applied (for Bowtie, m: 200, n: 1, l:15, e: 80; for Trimmomatic, LEADING: “28”, SLIDINGWINDOW: “4:20”, MINLEN: “16”; for UMI quantification, m: 10, u: 1, d: 600, splitambigs: False, min_non_polyA: 15; for low complexity filter, max_low_complexity_fraction: 0.50; for output: output_unaligned_reads_to_other_fastq: False, filter_alignments_to_softmasked_regions: False). Alignment was performed against cDNA from Ensembl GRCh38.85 release. Empty or unproductive droplets were filtered out based on the low abundance of reads per barcode, with a threshold set manually for each dataset after inspection of the barcode abundance distribution. Filtering and normalization of the inDrop data: To get a reliable single cell transcriptome dataset, we exclude the cells with less than 1,000 genes expressed (UMI > 0), and exclude the genes if they meet both of the criteria: expressed in less than 5% of all single cells and less than 50% of single cells of the same type. The filtered data is then normalized by using scran (Lun et al., 2016) with deconvolution within each cell type followed by rescaling across cell types by using parameter “clusters” in computeSumFactors function. This setting can largely avoid the influence of differentially expressed genes across cell types on the normalization accuracy (detail refers to scran paper). tSNE is performed on the normalized data to visualize the single cells in 2 dimensions by using the top 500 most variable genes. Cell cycle phases of all single cells are assigned by using cyclone function in scran package. Cellular transcriptomic heterogeneity of cell lines based on inDrop data: Transcriptomic heterogeneity is accessed by calculating the pair-wised Euclidean distance between single cells of the same type. All possible pair-wised distances are obtained, and the mean values are compared between cell types. The Wilcoxon rank sum test was applied and p values were shown. Identification of pre-existing resistant cells from single cell transcriptome: Cell identity signatures of MCF7, KDM5-C70 and C70R cells: For each of the three cell types, we compare the bulk gene expression of it (three replicates) with the other two cells together (three replicates each). We choose the top most 100 up-regulated and down-regulated genes as the (up and down) signatures of the cell type. Cell identity signatures of MCF7, fulvestrant-treated MCF7 and FULVR cells were obtained in the same way. Calculation of cell identity score: For each single cell, we calculated the average expression of each set of up signature genes minus the average expression of each set of down signature genes as the cell identity score. We carried out a bootstrap procedure to estimate the significance of the cell identity score. We randomly select 1,000 sets of up and down signatures with the same size of the original true signatures, generated the bootstrap distribution of the cell identity score, and calculated the bootstrap p value based on the distribution. We classified the single cells based on the bootstrap p valuecutoff of 5%. If a cell did not pass the test of any signature, it is annotated as unclassified. We observed that a few cells passed the test of two cell identity signatures, but no cell passed the three cell identity signatures. Hexagonal plots (Figure 4) were used to show the bootstrap classification of single cells in cell populations of MCF7, KDM5-C70 or fulvestrant-treated MCF7, and C70R and FULVR, in which cells showed clear identity (passed the 5% threshold) are positioned on the edge of the plot. Genes with differential percentage of expressing cells: To test genes with differential percentage of expressing cells between two cell populations, all single cells are ranked and grouped in 10 groups by their sequencing depth to avoid its influence. For each gene, the proportion of cells expressing it is calculated for each group, and a weighted t-test is performed to access the significance of the difference between two cell populations. FDR is then calculated to correct the multiple testing.
Gene set enrichment analysis (GSEA)
GSEA of H3K4me3 width increase in C70 was performed against the genes with increased percent of expressing cells in C70 for all genes or genes without expression change. H3K4me3 width changes were calculated as the average width changes across all six cell lines in Figure 2C. GSEA of H3K4me3 width increase in time course of C70 treatment was performed against the differentially expressed genes between corresponding treatment and parental cells in Figure S2D. GSEA of gene expression changes between endocrine-resistant cells and parental MCF7 cells was performed against top 500 up- or down-regulated genes between C70R and parental MCF7 cells in Figure 4C. GSEA of gene expression changes between KDM5 inhibitor resistant cells and parental MCF7 cells was performed against ER binding genes of different clusters in Figure S4H.
Simulation Methods
We construct a 2-type birth-death-mutation process model with passaging to estimate the initial proportion of cells with preexisting resistance (ρ) and mutation probability (µ). In the model, cells live for an exponentially-distributed amount of time before splitting into two daughter cells according to their birth and death rates which are estimated from 12-day cell-viability assays with and without treatment for each treatment (see Estimation of parameters). Upon splitting, a drug-sensitive cell may beget one sensitive and one resistant with probability equal to the mutation probability, or two sensitive cells with probability (1 − µ). Resistant cells remain resistant.
For each combination of µ and ρ, the process begins with 1.46 × 10⁶ initial uniquely barcoded ancestor cells with the proportion ρ as a starting resistant proportion and the rest ( 1 − ρ) are sensitive. We then simulate the process by beginning with a 14-day expansion phase simulated as a birth-death-mutation process for cells in DMSO to account for the initial barcode expansion. For each treatment, 5 × 10⁶ cells are sampled from the population into each of 8 subpopulations (4 treatment and 4 DMSO) using multinomial sampling with weights equal to the number of cells present for each barcode. Each subpopulation then goes through a series of expansions (birth-death-mutation process) and passaging (multinomial sampling with a size of 5 × 10⁶ and weights equal to the population sizes after expansion) according to the experimental passage schedules associated with each drug (see below). The final passage consists of a birth-death-mutation process expansion without a sampling step. 10 simulations are run for each treatment, pre-existing proportion, and mutation probability, and the results are fit to the experimental results in order to estimate the mutation rate and pre-existing proportion of resistant cells. The proportion of resistant barcodes present after the experiments and the ratio of barcodes shared among four replicates between the treatment and control group are determined for comparison to the data.
The multinomial distribution provides a fast approximation for the true multidimensional hypergeometric distribution which is acceptable since the initial number of barcodes post expansion is large and a small number (relative to the expanded population size) are sampled for plating.
Passage schedule for simulations
| Group | Passage Times (in days) |
|---|---|
| MCF7-pp15 | 6, 7, 8, 7, 6, 8, 7, 7, 6, 8, 6, 7, 7, 7, 8, 6, 8, 6, 8, 6 |
| C70 | 6, 10, 12, 10, 11, 10, 11, 10, 10, 9, 9, 11, 10, 10, 11, 12, 12, 11, 12, 13 |
| C49 | 6, 10, 12, 10, 11, 10, 11, 10, 10, 9, 9, 11, 10, 10, 11, 12, 12, 11, 12, 13 |
| MCF7 | 13, 15, 14, 14, 14, 10 |
| Fulvestrant | 28, 31, 24, 22, 14 |
| Tamoxifen | 21, 84, 69, 49, 17 |
Estimation of parameters for simulation
For each drug and control group, growth rates are estimated using 12-day cell viability assays to get the following rates: growth rate of resistant cells in DMSO (λr,DMSO), growth rate of resistant cells in treatment ( λr,TR), growth rate of sensitive cells in DMSO ( λs,DMSO,), and growth rate of sensitive cells in treatment ( λs,TR).
The growth rates of resistant populations, λr,⋅, are determined by fitting the number of viable cells to a log-transformed linear regression from experimentally generated data from resistant cell-lines. The estimated slope gives our estimated growth rate (see below). We use the resistant growth rate along with the number of cells in the control 12-day growth assay containing and unknown mixture of resistant and sensitive cells in order to determine the growth rate of sensitive cells. Given a particular value of ρ, we assume the control population grows approximately on according to the following equation:
where N(t) is the number of cells at time t. This equation assumes a low mutation probability since the experiments contain fewer cells and are ran over a shorter time period. We solve for the growth rates of the sensitive population, (λS,⋅) with and without each drug, and we use this value along with the resistant cell line growth rates to parameterize the model. We assume the death rate is the same throughout the experiments and determine the birth rate from b = λ + d. Changing the death rate had little effect on the results. These growth parameters are used to parameterize the simulations along with the growth rates estimated from data.
Growth rates of resistant cell lines
| Group | Growth rates in DMSO (days−1) | Growth rates in drug (days−1) |
|---|---|---|
| C70-resistant | 0.313 | 0.299 |
| C49 resistant | 0.321 | 0.305 |
| Fulvestrant-resistant | 0.221 | 0.173 |
| Tamoxifen-resistant | 0.199 | 0.142 |
Supplementary Material
KEY RESOURCES TABLE.
| REAGENT or RESOURCE | SOURCE | IDENTIFIER |
|---|---|---|
| Antibodies | ||
| Rabbit polyclonal anti-KDM5B | Sigma-Aldrich | Cat# HPA027179; RRID: AB_1851987 |
| Rabbit polyclonal anti-KDM5B | Novus | Cat# 22260002; RRID: AB_10004656 |
| Mouse monoclonal anti-H3K4me3 | Abcam | Cat# ab1012; RRID: AB_442796 |
| Rabbit polyclonal anti-H3K4me2 | Millipore | Cat# 07–030; RRID: AB_10099880 |
| Rabbit polyclonal anti-H3K4me1 | Abcam | Cat# ab8895; RRID: AB_306847 |
| Rabbit polyclonal anti-Histone H3 | Abcam | Cat# ab1791; RRID: AB_302613 |
| Mouse monoclonal anti-beta-Actin | Sigma-Aldrich | Cat# A2228; RRID: AB_476697 |
| Rabbit polyclonal anti-H3K27Ac | Abcam | Cat# ab4729; RRID: AB_2118291 |
| Mouse monoclonal anti-H3K27me3 | Abcam | Cat# ab6002; RRID: AB_305237 |
| Rabbit polyclonal anti-H3K27me2 | Abcam | Cat# ab24684; RRID: AB_448222 |
| Rabbit polyclonal anti-H3K36me2 | Abcam | Cat# ab9049; RRID: AB_1280939 |
| Rabbit polyclonal anti-H3K9Ac | Abcam | Cat# ab4441; RRID: AB_2118292 |
| Rabbit polyclonal anti-H3K79me2 | Abcam | Cat# ab3594; RRID: AB_303937 |
| Rabbit monoclonal anti-SUZ12 | Cell Signaling Technology | Cat# 3737; RRID: AB_2196850 |
| Rabbit monoclonal anti-ERα | Cell Signaling Technology | Cat# 8644; RRID: AB_2617128 |
| Mouse monoclonal anti-phospho-ERα Ser118 | Cell Signaling Technology | Cat# 2511; RRID: AB_331289 |
| Rabbit polyclonal anti-Cleaved Caspase-3 (Asp175) | Cell Signaling Technology | Cat# 9661; RRID: AB_2341188 |
| Rabbit polyclonal anti-Histone H3 (phospho S10) | Abcam | Cat# ab5176; RRID: AB_304763 |
| Rabbit polyclonal anti-H3K4me3 | Abcam | Cat# 8580; RRID: AB_306649 |
| Goat anti-rabbit IgG (H+L) conjugated to Alexa Fluor 488 |
Thermo Fisher Scientific |
Cat# A-11034; RRID: AB_2576217 |
| Antibodies used for CYTOF (metal) | ||
| Rabbit monoclonal anti-PR a/b (141Pr) | Cell Signaling Technology | Cat# 8757 |
| Mouse monoclonal anti-CD10 (142Nd) | BD Biosciences | Cat# 555373; RRID: AB_395775 |
| Rat monoclonal anti-CD44 (143Nd) | Biolegend | Cat# 103002; RRID: AB_312953 |
| Mouse monoclonal anti-cyclin D3 (144Nd) | Abcam | Cat# ab28283; RRID: AB_2070798 |
| Mouse monoclonal anti-Muc1 (145Nd) | Biolegend | Cat# 355602; RRID: AB_2561642 |
| Mouse monoclonal anti-Lamp2 (146Nd) | Biolegend | Cat# 354302; RRID: AB_11204245 |
| Mouse monoclonal anti-CDK4 (147Sm) | BD Biosciences | Cat# 559677; RRID: AB_397299 |
| Rabbit monoclonal anti-PTEN (148Nd) | Cell Signaling Technology | Cat# 9559; RRID: AB_390810 |
| Rabbit monoclonal anti-E-Cadherin (149Sm) | Cell Signaling Technology | Cat# 3195; RRID: AB_2291471 |
| Mouse monoclonal anti-Epcam (150Nd) | Biolegend | Cat# 324202; RRID: AB_756076 |
| Mouse monoclonal anti-Her2 (151Eu) | BD Biosciences | Cat# 554299; RRID: AB_395352 |
| Rabbit polyclonal anti-CK5 (152Sm) | Abcam | Cat# ab53121; RRID: AB_869889 |
| Mouse monoclonal anti-CD24 (153Eu) | Biolegend | Cat# 311102; RRID: AB_314851 |
| Mouse monoclonal anti-CDK1 (154Sm) | Biolegend | Cat# 626901; RRID: AB_2074779 |
| Rabbit monoclonal anti-CDK6 (155Gd) | Cell Signaling Technology | Cat# 13331 |
| Rabbit monoclonal anti-p63 (158Gd) | Abcam | Cat# ab124762; RRID: AB_10971840 |
| Rabbit monoclonal anti-TCF7 (159Tb) | Cell Signaling Technology | Cat# 2203; RRID: AB_2199302 |
| Rabbit monoclonal anti-AR (160Gd) | Cell Signaling Technology | Cat# 5153; RRID: AB_10691711 |
| Mouse monoclonal anti-Cyclin A (161Dy) | BD Biosciences | Cat# 554175; RRID: AB_395286 |
| Mouse monoclonal anti-Ki-67 (162Dy) | BD Biosciences | Cat# 550609; RRID: AB_393778 |
| Mouse monoclonal anti-SMA (163Dy) | Thermo Fisher Scientific | Cat# 14–9760-82; RRID: AB_2572996 |
| Mouse monoclonal anti-cPARP (164Dy) | BD Biosciences | Cat# 552596; RRID: AB_394437 |
| Rabbit monoclonal anti-Vimentin (165Ho) | Cell Signaling Technology | Cat# 5741; RRID: AB_10695459 |
| Rat monoclonal anti-GATA-3 (166Er) | eBioscience | Cat# 14–9966-80; RRID: AB_1210520 |
| Rabbit monoclonal anti-p21 (167Er) | Cell Signaling Technology | Cat# 2947; RRID: AB_823586 |
| Rabbit monoclonal anti-phospho-AKT Ser473 (168Er) |
Cell Signaling Technology | Cat# 4060; RRID: AB_2315049 |
| Rabbit monoclonal anti-phospho-STAT3 Tyr705 (169Tm) |
Cell Signaling Technology | Cat# 9145; RRID: AB_2491009 |
| Rabbit monoclonal anti-EGFR (170Er) | Cell Signaling Technology | Cat# 4267; RRID: AB_2246311 |
| Rabbit monoclonal anti-phospho-SMAD2 Ser465/467/Smad3 Ser423/425 (171Yb) |
Cell Signaling Technology | Cat# 8828; RRID: AB_2631089 |
| Rabbit monoclonal anti-ERα (172Yb) | Cell Signaling Technology | Cat# 13258; RRID: AB_2632959 |
| Rat monoclonal anti-CD49f (173Yb) | Biolegend | Cat# 313602; RRID: AB_345296 |
| Rabbit monoclonal anti-phospho-STAT5 Tyr694 (174Yb) |
Cell Signaling Technology | Cat# 4322; RRID: AB_10548756 |
| Rabbit monoclonal anti-phospho-S6 Ser235/236 (175Lu) |
Cell Signaling Technology | Cat# 4858; RRID: AB_916156 |
| Mouse monoclonal anti-CK8/18 (176Yb) | Cell Signaling Technology | Cat# 4546; RRID: AB_2134843 |
| Chemicals, Peptides, and Recombinant Proteins | ||
| C49 (NCGC00371442) | This paper; Johansson et al., 2016 | N/A |
| C70 (NCGC00371443) | This paper; Johansson et al., 2016 | N/A |
| C48 | Genentech | N/A |
| Fulvestrant | Sigma-Aldrich | I4409 |
| 4-hydroxytamoxifen | Sigma-Aldrich | T176 |
| β-Estradiol | Sigma-Aldrich | E2758 |
| GSK126 | Selleckchem | Cat# S7061 |
| Critical Commercial Assays | ||
| CellTiter-Glo Luminescent Cell Viability Assay | Promega | G7573 |
| ThruPLEX DNA-seq 48S Kit | RUBICON | R400427 |
| Deposited Data | ||
| All raw genomic data | GEO | GSE104988 |
| Experimental Models: Cell Lines | ||
| MCF7 cells | Marc Lippman (University of Michigan) | N/A |
| T-47D cells | ATCC | HTB-133 |
| ZR-75–1 cells | ATCC | CRL-1500 |
| BT-474 cells | ATCC | HTB-20 |
| SUM185 cells | Steve Ethier (University of Michigan) | N/A |
| SUM159 cells | Steve Ethier (University of Michigan) | N/A |
| SUM 149 cells | Steve Ethier (University of Michigan) | N/A |
| MDA-MB-231 cells | ATCC | HTB-26 |
| BT549 cells | ATCC | HTB-122 |
| HCC1937 cells | ATCC | CRL-2336 |
| HCC2157 cells | ATCC | CRL-2340 |
| KDM5-C49R | This paper | N/A |
| KDM5-C70R | This paper | N/A |
| FULVR | This paper | N/A |
| TAMR | This paper | N/A |
| MCF7-ESR1Y537S | Myles Brown | N/A |
| MCF7 sgcontrol cells | This paper | N/A |
| MCF7 KDM5B-KO#1 cells | This paper | N/A |
| MCF7 KDM5B-KO#2 cells | This paper | N/A |
| MCF7 KDM5A-KO#1 cells | This paper | N/A |
| MCF7 KDM5A-KO#2 cells | This paper | N/A |
| Recombinant DNA | ||
| Edit-R Lentiviral Blast-Cas9 | Dharmacon | CAS10138 |
| Edit-R Lentiviral sgRNA Non-targeting Control | Dharmacon | GSG11812 |
| Edit-R Human KDM5B Lentiviral sgRNA#1 | Dharmacon | GSGH11838–246552182 |
| Edit-R Human KDM5B Lentiviral sgRNA#2 | Dharmacon | GSGH11838–246552189 |
| Edit-R Human KDM5A Lentiviral sgRNA#1 | Dharmacon | GSGH11838–246592353 |
| Edit-R Human KDM5A Lentiviral sgRNA#2 | Dharmacon | GSGH11838–246592357 |
| siRNA oligos | ||
| ON-TARGETplus Non-targeting siRNA#1 | Dharmacon | D-001810–03-05 |
| ON-TARGETplus Non-targeting siRNA#2 | Dharmacon | D-001810–04-05 |
| ON-TARGETplus Human ESR1 siRNA#1 | Dharmacon | J-003401–11 |
| ON-TARGETplus Human ESR1 siRNA#2 | Dharmacon | J-003401–12 |
| ON-TARGETplus Human ESR1 siRNA#3 | Dharmacon | J-003401–13 |
SIGNIFICANCE.
Cellular heterogeneity for phenotypic features is a key mechanism underlying disease progression and therapeutic resistance, yet its regulation is poorly understood at the molecular level. Our findings demonstrate that endocrine resistance is associated with higher transcriptomic heterogeneity and provide proof of principle for how decreasing cellular transcriptomic heterogeneity by modulating the activity of epigenetic enzymes such as KDM5 family members can lead to improved responses to treatment. We also present conclusive evidence that acquired resistance to anti-estrogens and KDM5 inhibitors is mechanistically distinct; although both involve gain of estrogen-independent growth. These observations suggest that epigenetic agents may improve the efficacy of cancer therapies when used in combination, even when they have limited activity as single agents.
HIGHLIGHTS.
KDM5 activity modulates response and resistance to endocrine therapies
Endocrine resistance is due to selection for pre-existing distinct cell populations
Acquired KDM5 inhibitor resistance is epigenetic, including gain of ER signaling
Transcriptomic but not genetic heterogeneity is associated with higher KDM5B
ACKNOWLEDGMENTS
We thank members of our laboratories for their critical reading of this manuscript and useful discussions. We thank members of Allon Klein’s laboratory and the Single Cell Core at Harvard Medical School, particularly Allon Klein, Rapolas Zilionis, Sarah Boswell, and Alex Ratner, for providing instructions and guidance for setting up our single-cell RNA sequencing system. We thank Bob Yauch (Genentech, San Francisco) for providing us the KDM5 inhibitor 48 and the Lurie Family Imaging Center for performing the in vivo xenograft experiments. This research was supported by the National Cancer Institute PSOC U54 CA193461 (F.M. and K.P.), R35 CA197623 (K.P.), P01 CA080111 (K.P., M.B., P.S.), R01 CA202634 (P.S.), the Ludwig Center at Harvard (K.P., F.M., M.B.), and the Division of Preclinical Innovation of the National Center for Advancing Translational Sciences (NCATS), NIH (S.C.K., A.S., D.J.M., G.R., A.J., M.L.-N.).
P.S., M.B., N.W., and K.P. received research support and were consultants to Novartis Institutes for BioMedical Research during the execution of this study. K.P. and M.B. serves on the scientific advisory board of Mitra Biotech and Kronos Bio, respectively. R.S. receives research support from Pfizer. N.W. was a shareholder of Foundation Medicine and a consultant to Eli Lilly during the execution of this study, and he currently receives research support from Puma Biotechnologies. L.D. is current employee of Cugene Inc.
Footnotes
DATA AND SOFTWARE AVAILABILITY
All raw genomic data was deposited to GEO under accession number: GSE104988.
Hinohara et al. demonstrate that histone demethylases KDM5A and KDM5B are key regulators of phenotypic heterogeneity in estrogen receptor (ER)-positive breast cancer. Inhibition of KDM5 activity increases sensitivity to endocrine therapy by modulating ER signaling.
COMPETING FINANCIAL INTERESTS
Publisher's Disclaimer: This is a PDF file of an unedited manuscript that has been accepted for publication. As a service to our customers we are providing this early version of the manuscript. The manuscript will undergo copyediting, typesetting, and review of the resulting proof before it is published in its final citable form. Please note that during the production process errors may be discovered which could affect the content, and all legal disclaimers that apply to the journal pertain.
REFERENCES
- Anders S, Pyl PT, and Huber W (2015). HTSeq--a Python framework to work with high-throughput sequencing data. Bioinformatics 31, 166–169. [DOI] [PMC free article] [PubMed] [Google Scholar]
- Ben-David U, Siranosian B, Ha G, Tang H, Oren Y, Hinohara K, Strathdee CA, Dempster J, Lyons NJ, Burns R, et al. (2018). Genetic and transcriptional evolution alters cancer cell line drug response. Nature 560, 325–330. [DOI] [PMC free article] [PubMed] [Google Scholar]
- Benayoun BA, Pollina EA, Ucar D, Mahmoudi S, Karra K, Wong ED, Devarajan K, Daugherty AC, Kundaje AB, Mancini E, et al. (2014). H3K4me3 breadth is linked to cell identity and transcriptional consistency. Cell 158, 673–688. [DOI] [PMC free article] [PubMed] [Google Scholar]
- Bendall SC, Simonds EF, Qiu P, Amir el AD, Krutzik PO, Finck R, Bruggner RV, Melamed R, Trejo A, Ornatsky OI, et al. (2011). Single-cell mass cytometry of differential immune and drug responses across a human hematopoietic continuum. Science 332, 687–696. [DOI] [PMC free article] [PubMed] [Google Scholar]
- Bhang HE, Ruddy DA, Krishnamurthy Radhakrishna V, Caushi JX, Zhao R, Hims MM, Singh AP, Kao I, Rakiec D, Shaw P, et al. (2015). Studying clonal dynamics in response to cancer therapy using high-complexity barcoding. Nat Med 21, 440–448. [DOI] [PubMed] [Google Scholar]
- Booth LN, and Brunet A (2016). The Aging Epigenome. Mol Cell 62, 728–744. [DOI] [PMC free article] [PubMed] [Google Scholar]
- Brastianos PK, Horowitz PM, Santagata S, Jones RT, McKenna A, Getz G, Ligon KL, Palescandolo E, Van Hummelen P, Ducar MD, et al. (2013). Genomic sequencing of meningiomas identifies oncogenic SMO and AKT1 mutations. Nat Genet 45, 285–289. [DOI] [PMC free article] [PubMed] [Google Scholar]
- Brock A, Chang H, and Huang S (2009). Non-genetic heterogeneity--a mutation-independent driving force for the somatic evolution of tumours. Nature reviews Genetics 10, 336–342. [DOI] [PubMed] [Google Scholar]
- Chanrion M, Negre V, Fontaine H, Salvetat N, Bibeau F, Mac Grogan G, Mauriac L, Katsaros D, Molina F, Theillet C, and Darbon JM (2008). A gene expression signature that can predict the recurrence of tamoxifen-treated primary breast cancer. Clin Cancer Res 14, 1744–1752. [DOI] [PMC free article] [PubMed] [Google Scholar]
- Chisholm RH, Lorenzi T, and Clairambault J (2016). Cell population heterogeneity and evolution towards drug resistance in cancer: Biological and mathematical assessment, theoretical treatment optimisation. Biochim Biophys Acta 1860, 2627–2645. [DOI] [PubMed] [Google Scholar]
- Cibulskis K, Lawrence MS, Carter SL, Sivachenko A, Jaffe D, Sougnez C, Gabriel S, Meyerson M, Lander ES, and Getz G (2013). Sensitive detection of somatic point mutations in impure and heterogeneous cancer samples. Nat Biotechnol 31, 213–219. [DOI] [PMC free article] [PubMed] [Google Scholar]
- Cohen O, Kim D, Oh C, Waks A, Oliver N, Helvie K, Marini L, Rotem A, Lloyd M, Stover D, et al. (2017). Whole exome and transcriptome sequencing of resistant ER+ metastatic breast cancer. Cancer Res 77(4 Suppl), Abstract nr S1–01. [Google Scholar]
- Creech AL, Taylor JE, Maier VK, Wu X, Feeney CM, Udeshi ND, Peach SE, Boehm JS, Lee JT, Carr SA, and Jaffe JD (2015). Building the Connectivity Map of epigenetics: chromatin profiling by quantitative targeted mass spectrometry. Methods 72, 57–64. [DOI] [PMC free article] [PubMed] [Google Scholar]
- DePristo MA, Banks E, Poplin R, Garimella KV, Maguire JR, Hartl C, Philippakis AA, del Angel G, Rivas MA, Hanna M, et al. (2011). A framework for variation discovery and genotyping using next-generation DNA sequencing data. Nat Genet 43, 491–498. [DOI] [PMC free article] [PubMed] [Google Scholar]
- Feinberg AP, Koldobskiy MA, and Gondor A (2016). Epigenetic modulators, modifiers and mediators in cancer aetiology and progression. Nat Rev Genet 17, 284–299. [DOI] [PMC free article] [PubMed] [Google Scholar]
- Flavahan WA, Gaskell E, and Bernstein BE (2017). Epigenetic plasticity and the hallmarks of cancer. Science 357. [DOI] [PMC free article] [PubMed] [Google Scholar]
- Gerlinger M, McGranahan N, Dewhurst SM, Burrell RA, Tomlinson I, and Swanton C (2014). Cancer: evolution within a lifetime. Annu Rev Genet 48, 215–236. [DOI] [PubMed] [Google Scholar]
- Hata AN, Niederst MJ, Archibald HL, Gomez-Caraballo M, Siddiqui FM, Mulvey HE, Maruvka YE, Ji F, Bhang HE, Krishnamurthy Radhakrishna V, et al. (2016). Tumor cells can follow distinct evolutionary paths to become resistant to epidermal growth factor receptor inhibition. Nat Med 22, 262–269. [DOI] [PMC free article] [PubMed] [Google Scholar]
- Horton JR, Engstrom A, Zoeller EL, Liu X, Shanks JR, Zhang X, Johns MA, Vertino PM, Fu H, and Cheng X (2016). Characterization of a Linked Jumonji Domain of the KDM5/JARID1 Family of Histone H3 Lysine 4 Demethylases. J Biol Chem 291, 2631–2646. [DOI] [PMC free article] [PubMed] [Google Scholar]
- Huang S (2013). Genetic and non-genetic instability in tumor progression: link between the fitness landscape and the epigenetic landscape of cancer cells. Cancer Metastasis Rev 32, 423–448. [DOI] [PubMed] [Google Scholar]
- Jeselsohn R, Buchwalter G, De Angelis C, Brown M, and Schiff R (2015). ESR1 mutations-a mechanism for acquired endocrine resistance in breast cancer. Nat Rev Clin Oncol 12, 573–583. [DOI] [PMC free article] [PubMed] [Google Scholar]
- Jeselsohn R, De Angelis C, Brown M, and Schiff R (2017). The Evolving Role of the Estrogen Receptor Mutations in Endocrine Therapy-Resistant Breast Cancer. Curr Oncol Rep 19, 35. [DOI] [PubMed] [Google Scholar]
- Jiang L, Chen H, Pinello L, and Yuan GC (2016). GiniClust: detecting rare cell types from single-cell gene expression data with Gini index. Genome Biol 17, 144. [DOI] [PMC free article] [PubMed] [Google Scholar]
- Johansson C, Velupillai S, Tumber A, Szykowska A, Hookway ES, Nowak RP, StrainDamerell C, Gileadi C, Philpott M, Burgess-Brown N, et al. (2016). Structural analysis of human KDM5B guides histone demethylase inhibitor development. Nat Chem Biol 12, 539–545. [DOI] [PubMed] [Google Scholar]
- Kim D, Pertea G, Trapnell C, Pimentel H, Kelley R, and Salzberg SL (2013). TopHat2: accurate alignment of transcriptomes in the presence of insertions, deletions and gene fusions. Genome Biol 14, R36. [DOI] [PMC free article] [PubMed] [Google Scholar]
- Landau DA, Carter SL, Stojanov P, McKenna A, Stevenson K, Lawrence MS, Sougnez C, Stewart C, Sivachenko A, Wang L, et al. (2013). Evolution and impact of subclonal mutations in chronic lymphocytic leukemia. Cell 152, 714–726. [DOI] [PMC free article] [PubMed] [Google Scholar]
- Laugesen A, and Helin K (2014). Chromatin repressive complexes in stem cells, development, and cancer. Cell Stem Cell 14, 735–751. [DOI] [PubMed] [Google Scholar]
- Li H, and Durbin R (2009). Fast and accurate short read alignment with Burrows-Wheeler transform. Bioinformatics 25, 1754–1760. [DOI] [PMC free article] [PubMed] [Google Scholar]
- Li H, Handsaker B, Wysoker A, Fennell T, Ruan J, Homer N, Marth G, Abecasis G, Durbin R, and Genome Project Data Processing, S. (2009). The Sequence Alignment/Map format and SAMtools. Bioinformatics 25, 2078–2079. [DOI] [PMC free article] [PubMed] [Google Scholar]
- Li N, Li Y, Lv J, Zheng X, Wen H, Shen H, Zhu G, Chen TY, Dhar SS, Kan PY, et al. (2016). ZMYND8 Reads the Dual Histone Mark H3K4me1-H3K14ac to Antagonize the Expression of Metastasis-Linked Genes. Mol Cell 63, 470–484. [DOI] [PMC free article] [PubMed] [Google Scholar]
- Liang J, Zhang B, Labadie S, Ortwine DF, Vinogradova M, Kiefer JR, Gehling VS, Harmange JC, Cummings R, Lai T, et al. (2016). Lead optimization of a pyrazolo[1,5-a]pyrimidin7(4H)-one scaffold to identify potent, selective and orally bioavailable KDM5 inhibitors suitable for in vivo biological studies. Bioorg Med Chem Lett 26, 4036–4041. [DOI] [PubMed] [Google Scholar]
- Lohr JG, Stojanov P, Carter SL, Cruz-Gordillo P, Lawrence MS, Auclair D, Sougnez C, Knoechel B, Gould J, Saksena G, et al. (2014). Widespread genetic heterogeneity in multiple myeloma: implications for targeted therapy. Cancer Cell 25, 91–101. [DOI] [PMC free article] [PubMed] [Google Scholar]
- Love MI, Huber W, and Anders S (2014). Moderated estimation of fold change and dispersion for RNA-seq data with DESeq2. Genome Biol 15, 550. [DOI] [PMC free article] [PubMed] [Google Scholar]
- Lun AT, Bach K, and Marioni JC (2016). Pooling across cells to normalize single-cell RNA sequencing data with many zero counts. Genome Biol 17, 75. [DOI] [PMC free article] [PubMed] [Google Scholar]
- Macaulay IC, Ponting CP, and Voet T (2017). Single-Cell Multiomics: Multiple Measurements from Single Cells. Trends Genet 33, 155–168. [DOI] [PMC free article] [PubMed] [Google Scholar]
- Martinez-Jimenez CP, Eling N, Chen HC, Vallejos CA, Kolodziejczyk AA, Connor F, Stojic L, Rayner TF, Stubbington MJT, Teichmann SA, et al. (2017). Aging increases cell-to-cell transcriptional variability upon immune stimulation. Science 355, 1433–1436. [DOI] [PMC free article] [PubMed] [Google Scholar]
- Marusyk A, Almendro V, and Polyak K (2012). Intra-tumour heterogeneity: a looking glass for cancer? Nat Rev Cancer 12, 323–334. [DOI] [PubMed] [Google Scholar]
- Marusyk A, and Polyak K (2010). Tumor heterogeneity: causes and consequences. Biochim Biophys Acta 1805, 105–117. [DOI] [PMC free article] [PubMed] [Google Scholar]
- McCabe MT, Ott HM, Ganji G, Korenchuk S, Thompson C, Van Aller GS, Liu Y, Graves AP, Della Pietra A 3rd, Diaz E, et al. (2012). EZH2 inhibition as a therapeutic strategy for lymphoma with EZH2-activating mutations. Nature 492, 108–112. [DOI] [PubMed] [Google Scholar]
- McDonald TO, and Michor F (2017). SIApopr: A computational method to simulate evolutionary branching trees for analysis of tumor clonal evolution. Bioinformatics [DOI] [PMC free article] [PubMed]
- McGranahan N, Favero F, de Bruin EC, Birkbak NJ, Szallasi Z, and Swanton C (2015). Clonal status of actionable driver events and the timing of mutational processes in cancer evolution. Sci Transl Med 7, 283ra254. [DOI] [PMC free article] [PubMed] [Google Scholar]
- McGranahan N, and Swanton C (2017). Clonal Heterogeneity and Tumor Evolution: Past, Present, and the Future. Cell 168, 613–628. [DOI] [PubMed] [Google Scholar]
- McKenna A, Hanna M, Banks E, Sivachenko A, Cibulskis K, Kernytsky A, Garimella K, Altshuler D, Gabriel S, Daly M, and DePristo MA (2010). The Genome Analysis Toolkit: a MapReduce framework for analyzing next-generation DNA sequencing data. Genome Res 20, 12971303. [DOI] [PMC free article] [PubMed] [Google Scholar]
- McLaren W, Pritchard B, Rios D, Chen Y, Flicek P, and Cunningham F (2010). Deriving the consequences of genomic variants with the Ensembl API and SNP Effect Predictor. Bioinformatics 26, 2069–2070. [DOI] [PMC free article] [PubMed] [Google Scholar]
- Musgrove EA, and Sutherland RL (2009). Biological determinants of endocrine resistance in breast cancer. Nat Rev Cancer 9, 631–643. [DOI] [PubMed] [Google Scholar]
- Olshen AB, Venkatraman ES, Lucito R, and Wigler M (2004). Circular binary segmentation for the analysis of array-based DNA copy number data. Biostatistics 5, 557–572. [DOI] [PubMed] [Google Scholar]
- Osborne CK, and Schiff R (2011). Mechanisms of endocrine resistance in breast cancer. Annu Rev Med 62, 233–247. [DOI] [PMC free article] [PubMed] [Google Scholar]
- Roesch A, Fukunaga-Kalabis M, Schmidt EC, Zabierowski SE, Brafford PA, Vultur A, Basu D, Gimotty P, Vogt T, and Herlyn M (2010). A temporarily distinct subpopulation of slowcycling melanoma cells is required for continuous tumor growth. Cell 141, 583–594. [DOI] [PMC free article] [PubMed] [Google Scholar]
- Roesch A, Vultur A, Bogeski I, Wang H, Zimmermann KM, Speicher D, Korbel C, Laschke MW, Gimotty PA, Philipp SE, et al. (2013). Overcoming intrinsic multidrug resistance in melanoma by blocking the mitochondrial respiratory chain of slow-cycling JARID1B(high) cells. Cancer Cell 23, 811–825. [DOI] [PMC free article] [PubMed] [Google Scholar]
- Schuettengruber B, Bourbon HM, Di Croce L, and Cavalli G (2017). Genome Regulation by Polycomb and Trithorax: 70 Years and Counting. Cell 171, 34–57. [DOI] [PubMed] [Google Scholar]
- Sharma SV, Lee DY, Li B, Quinlan MP, Takahashi F, Maheswaran S, McDermott U, Azizian N, Zou L, Fischbach MA, et al. (2010). A chromatin-mediated reversible drug-tolerant state in cancer cell subpopulations. Cell 141, 69–80. [DOI] [PMC free article] [PubMed] [Google Scholar]
- Shen R, and Seshan VE (2016). FACETS: allele-specific copy number and clonal heterogeneity analysis tool for high-throughput DNA sequencing. Nucleic Acids Res 44, e131. [DOI] [PMC free article] [PubMed] [Google Scholar]
- Shibue T, and Weinberg RA (2017). EMT, CSCs, and drug resistance: the mechanistic link and clinical implications. Nat Rev Clin Oncol 14, 611–629. [DOI] [PMC free article] [PubMed] [Google Scholar]
- TCGA (2012). Comprehensive molecular portraits of human breast tumours. Nature 490, 61–70. [DOI] [PMC free article] [PubMed] [Google Scholar]
- Tirosh I, Izar B, Prakadan SM, Wadsworth MH 2nd, Treacy D, Trombetta JJ, Rotem A, Rodman C, Lian C, Murphy G, et al. (2016). Dissecting the multicellular ecosystem of metastatic melanoma by single-cell RNA-seq. Science 352, 189–196. [DOI] [PMC free article] [PubMed] [Google Scholar]
- Tumber A, Nuzzi A, Hookway ES, Hatch SB, Velupillai S, Johansson C, Kawamura A, Savitsky P, Yapp C, Szykowska A, et al. (2017). Potent and Selective KDM5 Inhibitor Stops Cellular Demethylation of H3K4me3 at Transcription Start Sites and Proliferation of MM1S Myeloma Cells. Cell Chem Biol 24, 371–380. [DOI] [PMC free article] [PubMed] [Google Scholar]
- Van der Auwera GA, Carneiro MO, Hartl C, Poplin R, Del Angel G, Levy-Moonshine A, Jordan T, Shakir K, Roazen D, Thibault J, et al. (2013). From FastQ data to high confidence variant calls: the Genome Analysis Toolkit best practices pipeline. Curr Protoc Bioinformatics 43, 11 10 11–33. [DOI] [PMC free article] [PubMed] [Google Scholar]
- Vaske CJ, Benz SC, Sanborn JZ, Earl D, Szeto C, Zhu J, Haussler D, and Stuart JM (2010). Inference of patient-specific pathway activities from multi-dimensional cancer genomics data using PARADIGM. Bioinformatics 26, i237–245. [DOI] [PMC free article] [PubMed] [Google Scholar]
- Vinogradova M, Gehling VS, Gustafson A, Arora S, Tindell CA, Wilson C, Williamson KE, Guler GD, Gangurde P, Manieri W, et al. (2016). An inhibitor of KDM5 demethylases reduces survival of drug-tolerant cancer cells. Nat Chem Biol 12, 531–538. [DOI] [PubMed] [Google Scholar]
- Wu ZJ, Meyer CA, Choudhury S, Shipitsin M, Maruyama R, Bessarabova M, Nikolskaya T, Sukumar S, Schwartzman A, Liu JS, et al. (2010). Gene expression profiling of human breast tissue samples using SAGE-Seq. Genome Res 20, 1730–1739. [DOI] [PMC free article] [PubMed] [Google Scholar]
- Yamamoto S, Wu Z, Russnes HG, Takagi S, Peluffo G, Vaske C, Zhao X, Moen Vollan HK, Maruyama R, Ekram MB, et al. (2014). JARID1B is a luminal lineage-driving oncogene in breast cancer. Cancer Cell 25, 762–777. [DOI] [PMC free article] [PubMed] [Google Scholar]
- Zhang Y, Liu T, Meyer CA, Eeckhoute J, Johnson DS, Bernstein BE, Nusbaum C, Myers RM, Brown M, Li W, and Liu XS (2008). Model-based analysis of ChIP-Seq (MACS). Genome Biol 9, R137. [DOI] [PMC free article] [PubMed] [Google Scholar]
- Zilionis R, Nainys J, Veres A, Savova V, Zemmour D, Klein AM, and Mazutis L (2017). Single-cell barcoding and sequencing using droplet microfluidics. Nat Protoc 12, 44–73. [DOI] [PubMed] [Google Scholar]
Associated Data
This section collects any data citations, data availability statements, or supplementary materials included in this article.