

Abstract
Background
Medical marijuana (MMJ) laws and policies have evolved rapidly over the past decade in the United States. Public health concerns over the impact of these laws might be influenced by the degree of MMJ participation, but little is known about changes to this population over time. Trends in registered MMJ participation are described for 13 states in the US and District of Columbia (DC) since 2001.
Methods
Numbers of MMJ participants were obtained from state MMJ patient registries. A subset of states reported differences by sex and age. Prevalence of MMJ participation per 1,000 was calculated. Data from California and Washington were not available.
Results
MMJ participation was relatively low and flat from 2001–2008 (i.e., less than 5 per 1,000 adults). Participation rose sharply in Colorado, Montana, and Michigan in 2009–2010, but not for other states. High rates can currently be found in Colorado, Oregon, and Montana (i.e., 15–30 per 1,000) with the national average around 7.6 per 1,000 adults. Two-thirds of participants are male, but sex differences may be decreasing over time. Less than 1% of MMJ registrants are under 18, but this segment is growing in Colorado and Oregon. Participants tend to be older (50s), but Colorado and Arizona have larger proportions of young adult (21–30) registrants.
Conclusions
Participation in MMJ programs varies considerably by state and within states over time. Trends are discussed within the context of federal and state policies, and the availability of marijuana via dispensaries.
Keywords: marijuana, medical, trends, legalization, adolescents, sex differences
1. INTRODUCTION
Since 1996, 23 states in the United States (US) and the District of Columbia (DC) afford a legal defense for the medicinal use of marijuana (i.e., cannabis) for specific qualifying medical conditions (Hasin et al., 2015). Passage of these medical marijuana (MMJ) provisions coincide with heightened public and scientific debate over the therapeutic potential of marijuana and its chemical constituents (Borgelt et al., 2013; Di Marzo et al., 2004; Rubens, 2014). However, the pace of evidence-based research into the safety and effectiveness of smoked marijuana or its cannabinoid derivative products for the treatment of certain medical conditions has lagged behind the pace at which these MMJ provisions have been enacted (Hill, 2015; Whiting et al., 2015). Further, passage of MMJ provisions have fueled concerns over the impact to the non-medical (i.e., ‘recreational’) use of marijuana and its accompanying health risks, especially among adolescents (Anderson et al., 2014; Cerdá et al., 2012; Lynne-Landsman et al., 2013; Morris et al., 2014; Schuermeyer et al., 2014). Public health and policy issues surrounding access to MMJ could be enhanced with an understanding of trends in MMJ participation over time, but this information is currently lacking.
The size of the MMJ population has been estimated previously based upon data from state MMJ registry programs where qualifying patients are required to register in order to be issued ID cards that exempts them from arrest or prosecution for marijuana possession, and registration may be required in order to purchase marijuana in states that allow dispensaries (Marijuana Policy Project, 2013). For example, Bowles (2012) briefly described the proportion of adult state residents registered in MMJ programs in 11 US states around June, 2011, showing a relatively high level of participation in Montana (MT) and Colorado (CO; 4.1% and 3.3% of the adult population, respectively), but lower levels in Oregon (OR; 1.3%), and less than 1% for each of the remaining eight states. Sabet and Grossman (2014) also reported the number of state MMJ registrants as recently as 2012. However, their numbers suggest substantial increases in MMJ registration in some states (e.g., Arizona had gained over 10,000 new MMJ participants), while others had declined (e.g., MT appeared to have lost 5,000). Previous commentators have noted a sharp increase in the number of MMJ registrants over a short period of time in CO from 2009 (N<5000) to 2010 (N> 100,000), but it is unclear whether these trends also apply to other MMJ states with mandatory registration programs (Ghosh et al., 2015; Salomonsen-Sautel et al., 2014; Schuermeyer et al., 2014).
The unique contribution of this report is to describe and compare trends in registered MMJ participation over time across 13 US states and DC with mandatory MMJ registration programs. For some states, registry data has been available since 2001, but the majority of states possess data covering the period of 2009–2015. This report has been able to include data from MMJ registries not previously covered by prior publications (e.g., DC, Hawaii, New Jersey, Massachusetts, Minnesota). Three states with no or only voluntary MMJ registries are not included in the examination of trends (California, Washington, and Maine), while no data is presently available for three states that have yet to begin accepting MMJ participants into their registries (i.e., Maryland, New Hampshire, and New York). Trends in MMJ participation by sex and age are examined in a subset of states that collect and report this data.
2. METHODS
Data for this report come from publically available statistics provided by local governmental agencies responsible for administering their MMJ registry program. Statistics were collected mainly from published reports on governmental websites, and in a few instances from direct email request. Of the 23 US states and DC that as of 2015 that have passed some form of MMJ provision, recent registry data from 16 states and DC are represented: Alaska (AK), Arizona (AZ), Colorado (CO), Connecticut (CT), Delaware (DE), Hawaii (HI), Massachusetts (MA), Michigan (MI), Minnesota (MN), Montana (MT), Nevada (NV), New Jersey (NJ), New Mexico (NM), Oregon (OR), Rhode Island (RI), and Vermont (VT). Three of these states (MA, MN, and DE) had available data at only one time point, and therefore only 13 states and DC were examined for trends over time. Three additional states (NH, MD, and NY) had only recently passed MMJ laws with registry provisions (2013–2014) and have not yet begun to register participants. One state’s MMJ registry program (IL) was in its pilot phase, and had only reported approximate numbers. Patient registries in California and Maine have been characterized as voluntary or optional, and therefore the number of registered MMJ participants reported here are for completeness and comparison purposes. No numbers are available for Washington state, which has no registry as of 2015 (Marijuana Policy Project, 2013).
The main outcome of interest was the prevalence of adult MMJ registration in each locale calculated as the number of MMJ participants per every 1000 adult residents. The number of adult residents (age 18 and older) in each locale was based on year-specific US Census estimates (US Census Bureau, 2013). In order to accurately reflect the prevalence of MMJ participation in the adult population, it was assumed that the total number of MMJ participants reported largely reflected the number of adult MMJ participants, even if the number contained a small proportion of minor participants under age 18 years. This was done because minors make up a small fraction of the total number of MMJ participants (<1%), but are large proportion of the total population (Bowles, 2012). Age-specific prevalence of MMJ participation (per 1,000 residents) was similarly calculated by dividing the number of MMJ participants in each age group by the size of the population within that age group. Age categories were determined by the reporting agency, and therefore, cut-points between states could differ. The number of minor MMJ participants were so few (i.e., no more than 500 in any locale), that estimates for this age group were rescaled as the number of minor participants per 100,000 (100K) minor residents. Finally, differences by sex were calculated as the proportion of MMJ participants that were male.
Registered MMJ participation per 1000 adult residents was plotted graphically over time for the 13 states and DC. Variability in the US Census estimates of the state population compared to numbers based on actual counts is low (<1%), and therefore, its contribution to variation in the prevalence of registered MMJ participation was not reported (Cohn, 2011). The proportion of male MMJ participants in five states and DC are presented for each year in June (or closest available month) from 2012 to 2015. Trends for minor MMJ participation are plotted over time for eight states from 2009 to 2015, including two states (AK and VT) where only one time point was available. The distribution of MMJ participation by age is presented for eight states as of their most recent available time point (2014 or 2015), and in terms of both the proportion (%) and age-specific prevalence of MMJ participation per 1000 residents.
3. RESULTS
3.1. Availability of Medical Marijuana Registry Data and Current Levels of Participation
Details on 23 US states and DC that have MMJ provisions, including date of passage, existence of a MMJ registry, and the availability of registry statistics for this study are shown in Table 1. Ten states and DC passed MMJ provisions within the past five years (2010–2015), eight states passed provisions during the 2000s, and the remaining five states passed provisions prior to 2000. All but three states have mandatory MMJ registration requirements. Two states (CO and HI) had registry statistics dating back to 2001, while a few states (e.g., AK, NV, and OR) lacked information during the early years of MMJ enactment. Some states had month-by-month statistics (e.g., AZ, CO, MT, and NV), but others had only annual or biennial data (e.g., MI and RI).
Table 1.
Details on 23 US states and District of Columbia allowing medical marijuana (MMJ), availability of registry data, and number of registered MMJ participants.
| State | Date MMJ Law Passed |
MMJ Registry |
Registry Data Availabilitya |
Time Pointsb |
# of MMJ Participants |
As of Date |
Census Populationc |
MMJ Participants Per 1000 |
|---|---|---|---|---|---|---|---|---|
| Alaska | 11/3/1998 | Mandatory | 2008–2015 | 7 | 1,526 | 6/25/15 | 522,997 | 2.9 |
| Arizona | 11/2/2010 | Mandatory | 2011–2015 | 27 | 70,190 | 4/30/15 | 4,989,558 | 14.1 |
| California | 11/5/1996 | Voluntary | 2005–2015 | 11 | 5,786 | 6/8/15 | 29,496,381 | NA |
| Colorado | 11/7/2000 | Mandatory | 2001–2015 | 100+ | 114,713 | 4/30/15 | 3,993,648 | 28.7 |
| Connecticut | 3/31/2012 | Mandatory | 2013–2014 | 3 | 4,097 | 6/5/15 | 2,813,652 | 1.5 |
| Delaware | 5/13/2011 | Mandatory | 2012 | 1 | 60 | 2012 | 727,483 | <0.1 |
| District of Columbia | 5/21/2010 | Mandatory | 2014–2015 | 31 | 3,516 | 6/1/15 | 531,900 | 6.6 |
| Hawaii | 6/14/2000 | Mandatory | 2001–2014 | 14 | 12,139 | 6/30/14 | 1,063,904 | 11.4 |
| Illinois | 8/1/2013 | Mandatory | 2014–2015 | 6 | 2600d | 7/1/15 | 9,865,054 | 0.3 |
| Maine | 11/2/1999 | Voluntary | 2011–2013 | 3 | 1,768 | 12/31/13 | 1,069,723 | NA |
| Maryland | 4/14/2014 | Mandatory | Not accepting | |||||
| Massachusetts | 11/6/2012 | Mandatory | 2015 | 1 | 5,600 | 3/1/15 | 5,349,320 | 1.0 |
| Michigan | 11/4/2008 | Mandatory | 2009–2014 | 6 | 96,408 | 9/30/14 | 7,646,466 | 12.6 |
| Minnesota | 5/30/2014 | Mandatory | 2015 | 1 | 98 | 7/1/15 | 4,172,517 | <0.1 |
| Montana | 11/2/2004 | Mandatory | 2005–2015 | 82 | 11,717 | 5/13/15 | 787,519 | 14.9 |
| Nevada | 11/7/2000 | Mandatory | 2012–2015 | 32 | 9,345 | 5/30/15 | 2,116,445 | 4.4 |
| New Hampshire | 7/23/2013 | Mandatory | Not accepting | |||||
| New Jersey | 1/18/2010 | Mandatory | 2012–2014 | 6 | 2,727 | 12/31/14 | 6,868,119 | 0.4 |
| New Mexico | 3/13/2007 | Mandatory | 2012–2015 | 32 | 14,623 | 5/28/15 | 1,564,485 | 9.3 |
| New York | 7/5/2014 | Mandatory | Not accepting | |||||
| Oregon | 11/3/1998 | Mandatory | 2009–2015 | 36 | 71,191 | 4/1/15 | 3,070,003 | 23.2 |
| Rhode Island | 1/3/2006 | Mandatory | 2006–2015 | 10 | 11,421 | 6/26/15 | 838,281 | 13.6 |
| Vermont | 7/1/2004 | Mandatory | 2006–2015 | 24 | 1,754 | 3/25/15 | 503,282 | 3.5 |
| Washington | 11/3/1998 | None |
Range of years MMJ registry data was available. ‘Not accepting’ means states have not begun accepting MMJ applications.
Data on the number of MMJ participants are available for the number of time points within the range of registry data available.
Adult (18+) state population based on US Census estimates for 2014
Estimate (not actual number) based on Illinois Medical Cannabis Pilot Program website updates.
Sixteen states and DC had recent information on the number of registered MMJ participants (Table 1). Four states with the largest MMJ populations were Colorado (N=114,713), Michigan (N=96,408), Oregon (N=71,191), and Arizona (N=70,190). Adjustment for differences in the size of the state’s adult population revealed high MMJ participation in Colorado (29 per 1,000 adults) and Oregon (23 per 1000). Moderate levels of participation in the range of 10 to 15 per 1,000 were found in AZ, HI, MI, MT, and RI. All other states and DC had relatively low levels of less than 10 per 1,000. Presently, there are approximately 441,279 registered MMJ participants currently in the US (including states with voluntary registry programs), and an estimated 7.6 registered MMJ participants for every 1,000 adults (excluding states with voluntary registries; data not shown in table).
3.2. Trends in Medical Marijuana Participation
Prior to 2009, MMJ participation was relatively low (i.e., less than 10 per 1,000) and flat, therefore only trends since 2009 are depicted in Figure 1 (see Supplementary Figure 1 for the full time trend1). In January 2009, six states (AK, CO, HI, MT, RI, and VT) had fewer than 5 MMJ participants per 1,000 adults, while Oregon had 8 per 1,000. Participation rose sharply beginning in early 2009, especially in Colorado and Montana, where levels reached 10–11 per 1,000 by January 2010, and then peaked at 34 and 41 per 1,000, respectively, by mid-2011. Modest increases during this period was witnessed in Oregon and Hawaii, where levels increased to 16 per 1,000 (OR) and 8 per 1,000 (HI). Alaska, Rhode Island, and Vermont saw little increase, and prevalence remained less than 5 per 1,000. Michigan, the only state that started registering MMJ participants in 2009, quickly rose to 4 per 1,000 adults by September 2010, and then 16 per 1,000 approximately one year later.
Figure 1.
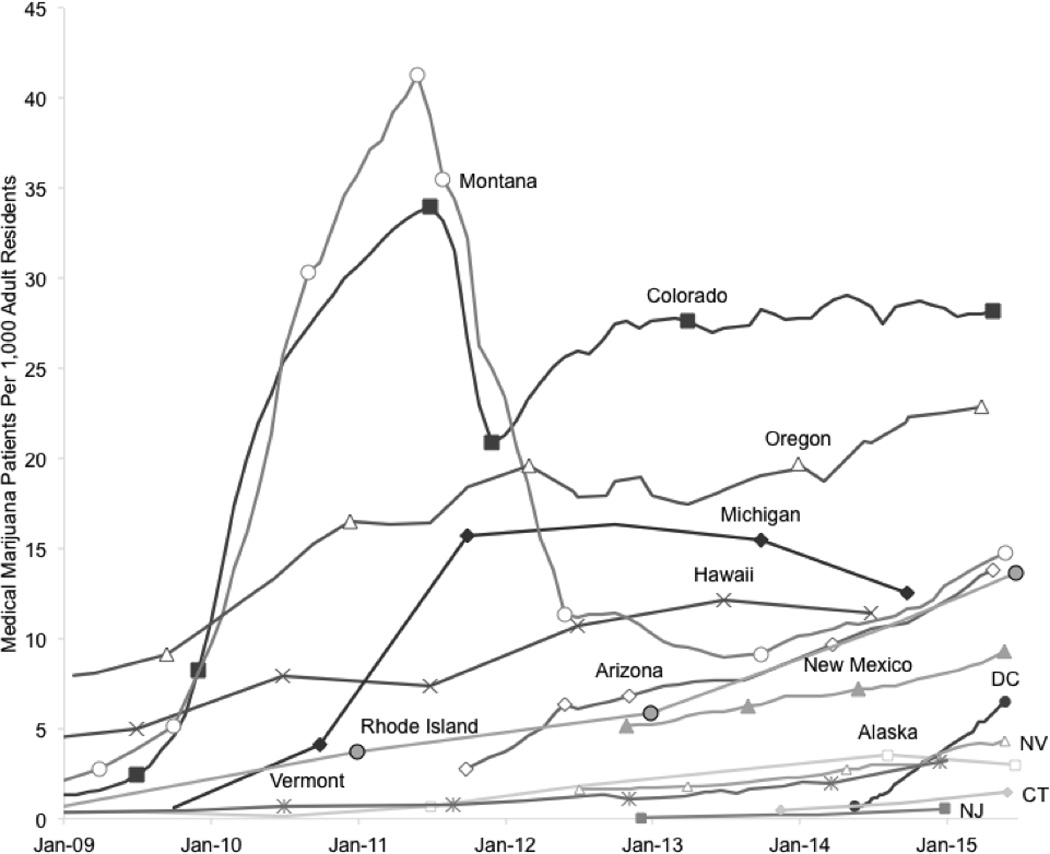
Number of registered medical marijuana participants per 1,000 adult state residents over time in 13 US states and the District of Columbia from January 2009 to April 2015
Trends since mid-2011 have differed considerably in these states and in states with MMJ registry data since 2012. Participation declined significantly in CO and MT. In Colorado, levels dropped 38% (21 per 1,000) by the end of 2011, but rebounded and has remained relatively stable around 27 per 1,000 since January 2013. Medical marijuana participation declined by 73% in Montana by May 2012 (11 per 1,000), and only since 2014 have levels increased to their present 15 per 1,000. In Michigan, the prevalence of MMJ participation changed little in 2012, and has declined in 2013 and 2014 to 12.6 per 1,000. By contrast, MMJ participation has increased steadily in Oregon, Hawaii, and Rhode Island. Participation in Rhode Island increased significantly from 2013 to 2015, more than doubling from 5.8 per 1,000 to 13.6 per 1,000. A similar rate of increase was observed for Arizona, which reported 3.7 MMJ participants per 1,000 in January, 2012, but now has around 13.8 per 1,000 as of April 2015. Gradual, steady increases were seen for New Mexico, Alaska, Nevada, and Vermont, while there has been little increase in Connecticut and New Jersey over the past year. In contrast, MMJ participation in DC has quickly risen over the past year, reaching 6.5 participants per 1,000.
3.3. Trends in Medical Marijuana Participation by Sex
Five states and DC had available data on sex differences in MMJ participation (AK, AZ, CO, OR, and RI), but only four (AZ, CO, DC, and RI) had data at multiple time points (Table 2). Arizona and Colorado had the most informative trend data, which spanned from 2012 to 2015. In both states, the proportion of male MMJ participants declined consistently from 73% and 68%, respectively, to 67% and 65% by April 2015. From August 2014 to June 2015, sex differences also declined in RI from 70% to 69%. While no trend data was available for Alaska and Oregon, both states had the lowest proportion of male MMJ participants at 59%–60%. DC was the only area where the proportion of male MMJ participants increased from 67% in June 2014 to 69% by June, 2015.
Table 2.
Proportion (%) of registered medical marijuana (MMJ) participants that are male in five US states and District of Columbia.
| Year | ||||
|---|---|---|---|---|
| State | 2012 | 2013 | 2014 | 2015 |
| Alaska | ||||
| Month-Year | No Data Available | Jun-15 | ||
| % Male | 59% | |||
| Arizona | ||||
| Month-Year | Jun-12 | Jun-13 | Jun-14 | Apr-15 |
| % Male | 73% | 72% | 69% | 67% |
| Colorado | ||||
| Month-Year | Jun-12 | Jun-13 | Jun-14 | Apr-15 |
| % Male | 68% | 67% | 66% | 65% |
| District of Columbia | ||||
| Month-Year | No Data Available | Jun-14 | Jun-15 | |
| % Male | 67% | 69% | ||
| Rhode Island | ||||
| Month-Year | No Data Available | Aug-14 | Jun-15 | |
| % Male | 70% | 69% | ||
| Oregon | ||||
| Month-Year | No Data Available | Apr-15 | ||
| % Male | 60% | |||
3.4. Trends in Medical Marijuana Participation by Age
Eight states (AK, AZ, CO, MT, NV, OR, RI, and VT) had registry data on the number of children and adolescents under the age of 18 years (i.e., minors) registered as MMJ participants (Figure 2). Most states had no more than 8 minor MMJ participants per 100K (AK, AZ, MT, NV, RI, and VT). Prior to October 2011, Montana had a peak of 41 minor participants per 100K, but then levels dropped substantially, and now has around 1.8 per 100K. In Colorado, MMJ participation among minors rose steadily until June 2013, when prevalence increased from 3 per 100K to 38 per 100K by March 2015. Participation was also relatively high and may be increasing in Oregon (26 per 100K).
Figure 2.
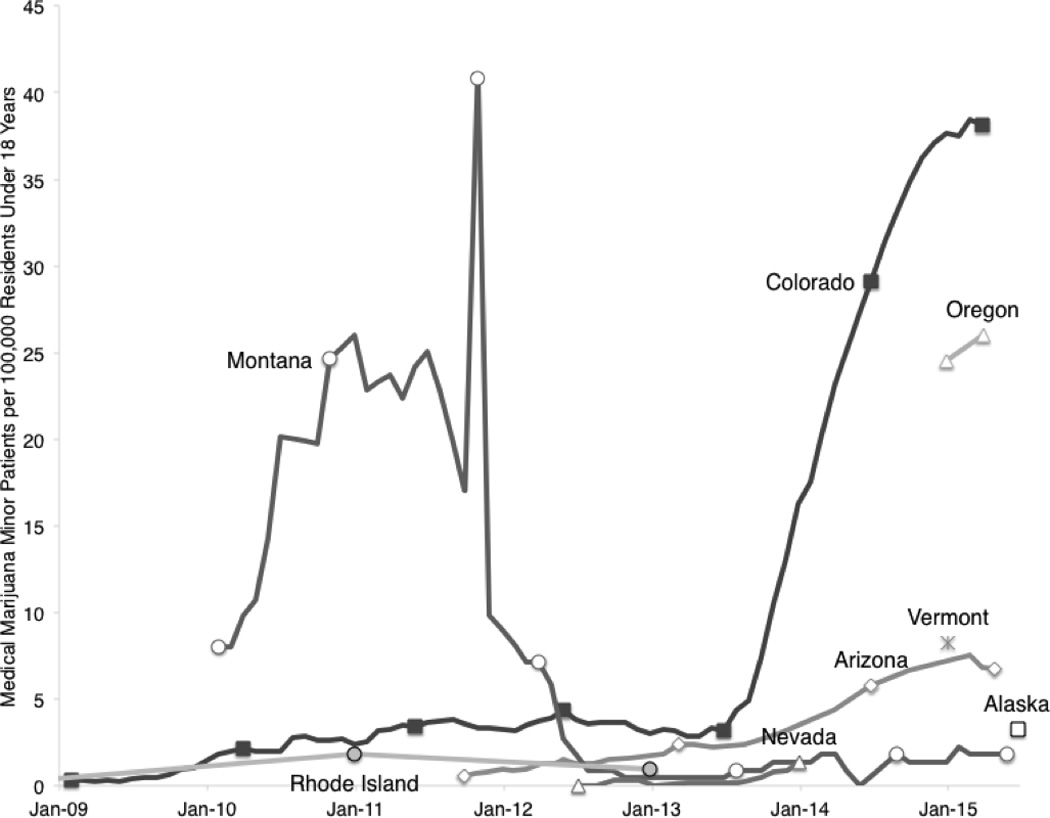
Number of registered medical marijuana minor participants per 100,000 residents under 18 years.
The age distribution of recent MMJ participation in eight states (AK, AZ, CO, MT, NV, OR, RI, and VT) showed that a large proportion of participants were in their 40s and 50s (Table 3). For example, in Alaska, Montana, Nevada, Oregon, Rhode Island, and Vermont, MMJ participants in their 50s accounted for around roughly 20%–28% of all participants. States also differed in their proportion of young adult MMJ participants (i.e., aged 18–29 or 30). Young adults made up 28% and 24% of MMJ participants in Colorado and Arizona, respectively, while Alaska (10.3%) and Vermont (10.0%) had the least. The highest concentration of MMJ participants in any state by age group (35 per 1,000) was found among 21–30 year olds in Colorado.
Table 3.
Distribution and prevalence of registered medical marijuana (MMJ) participants by age group in eight US states.
| State (As of)/ Age Group |
Proportion (%) |
Particpants Per 1000a |
State (As of)/ Age Group |
Proportion (%) |
Participants Per 1000a |
State (As of)/ Age Group |
Proportion (%) |
Patients Per 1000a |
|---|---|---|---|---|---|---|---|---|
| Alaska (June 2015) | Montana (May 2015) | Rhode Island (June 2015) | ||||||
| Under 18 | <1.0 | <0.1 | Under 18 | <1.0 | <0.1 | 21 & Under | 2.2 | 0.9 |
| 18–24 | 4.1 | 0.9 | 18–20 | 1.9 | 5.4 | 22–29 | 13.0 | 12.9 |
| 25–29 | 6.2 | 1.7 | 21–30 | 15.6 | 13.8 | 30–39 | 20.8 | 19.3 |
| 30–39 | 17.6 | 2.9 | 31–40 | 20.1 | 19.9 | 40–49 | 19.9 | 16.1 |
| 40–49 | 18.2 | 3.3 | 41–50 | 17.0 | 16.5 | 50–59 | 24.1 | 17.6 |
| 50–59 | 28.5 | 4.4 | 51–60 | 25.9 | 19.7 | 60–69 | 16.4 | 16.4 |
| 60–69 | 19.4 | 4.3 | 61–70 | 16.6 | 16.1 | 70 & Over | 3.6 | 3.7 |
| 70 & Over | 3.0 | 1.2 | 71 & Over | 2.9 | 3.4 | |||
| Arizona (April 2015) | Nevada (Jan. 2014) | Vermont (Jan. 2015) | ||||||
| Under 18 | <1.0 | <0.1 | Under 18 | <1.0 | <0.1 | Under 18 | <1.0 | <1.0 |
| 18–30 | 23.9 | 14.0 | 18–20 | <1.0 | 0.5 | 18–24 | 1.4 | <1.0 |
| 31–40 | 20.0 | 16.5 | 21–24 | 3.8 | 1.2 | 25–34 | 8.6 | 2.0 |
| 41–50 | 15.9 | 13.4 | 25–34 | 18.9 | 2.4 | 35–44 | 16.4 | 3.7 |
| 51–60 | 20.1 | 16.8 | 35–44 | 18.9 | 2.4 | 45–54 | 25.2 | 4.5 |
| 61–70 | 15.9 | 15.7 | 45–54 | 21.2 | 2.7 | 55–64 | 31.3 | 5.3 |
| 71 & Over | 4.1 | 4.3 | 55–64 | 23.1 | 3.3 | 65 & Over | 16.5 | 2.5 |
| 65 & Over | 13.0 | 1.7 | ||||||
| Colorado (April 2015) | Oregon (April 2015) | |||||||
| Under 18 | <1.0 | <1.0 | Under 18 | <1.0 | <1.0 | |||
| 18–20 | 5.0 | 28.7 | 18–20 | 1.3 | 6.5 | |||
| 21–30 | 23.0 | 34.9 | 21–24 | 4.3 | 14.0 | |||
| 31–40 | 20.7 | 32.9 | 25–29 | 8.1 | 22.0 | |||
| 41–50 | 16.1 | 26.1 | 30–39 | 20.7 | 28.0 | |||
| 51–60 | 19.0 | 30.4 | 40–49 | 17.2 | 24.4 | |||
| 61–70 | 13.2 | 30.0 | 50–59 | 23.3 | 30.5 | |||
| 71 & Over | 2.4 | 7.4 | 60–69 | 20.3 | 30.9 | |||
| 70 & Over | 5.1 | 9.0 | ||||||
Denominator of prevalence proportion used age-specific state population based on US Census estimates for 2014.
Four states had registry data on trends in MMJ participation over time by age group (AZ, CO, MT, and NV). Results are summarized here with accompanying figures available in supplementary materials (see Supplemental Figures 2–52). Age-specific trends tended to follow the shape of the state’s overall trend, and differences by age group mostly ran parallel. A few exceptions are noted. First, MMJ participation among 61–70 year olds in Arizona increased from 2012 to 2015 at a faster rate than other groups, and is now has the third largest concentration of participants behind 51–60 and 31–40 year olds (Supplemental Figure 23). Second, during the sharp increase in MMJ participation in Montana after 2009, participation rates rose faster for 21–30 year olds than for other groups and had the highest concentration of participants (Supplemental Figure 44). After mid-2011, participation in this age group dropped the farthest, and as of 2015, only those under 18, 18–20, and over 70 years had lower rates of participation.
4. DISCUSSION
This paper sought to provide a basis for comparing trends in MMJ participation across a heterogeneous and rapidly evolving set of laws, regulations, and social norms. The number of registered MMJ users in the US (around 440,000) is certainly an underestimate, and we might expect the figure closer to 650,000 assuming California and Washington are similar to Colorado. The national prevalence of 7.6 MMJ users per every 1,000 adults is also underestimates the true number. Nevertheless, important differences between states exist with relatively high levels of MMJ registration in Colorado and Oregon (i.e., 21–30 per 1,000), moderate levels in Arizona, Hawaii, Michigan, Montana, and Rhode Island (i.e., 10–20 per 1,000), and lower rates in DC and other states.
Differences in MMJ participation within states over time might be explained by variation in marijuana policies. Several states show relatively low and flat MMJ registration before 2009. During this period, the US Department of Justice (DOJ) actively enforced laws against marijuana cultivators, distributors, and possessors, even when individuals complied with state laws (Gonzales vs. Raich, 2005; Reinarman et al., 2011; Sekhon, 2009). In March, 2009, the DOJ announced to federal prosecutors that individuals complying with state MMJ laws should no longer be high priority (Johnston and Lewis, 2009; Ogden, 2009). Following this announcement, news outlets reported substantial increases in dispensaries opening in Colorado, Montana, Michigan, and California (Harger, 2009; Hoffman, 2014; National Public Radio, 2009; Osher, 2010; Scott, 2009). Findings concur with a faster rise in MMJ registration during this time in states that did not prohibit dispensaries (e.g., CO, MT, and MI) compared to those that did (e.g., AK, HI, OR, RI, and VT) (Pacula et al., 2013). Further, registration in Rhode Island rose fastest from 2013–2015 - only after the state began allowing dispensaries in 2013 (Gourlay, 2013). Nevertheless, these data cannot draw firm causal conclusions.
Changes in federal and state policies might also explain declines in MMJ registration in Colorado, Montana, and Michigan after mid-2011. For example, the DOJ later clarified that individuals engaged in MMJ activities remain a possible target for prosecution (Cole, 2011; Ingold, 2011). Colorado and Montana both enacted legislation in 2011 that restricted dispensaries, and instituted additional requirements for recommending physicians and patients (Colorado Departments of Public Health and Environment, 2013; Montana Legislature, 2011). In Michigan, MMJ registration has declined since the state supreme court ruled dispensaries illegal in 2013 (State of Michigan vs. McQueen, 2013). Nevertheless, state MMJ laws and policies differ in other important aspects that might account or contribute to these trends (e.g., application fees, types of qualifying medical conditions, and restrictions on home cultivation; Pacula et al., 2014).
Prior studies also find males are more likely to use MMJ, although findings in Colorado and Arizona that show women may be closing this gap over time is novel (Reinarman et al., 2011; Zaller et al., 2015). Further, Alaska and Oregon have the smallest sex differences in registration, and also have allowed MMJ the longest (since 1998). Only in DC has the male excess in MMJ registration widen. This evidence suggests males may be early adopters into MMJ programs. Males are more likely to have a chance to use marijuana, and MMJ users tend to have prior experience using the drug (Ogborne et al., 2000; Reinarman et al., 2011; Van Etten et al., 1997). Women might also view marijuana as more harmful and/or prefer other alternative or complementary treatments for medical conditions (Pacek et al., 2015; Richardson et al., 2000).
Less than 1% of MMJ registrants are minors and differences between states are apparent. Low rates among this group may be due to the limited number of qualifying medical conditions that apply to minors, additional restrictions to obtain and administer MMJ, and potential social stigma related to parents administering MMJ to their children (Greenlee et al., 2001; Johannes et al., 2010; Rizzo et al., 2004). Montana effectively eliminated dispensaries in 2011, and thereby limited the only commercial source of marijuana-infused preparations that can be administered to minors (Montana Legislature, 2011). This likely explains the substantial drop in registration. These declines mirrored a later rapid increase in minor MMJ registration in Colorado since 2013. Media reports suggest parents might be migrating to the state to take advantages of the liberal MMJ laws there and the developed marijuana-infused product market (Talamo et al., 2015).
Among adults, MMJ participants tend to be in their 40s and 50s. The age distributions found here are mostly consistent with studies of clinical samples (Ilgen et al., 2013; Reinarman et al., 2011; Zaller et al., 2015). In several states, individuals in their 50s represented the largest age group of participants. These adults belong to the same cohort having the highest marijuana incidence since the 1960s, and therefore may be more open to using marijuana medicinally (Gfroerer et al., 2002). By contrast, Colorado and Arizona are notable for having larger proportions of young adult MMJ participants. Young adults perceive marijuana to be less harmful, which could encourage medicinal use (Pacek et al., 2015). Younger participants might also be more likely to engage in diversion or use MMJ registration to circumvent laws regarding recreational use, although the magnitude of this is uncertain (Kondrad and Reid, 2013; Thurstone et al., 2011; Ware et al., 2003). If true on a large scale, one might then expect MMJ registration to decline given legal access to recreational marijuana. However, no significant drop in registration has occurred in Colorado following marijuana legalization in November 2012, or after initiation of retail sales in January 2014. Nevertheless, lower taxes imposed on MMJ purchases could provide a strong economic incentive for individuals to remain in the program.
These findings are not without limitations. The validity of the numbers reported by MMJ registries used for estimating rates of participation is unclear. These numbers may underestimate to the degree there are un-registered MMJ users, and may overestimate to the degree there are registered, recreational-only users. Even among states with mandatory registry requirements, states can vary in what legal protections remain to un-registered users, which might affect rates of registration (Pacula et al., 2014). Errors in data entry (e.g., duplicate registrations) and reporting by state agencies also cannot be ruled out. A recent performance audit by the CO Department of Public Health and Environment suggests the rate of missing or conflicting data is low (Colorado Departments of Public Health and Environment, 2013). States also varied in the number of time points of data available, and therefore trends in states with annual or biennial data may be more poorly characterized.
Despite these limitations, there is currently no data substitute available to estimate the size and trends of the MMJ population in the US. Estimates of MMJ use from large, nationally representative US surveys, such as the National Survey on Drug Use and Health, may eventually provide a means of validating these estimates. Until such time, MMJ registries may be the best source of data on this subject, and are being relied upon by public health agencies and legislatures to inform marijuana policies. Therefore, comparing these data across states is necessary in order to attempt to draw conclusions that will help inform both public policy and identify future research needs.
To conclude, findings from this study suggest a number of applications for research on the impact of MMJ laws. Although only superficially discussed, a detailed analysis of specific state-level marijuana policies associated with changes in MMJ registration could help identify policies that have the most impact and who is most affected by them (e.g., by demographics and qualifying medical condition). This may help states better plan and provide medical care for specific groups of MMJ patients. These trends may also provide important insights into the impact of MMJ laws on nonmedical marijuana use and other related outcomes (e.g., impaired driving and the use of prescription pain medication). Whether the size and trend in the MMJ population directly or indirectly influences access, attitudes, and use of marijuana should be carefully evaluated and may need to be accounted for in future studies.
Supplementary Material
Highlights.
Trends in medical marijuana (MMJ) use has increased greatly since 2009.
Male-dominated sex differences may be decreasing over time.
MMJ users mostly in 50s, but large proportion of young adults in CO and AZ.
Acknowledgments
The author wishes to acknowledge the help of Drs. Renee Johnson and Silvia Martins, as well as medical marijuana registry program staff, especially Scottina Ruis (HI), Lindsey Wells (VT), Pam Graber (NV), Mike Simoli (RI), Jake Musslewhite (AK), and Seth Crawford (OR).
Role of Funding Support
The author acknowledges funding support by the National Institutes of Health under the Ruth L. Kirschstein National Research Service Award (T32DA007292, awarded to C. Debra M. Furr-Holden) from the National Institute on Drug Abuse.
Footnotes
Publisher's Disclaimer: This is a PDF file of an unedited manuscript that has been accepted for publication. As a service to our customers we are providing this early version of the manuscript. The manuscript will undergo copyediting, typesetting, and review of the resulting proof before it is published in its final citable form. Please note that during the production process errors may be discovered which could affect the content, and all legal disclaimers that apply to the journal pertain.
Supplementary material can be found by accessing the online version of this paper at http://dx.doi.org and by entering doi:…
AUTHOR DISCOSURES
Conflict of Interests
The author declares no conflicts of interests regarding this work.
Contributors
Sole authorship
REFERENCES
- Anderson DM, Rees DI, Sabia JJ. Medical marijuana laws and suicides by gender and age. Am. J. Public Health. 2014;104:2369–2376. doi: 10.2105/AJPH.2013.301612. [DOI] [PMC free article] [PubMed] [Google Scholar]
- Borgelt LM, Franson KL, Nussbaum AM, Wang GS. The pharmacologic and clinical effects of medical cannabis. Pharmacother. J. Hum. Pharmacol. Drug Ther. 2013;33:195–209. doi: 10.1002/phar.1187. [DOI] [PubMed] [Google Scholar]
- Bowles DW. Persons registered for medical marijuana in the United States. J. Palliat. Med. 2012;15:9–11. doi: 10.1089/jpm.2011.0356. [DOI] [PubMed] [Google Scholar]
- Cerdá M, Wall M, Keyes KM, Galea S, Hasin D. Medical marijuana laws in 50 states: investigating the relationship between state legalization of medical marijuana and marijuana use, abuse and dependence. Drug Alcohol Depend. 2012;120:22–27. doi: 10.1016/j.drugalcdep.2011.06.011. [DOI] [PMC free article] [PubMed] [Google Scholar]
- Cohn D. Pew Social and Demographic Trends. Washington, DC: Pew Research Center; 2011. State population estimates and Census 2010 counts: did they match? [Google Scholar]
- Cole JM. Guidance regarding the Ogden memo in jurisdictions seeking to authorize marijuana for medical use. Washington, DC: US Department of Justice; 2011. [Google Scholar]
- Colorado Departments of Public Health and Environment. Medical Marijuana Regulatory System. Part II - Performance Audit 2013. 2013 (Performance Audit). [Google Scholar]
- Di Marzo V, Bifulco M, De Petrocellis L. The endocannabinoid system and its therapeutic exploitation. Nat. Rev. Drug Discov. 2004;3:771–784. doi: 10.1038/nrd1495. [DOI] [PubMed] [Google Scholar]
- Gfroerer JC, Wu L-T, Penne MA. Substance Abuse and Mental Health Services Administration. Rockville, MD: Office of Applied Studies; 2002. Initiation of Marijuana Use: Trends, Patterns, and Implications. [Google Scholar]
- Ghosh TS, Van Dyke M, Maffey A, Whitley E, Erpelding D, Wolk L. Medical marijuana’s public health lessons—implications for retail marijuana in Colorado. N. Engl. J. Med. 2015;372:991–993. doi: 10.1056/NEJMp1500043. [DOI] [PubMed] [Google Scholar]
- Gonzales vs. Raich. United States Supreme Court. Washington, DC: 2005. [Google Scholar]
- Gourlay K. Medical Marijuana Stores: More Spa. [accessed 8.20.15];Less Pharmacy. 2013 URL http://ripr.org/post/medical-marijuana-stores-more-spa-less-pharmacy. [Google Scholar]
- Greenlee RT, Hill-Harmon MB, Murray T, Thun M. Cancer statistics, 2001. CA. Cancer. J. Clin. 2001;51:15–36. doi: 10.3322/canjclin.51.1.15. [DOI] [PubMed] [Google Scholar]
- Harger J. Medical marijuana law gives rise to industry, causes worries for law and health authorities. [accessed 7.31.15];2009 MLive.com. URL http://www.mlive.com/news/grand-rapids/index.ssf/2009/12/medical_marijuana_law_gives_ri.html. [Google Scholar]
- Hasin DS, Wall M, Keyes KM, Cerdá M, Schulenberg J, O’Malley PM, Galea S, Pacula R, Feng T. Medical marijuana laws and adolescent marijuana use in the USA from 1991 to 2014: results from annual, repeated cross-sectional surveys. Lancet Psychiatr. 2015;2:601–608. doi: 10.1016/S2215-0366(15)00217-5. [DOI] [PMC free article] [PubMed] [Google Scholar]
- Hill KP. Medical marijuana for treatment of chronic pain and other medical and psychiatric problems: a clinical review. JAMA. 2015;313:2474–2483. doi: 10.1001/jama.2015.6199. [DOI] [PubMed] [Google Scholar]
- Hoffman M. The Business Of Bud: Slowly, State Medical Marijuana Industry Regrowing. [accessed 7.31.15];Helena Indep. Rec. 2014 URL http://helenair.com/news/local/the-business-of-bud-slowly-state-medical-marijuana-industry-regrowing/article_83c9e926-caac-5ef9-9bb9-5f1f5a49ad93.html. [Google Scholar]
- Ilgen MA, Bohnert K, Kleinberg F, Jannausch M, Bohnert ASB, Walton M, Blow FC. Characteristics of adults seeking medical marijuana certification. Drug Alcohol Depend. 2013;132:654–659. doi: 10.1016/j.drugalcdep.2013.04.019. [DOI] [PubMed] [Google Scholar]
- Ingold J. Federal Memo: Medical-Marijuana Dispensaries Are Prosecution Targets. [accessed 9.3.15];2011 URL http://www.denverpost.com/ci_18391545. [Google Scholar]
- Johannes CB, Le TK, Zhou X, Johnston JA, Dworkin RH. The prevalence of chronic pain in United States: adults results of an internet-based survey. J. Pain. 2010;11:1230–1239. doi: 10.1016/j.jpain.2010.07.002. [DOI] [PubMed] [Google Scholar]
- Johnston D, Lewis NA. The New York Times. New York: 2009. [May 18, 2009]. Obama Administration to Stop Raids on Medical Marijuana Dispensers. [Google Scholar]
- Kondrad E, Reid A. Colorado family physicians’ attitudes toward medical marijuana. J. Am. Board Fam. Med. 2013;26:52–60. doi: 10.3122/jabfm.2013.01.120089. [DOI] [PubMed] [Google Scholar]
- Lynne-Landsman SD, Livingston MD, Wagenaar AC. Effects of state medical marijuana laws on adolescent marijuana use. Am. J. Public Health. 2013;103:1500–1506. doi: 10.2105/AJPH.2012.301117. [DOI] [PMC free article] [PubMed] [Google Scholar]
- Marijuana Policy Project. State-by-State Medical Marijuana Laws: How to Remove the Threat of Arrest, 2013. Washington, DC: Marijuana Policy Project; 2013. [Google Scholar]
- Montana Legislature. SB 423 Monitoring: Montana Marijuana Act - How SB 423 Changes Current Law. 2011 [Google Scholar]
- Morris RG, TenEyck M, Barnes JC, Kovandzic TV. The effect of medical marijuana laws on crime: evidence from State Panel Data, 1990–2006. Plos One. 2014;9:e92816. doi: 10.1371/journal.pone.0092816. [DOI] [PMC free article] [PubMed] [Google Scholar]
- National Public Radio. California, Marijuana Dispensaries Outnumber Starbucks. [accessed 7.31.15];2009 NPR.org. URL http://www.npr.org/templates/story/story.php?storyId=113822156. [Google Scholar]
- Ogborne AC, Smart RG, Weber T, Birchmore-Timney C. Who is using cannabis as a medicine and why: an exploratory study. J. Psychoactive Drugs. 2000;32:435–443. doi: 10.1080/02791072.2000.10400245. [DOI] [PubMed] [Google Scholar]
- Ogden DW. States Authorizing The Medical Use Of Marijuana. Washington, DC: US Department of Justice; 2009. Memorandum For Selected United State Attorneys On Investigations And Prosecutions. [Google Scholar]
- Osher CN. Denver Post. Denver, Colorado: 2010. [January 3, 2010]. As Dispensaries Pop Up, Denver May Be Pot Capital, U.S.A. [Google Scholar]
- Pacek LR, Mauro PM, Martins SS. Perceived risk of regular cannabis use in the United States from 2002 to 2012: differences by sex, age, and race/ethnicity. Drug Alcohol Depend. 2015;149:232–244. doi: 10.1016/j.drugalcdep.2015.02.009. [DOI] [PMC free article] [PubMed] [Google Scholar]
- Pacula RL, Hunt P, Boustead A. Words can be deceiving: a review of variation among legally effective medical marijuana laws in the United States. J. Drug Policy Anal. 2014;7:1–19. doi: 10.1515/jdpa-2014-0001. [DOI] [PMC free article] [PubMed] [Google Scholar]
- Pacula RL, Powell D, Heaton P, Sevigny EL. Assessing The Effects Of Medical Marijuana Laws On Marijuana And Alcohol Use: The Devil Is In The Details. Washington: National Bureau of Economic Research; 2013. [Google Scholar]
- Reinarman C, Nunberg H, Lanthier F, Heddleston T. Who are medical marijuana patients? Population characteristics from nine California assessment clinics. J. Psychoactive Drugs. 2011;43:128–135. doi: 10.1080/02791072.2011.587700. [DOI] [PubMed] [Google Scholar]
- Richardson MA, Sanders T, Palmer JL, Greisinger A, Singletary SE. Complementary/alternative medicine use in a comprehensive cancer center and the implications for oncology. J. Clin. Oncol. 2000;18:2505–2514. doi: 10.1200/JCO.2000.18.13.2505. [DOI] [PubMed] [Google Scholar]
- Rizzo MA, Hadjimichael OC, Preiningerova J, Vollmer TL. Prevalence and treatment of spasticity reported by multiple sclerosis patients. Mult. Scler. 2004;10:589–595. doi: 10.1191/1352458504ms1085oa. [DOI] [PubMed] [Google Scholar]
- Rubens M. Political and medical views on medical marijuana and its future. Soc. Work Public Health. 2014;29:121–131. doi: 10.1080/19371918.2013.821351. [DOI] [PubMed] [Google Scholar]
- Salomonsen-Sautel S, Min S-J, Sakai JT, Thurstone C, Hopfer C. Trends in fatal motor vehicle crashes before and after marijuana commercialization in Colorado. Drug Alcohol Depend. 2014;140:137–144. doi: 10.1016/j.drugalcdep.2014.04.008. [DOI] [PMC free article] [PubMed] [Google Scholar]
- Schuermeyer J, Salomonsen-Sautel S, Price RK, Balan S, Thurstone C, Min S-J, Sakai JT. Temporal trends in marijuana attitudes, availability and use in Colorado compared to non-medical marijuana states: 2003–11. Drug Alcohol Depend. 2014;140:145–155. doi: 10.1016/j.drugalcdep.2014.04.016. [DOI] [PMC free article] [PubMed] [Google Scholar]
- Scott T. Budding Business: Montana Pain Management Opens Missoula Pot Shop For Patients. [accessed 7.31.15];2009 missoulian.com. URL http://missoulian.com/news/local/budding-business-montana-pain-management-opens-missoula-pot-shop-for/article_08b6022c-dcab-11de-a491-001cc4c03286.html. [Google Scholar]
- Sekhon V. Highly uncertain times: an analysis of the executive branch’s decision to not investigate or prosecute individuals in compliance with state medical marijuana laws. Hastings Const. L. Q. 2009;37:553. [Google Scholar]
- State of Michigan vs. McQueen. Michigan Supreme Court. Lansing, Michigan: 2013. [Google Scholar]
- Talamo L, Swyter N, Kelley C. Parents Demand Medical Marijuana for Epileptic Kids. [accessed 8.20.15];NBC News. 2015 URL http://www.nbcnews.com/health/health-news/parents-demand-medical-marijuana-epileptic-kids-n411186. [Google Scholar]
- Thurstone C, Lieberman SA, Schmiege SJ. Medical marijuana diversion and associated problems in adolescent substance treatment. Drug Alcohol Depend. 2011;118:489–492. doi: 10.1016/j.drugalcdep.2011.03.031. [DOI] [PMC free article] [PubMed] [Google Scholar]
- US Census Bureau. Annual Estimates of the Resident Population for Incorporated Places Over 50,000, Ranked by July 1, 2012 Population: April 1, 2010 to July 1, 2012. Washington, DC: 2013. [Google Scholar]
- Van Etten ML, Neumark YD, Anthony JC. Initial opportunity to use marijuana and the transition to first use: United States, 1979–1994. Drug Alcohol Depend. 1997;49:1–7. doi: 10.1016/s0376-8716(97)00127-0. [DOI] [PubMed] [Google Scholar]
- Ware MA, Doyle CR, Woods R, Lynch ME, Clark AJ. Cannabis use for chronic non-cancer pain: results of a prospective survey. Pain. 2003;102:211–216. doi: 10.1016/s0304-3959(02)00400-1. [DOI] [PubMed] [Google Scholar]
- Whiting PF, Wolff RF, Deshpande S, Di Nisio M, Duffy S, Hernandez AV, Keurentjes JC, Lang S, Misso K, Ryder S, et al. cannabinoids for medical use: a systematic review and meta-analysis. JAMA. 2015;313:2456–2473. doi: 10.1001/jama.2015.6358. [DOI] [PubMed] [Google Scholar]
- Zaller N, Topletz A, Frater S, Yates G, Lally M. Profiles of medicinal cannabis patients attending compassion centers in Rhode Island. J. Psychoactive Drugs. 2015;47:18–23. doi: 10.1080/02791072.2014.999901. [DOI] [PubMed] [Google Scholar]
Associated Data
This section collects any data citations, data availability statements, or supplementary materials included in this article.