

Abstract
The postoperative survival of patients with stage III colorectal cancer (CRC) various obviously. We sought to develop novel nomograms for predicting the survival of these patients after radical surgery and postoperative chemotherapy.
A total of 620 consecutive patients with stage III CRC who underwent curative resection and postoperative chemotherapy between January 2009 and December 2015 were retrospectively collected and randomly allocated to the training (n = 372) or validation cohort (n = 248). Clinicopathological factors were collected and analyzed. On the basis of data from 372 patients in the training set, predictive factors for overall survival (OS) and disease-free survival (DFS) were identified using multivariate Cox regression and used to construct nomograms. The predictive performance of the nomograms was assessed by concordance index (C-index) and calibration plots. An external cohort of 248 patients was used to validate the nomograms. Furthermore, nomogram performance was compared with the performance of T and N stage stratification.
Tumor differentiation grade, lymph node metastasis ratio, intravascular emboli (IVE), preoperative serum carcinoembryonic antigen (CEA) level, albumin to globulin ratio (AGR), T stage and N stage were significant prognostic factors for OS on multivariate analysis; whereas, Tumor differentiation grade, lymph node metastasis ratio, IVE, AGR and N stage were significant for DFS. Nomograms to predict 3- and 5-year OS and DFS were established that performed well (C-indexes of 0.734 [95% CI, 0.691–0.779] for OS and 0.699 [95% CI, 0.657–0.740] for DFS prediction), and nomogram accuracy was confirmed in the validation cohort. Furthermore, model comparison proved that the nomograms were superior to risk stratification by T and N stage for stage III CRC.
We propose 2 practical nomograms for stage III CRC patients that provide more accurate prognostic predictions and should be helpful for guiding individualized treatment and postoperative surveillance.
Keywords: colorectal cancer, disease-free survival, nomogram, overall survival, prognosis
1. Introduction
Colorectal cancer (CRC) is the third most common cancer and the fourth leading cause of cancer-related mortality worldwide.[1] In China, there were an estimated 376,300 newly diagnosed cases and 191,000 deaths in 2015.[2] Stage III CRC patients make up a considerable proportion of cases, accounting for one-third of all CRC patients.[3] Even with curative surgery and adjuvant chemotherapy, the overall prognosis for Stage III CRC remains unsatisfactory, with a 5-year survival rate of only approximately 60%.[4]
Currently, pathological stage based on the Union for International Cancer Control TNM system is used for prognostic prediction, but survival outcomes differ widely within the same stage, especially in stage II and III CRC cases.[5] Unlike for stage II, there are few acknowledged risk factors for stage III CRC. The latest National Comprehensive Cancer Network (NCCN) guidelines recommended stratifying recurrence risk in stage III disease according to the T and N stages, and patients with stage T4 or N2 are considered to be at high risk.[6] However, other factors such as tumor location, differentiation grade (G), intravascular emboli (IVE), and serum carcinoembryonic antigen (CEA) level, were also reported to be related to CRC patient outcome.[7–10] Moreover, the role of the systemic inflammatory response in cancer progression has been increasingly recognized, and host inflammatory indices such as neutrophil to lymphocyte ratio (NLR), lymphocyte to monocyte ratio (LMR), platelet to lymphocyte ratio (PLR) and albumin to globulin ratio (AGR) have been reported to be associated with cancer prognosis.[11–13] However, the prognostic significance of many above factors in CRC remains controversial,[14–16] and few studies have comprehensively evaluated their prognostic value in stage III CRC.
A nomogram is a statistic model that combines and quantifies all proven prognostic factors using a simple graphical representation.[17] Several nomograms for CRC prognosis have been established in recent years, but none specifically for stage III disease. Therefore, we established novel nomograms integrating tumor and host factors to predict the risk of recurrence and mortality of stage III CRC patients who received radical resection and postoperative chemotherapy.
2. Materials and methods
2.1. General patient information
This retrospective study enrolled 620 pathologically confirmed stage III CRC patients who received radical surgery and subsequent adjuvant chemotherapy between January 2009 and December 2015 in Xiangya Hospital, Central South University, China. The chemotherapy regimens included FOLFOX4, CapeOX, FOLFIRI, and mFOLFOX6. Ethical approval was obtained from the Ethical Committee and Institutional Review Board of Xiangya Hospital.
The exclusion criteria were as follows:
-
(1)
preoperative anticancer therapy;
-
(2)
history of malignancy;
-
(3)
synchronous multiple primary tumors;
-
(4)
absence of postoperative adjuvant chemotherapy;
-
(5)
surgery not reaching R0 excision or with yields of less than 12 lymph nodes;
-
(6)
patients with chronic inflammatory diseases, serious liver diseases, and/or acute infections;
-
(7)
incomplete follow-up data or unknown outcome.
The variables collected and evaluated were as follows: gender, age, tumor location, maximal tumor diameter, G, T stage, N stage, metastatic lymph node ratio (LNR), NLR, LMR, PLR, AGR, preoperative serum CEA, and CA 19–9 levels, and the presence of intestinal obstruction and IVE. Furthermore, we restaged all patients according to the 8th edition TNM staging system. Patients were followed up regularly according to NCCN guidelines: every 3 months within 2 years after surgery, every 6 months in years 3 to 5, and annually thereafter. The median follow-up time was 40 months. The end points included overall survival (OS) and disease-free survival (DFS). OS was defined as the time from surgery to death, regardless of the cause; whereas, DFS was the time from surgery to the first recurrence or death.
2.2. Survival analysis and nomograms
Statistical analysis was implemented with GraphPad Prism 6.0 (GraphPad Software, La Jolla, CA) and R 3.1.2 software (Institute for Statistics and Mathematics, Vienna, Austria). Using the “survival” package in R, univariate Cox regression analyses were conducted to screen for variables significantly related to prognosis; these prognostic variables for OS and DFS were then enrolled in multivariate analyses using the Cox proportional hazards model. Forest diagrams based on regression models were plotted by using the “forest model” in R. Survival curves based on T and N staging were calculated using the Kaplan–Meier method and the log-rank test. P <.05 was set as the level of statistical significance. All confidence intervals (CIs) are stated at the 95% confidence level.
Nomograms integrating independent prognostic factors for OS (G, LNR, IVE, CEA, AGR, and T) and DFS (LNR, IVE, AGR, and G) were created by using nomogram function of “rms” package in R software, and the prediction performance was assessed using Harrell's concordance index (c-index), a main measure of discrimination.[18] The forest diagrams of the c-indexes of different variables or nomogram models were plotted by using the forest plot package in R. The maximum value of c-index is 1.0, which indicates perfect discrimination; whereas, 0.5 indicates only random chance in distinguishing the outcome. Besides the c-index evaluation, each model was also evaluated with calibration plots in which the predicted outcomes versus the actual observed outcomes are graphically depicted.
3. Results
3.1. Baseline patient characteristics
The 620 patients who met the inclusion criteria were randomly allocated to either the training cohort (n = 372) or the validation cohort (n = 248). The demographics and clinical characteristics of both cohorts are reported in Tables 1 and 2.
Table 1.
Patients’ clinicopathological data for categorical variables.

Table 2.
Patients’ clinicopathological data for continuous variables.

3.2. Nomogram development
We performed univariate and multivariate analyses to screen for independent prognostic factors to use to build the nomograms. In univariate analyses, 10 variables were found to be related to OS (P <.05 for all; Table 3), and 6 variables were related to DFS (P <.05 for all; Table 3). Then, the variables identified as significant were used to perform multivariate analysis. Six variables were significantly related to OS, including G, LNR, IVE, CEA, AGR, and T stage (P <.05 for all; Fig. 1); and 4 variables were associated with both 3- and 5- year DFS, including G, LNR, IVE, AGR (P <.05 for all; Fig. 1).
Table 3.
Univariate survival analyses of OS and DFS in the training set.

Figure 1.
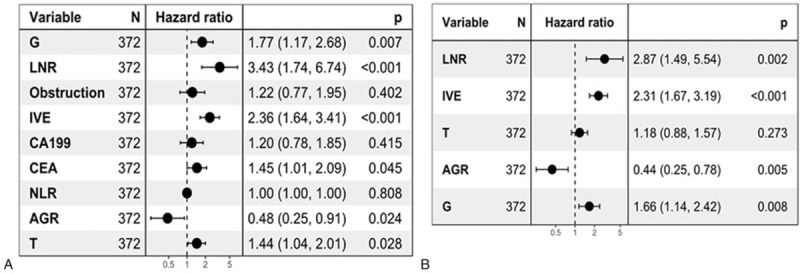
Multivariate analysis of the training set. Forest plots show multivariate survival analyses of OS (A) and DFS (B). DFS = disease-free survival, OS = overall survival.
Nomograms incorporating the respective independent prognostic factors of OS and DFS were established (Fig. 2). In the training set, nomograms displayed good accuracy in predicting OS and DFS, with C-indexes of 0.734 (95% CI 0.691–0.779) and 0.699 (95% CI 0.657–0.740), respectively. The calibration curves showed good coherence between the observed and nomogram-predicted OS and DFS at different time points in the training cohort (Fig. 3).
Figure 2.
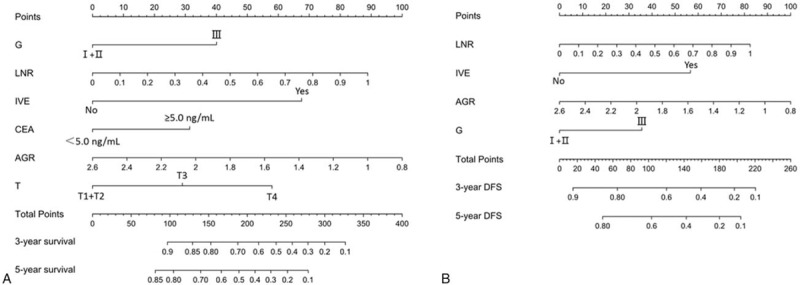
Stage III and IV colorectal cancer survival nomogram. Nomograms for predicting OS (A) and DFS (B) based on the training set. Each variable corresponds to a point on’ the scale. According to the sum of these points projected on the bottom scales, the nomogram can provide the probabilities of 3- and 5-year OS and DFS for an individual patient. DFS = disease-free survival, OS = overall survival.
Figure 3.
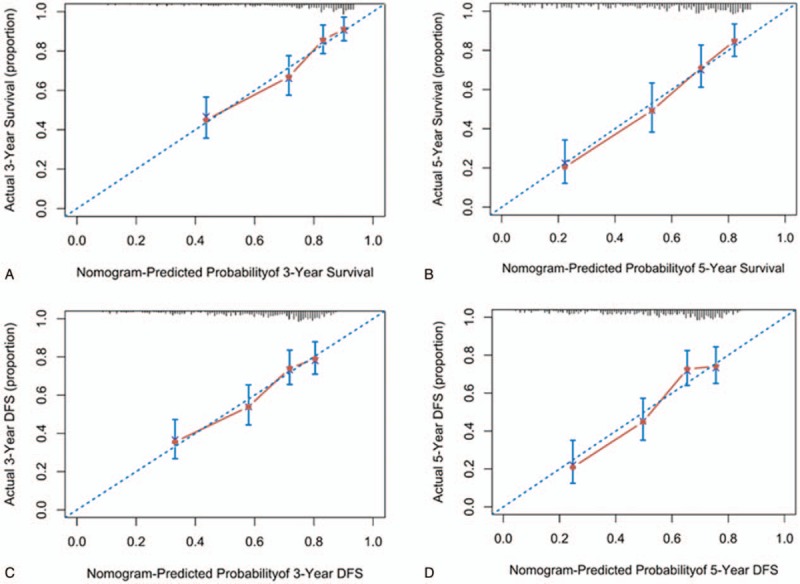
The internal calibration curve for predicting patient survival. Internal calibration nomogram for 3-year and 5-year OS (A, B) and 3-year and 5-year DFS (C, D). The 45-degree line represents an ideal match between the actual survival (Y-axis) and nomogram-predicted survival (X-axis). The perpendicular line means 95% confidence intervals. DFS = disease-free survival, OS = overall survival.
3.3. Nomogram validation
To further test predictive performance, nomograms were applied to an independent validation set. The C-indexes of the nomograms reached 0.714 (95% CI 0.664–0.764) and 0.709 (95% CI 0.662–0.756) in predicting OS and DFS, respectively. Moreover, the calibration plots showed good agreement between the observed and nomogram-predicted OS and DFS at different time points in the validation cohort (Fig. 4).
Figure 4.
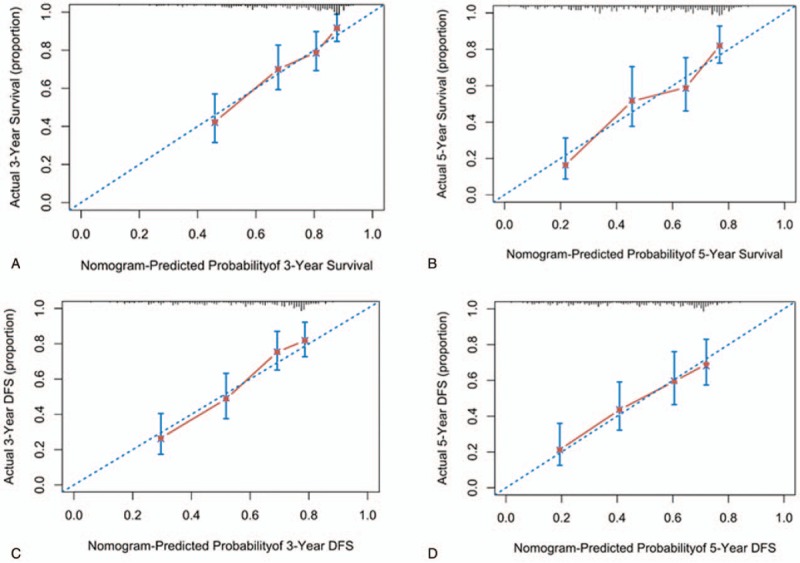
The external calibration curve for predicting patient survival. External calibration nomogram for 3-year and 5-year OS (A, B) and 3-year and 5-year DFS (C, D). The 45-degree line represents an ideal match between the actual survival (Y-axis) and nomogram-predicted survival (X-axis). The perpendicular line means 95% confidence intervals. DFS = disease-free survival, OS = overall survival.
The latest NCCN guideline for CRC recommended that T and N staging be used for risk stratification for Stage III CRC. Our study reproduced the stratification ability of T and N staging in OS (T1 + T2 vs T3 vs T4, mean [95% CI], 88.31 [86.73–89.88] vs 72.25 [69.31–75.19] vs 59.19 [54.05–64.34], P <.001; N1 vs N2, mean [95% CI], 77.70 [75.55–79.85] vs 56.82 [51.27–62.37], P <.001; Figure 5A and 5B) and DFS (T1 + T2 vs T3 vs T4, mean [95% CI], 82.65 [79.08–86.22] vs 67.74 [64.91–70.58] vs 54.97 [50.42–59.53], P <.001; N1 vs N2, mean [95% CI], 72.84 [70.39–75.28] vs 52.07 [47.54–56.60], P <.001; Fig. 5C and 5D). Then, we compared the predictive performance of the nomograms with that of using T and N staging. To our surprise, the nomograms exhibited higher accuracy in predicting OS (0.734; 95% CI, 0.691–0.779) and DFS (0.699; 95% CI, 0.657–0.740) than T and N stages (P <.01; Fig. 5).
Figure 5.
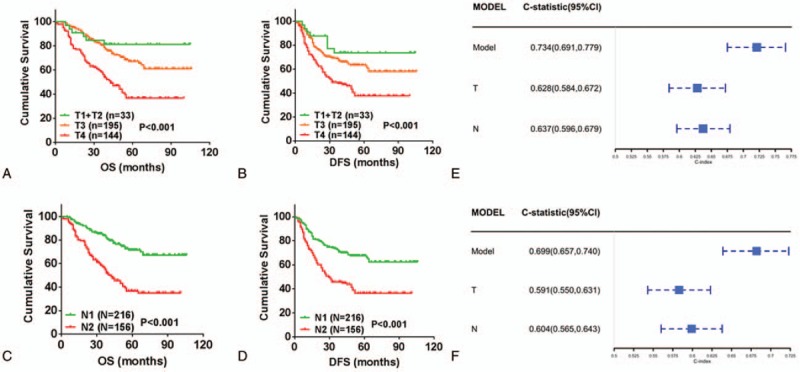
Kaplan–Meier curve analysis of prognostic stratification and predictive capability comparison. Prognostic classification of OS and DFS using the T staging (P <.001) (A and B); Prognostic stratification of OS and DFS using the N staging (P <.001) (C and D); Comparing the performance of model with T or N staging in predicting OS (E); Comparing the performance of model with T or N staging in predicting DFS (F). DFS = disease-free survival, OS = overall survival.
4. Discussion
Despite routine treatment with radical surgery and adjuvant chemotherapy, survival outcome remains heterogenous and unsatisfactory in Stage III CRC. It is reported that more than one-third of patients with this stage will develop recurrence or metastasis within 5 years of systematic therapy.[19] Therefore, an accurate risk evaluation is imperative to guide postoperative treatment and recurrence surveillance. Here, we report the development of 2 predictive nomograms of recurrence and survival for Stage III CRC that demonstrated predictive accuracy and reliability in both the training and validation cohorts.
For the consideration of accuracy and practicability, we mainly considered variables that were objective and easily obtained in clinical practice for analysis. Six factors were finally integrated into the predictive nomograms for OS including the tumor differentiation grade, LNR, IVE, AGR, T stage, and preoperative serum CEA level; the former 4 factors were also enrolled into the nomogram for DFS. Poor differentiation, IVE, and T4 have acknowledged risk factors of recurrence in stage II CRC for many years[20] and were reproduced in the present study. Of special interest is that IVE, which was defined as a mass of tumor cells in blood vessels, was proven to be an adverse prognostic factor in our previous research.[9] Local tumor invasion can be dissected by radical surgery, but the circulating tumor cells are difficult to eliminate fully. This may explain the actuality that although postoperative local recurrence is significantly reduced, distant metastasis remains common and is the main cause of mortality in CRC. Besides, circulating tumor cells harbor a distinct stem cell phenotype and chemotherapy resistance patterns, with strong proliferative and metastatic potentials.[21] Thus, it is reasonable that IVE exhibited a high hazard ratio (HR) in OS and DFS, even exceeding the T stage. Lymph node involvement is the main feature of stage III CRC, and the N stage, as well as LNR, have been found to be reliable indicators of CRC patient prognosis.[22–24] We enrolled LNR into subsequent multivariable analysis and the nomograms because it achieved a higher HR in univariate analysis than did N stage; moreover, as a continuous variable, LNR use helps prevent the additional loss of information and improves predictive accuracy to some extent. [25] Because an insufficient lymph node harvest may exaggerate the LNR and, consequently, influence the predictive accuracy, we excluded cases with yields of less than 12 lymph nodes in the present study.
Recent reports have revealed that cancer progression and prognosis is determined not only by tumor factors but also by the host inflammatory response.[26,27] We analyzed the relationship between preoperative serum inflammatory indexes and the prognosis of stage III CRC. Our study demonstrates that only AGR is an independent prognostic factor of stage III CRC, with low AGR being associated with shorter OS and DFS. The exact mechanism for this has not been fully elucidated. Although serum albumin level reflects the nutritional status, it also decreases with systematic inflammation.[28] Meanwhile, albumin is crucial for drug delivery in chemotherapy and influences the therapy effect.[29] Serum globulin includes acute-phase proteins, such as C-reactive protein, serum amyloid A, complement C3, fibrinogen, and ceruloplasmin, which reflect the status of continuous systemic inflammation.[30] Chronic inflammation plays an important role in tumor growth, progression, metastasis, and immunosuppression.[31] To control for the effects of body dehydration and fluid retention, we calculated the ratio of albumin to globulin and demonstrated that AGR is a significant prognostic factor, consistent with prior reports.[30,32,33] However, NLR, LMR, and PLR did not show significance in multivariable analysis. The exact reasons for this are unclear, but it may be that, although reported to be predictive of prognosis in some studies,[12,13,34] other studies do not support their use as independent predictive factors.[15,16] Furthermore, we concentrated on stage III CRC. Moreover, as nonspecific indexes, NLR, LMR, and PLR may be easily affected by other factors such as infections, inflammation, and medications.[35] Although enrolled patients were strictly screened, it is difficult to exclude all the atypical and mild cases of such conditions in a retrospective study.
Although many nomograms have been constructed to predict prognosis for patients with CRC, their predictive performance was different. Kim et al[36] developed a nomogram to predict postoperative recurrence with Stage I CRC that had a c-index of 0.71; Nobuaki et al[37] constructed a nomogram for predicting recurrence with stage II CRC with a C-index of 0.64. In the present study, we developed 2 nomograms for patients with stage III CRC that exhibited moderate performance with a C-index of 0.734 for OS and 0.699 for DFS. Moreover, the accuracy of nomogram was demonstrated through external validation.
The latest NCCN guideline for CRC recommends stratification of Stage III CRC into high- and low-risk groups according to T and N stages, and that the adjuvant chemotherapy course be shortened from 6 to 3 months for low-risk patients.[38] Hence, we compared the performance of nomogram stratification with TNM system stratification. Although stratification using T and N staging performed well in the study, nomogram stratification displayed higher accuracy, with a C-index for OS prediction of 0.734 (95% CI, 0.691–0.779) and for DFS of 0.699 (95% CI, 0.657–0.740). These results are somewhat surprising but reasonable because the nomograms enrolled more robust variables, and many of them have been previously demonstrated to be independent prognostic factors in CRC patients.
Although we successfully developed and validated nomograms to predict the OS and DFS of stage III CRC patients after radical surgery and postoperative chemotherapy, our study does have several limitations. First, it is retrospective in design and includes a limited cohort size from a single institution, so selection bias may be underestimated. Besides, we did not use completely outside data sets from other hospitals but used our data for an external validation. However, we have 620 stage III CRC cases and we conducted strictly randomized grouping to allocate it into 2 sets. So we believe it can be regarded as an external validation to some extent [39]. Second, to ensure the completeness of the data, we collected cases in recent years with a relatively short follow-up duration. Moreover, many other important prognostic predictors, such as C-reactive protein,[40] cell-free DNA,[41] circulating tumor cells,[42] microsatellite status,[43] and RAS/RAF mutations[44] were not routinely tested in past years, which may discount nomogram accuracy.
5. Conclusion
We developed simple and accurate nomograms for predicting prognosis of stage III CRC after curative resection. These nomograms will help physicians perform risk stratification and perform individualized treatment and postoperative surveillance in patients with stage III CRC.
Author contributions
Conceptualization: Chenglong Li, Yuan Zhou, Haiping Pei.
Data curation: Chenglong Li, Qian Pei, Yuqiang Li.
Formal analysis: Chenglong Li, Qian Pei, Zhongyi Zhou.
Funding acquisition: Haiping Pei.
Investigation: Zhongyi Zhou, Yuan Zhou, Haiping Pei.
Methodology: Chenglong Li, Yuan Zhou, Yuqiang Li.
Project administration: Yuan Zhou, Haiping Pei.
Resources: Qian Pei, Zhongyi Zhou.
Software: Chenglong Li, Hong Zhu.
Supervision: Haiping Pei.
Validation: Fengbo Tan, Haiping Pei.
Visualization: Chenglong Li.
Writing – original draft: Chenglong Li, Fengbo Tan.
Writing – review & editing: Yuqiang Li, Haiping Pei.
Footnotes
Abbreviations: AGR = albumin to globulin ratio, CEA = carcinoembryonic antigen, CI = confidence interval, CRC = colorectal cancer, DFS = disease-free survival, HR = hazard ratio, IVE = intravascular emboli, LMR = lymphocyte to monocyte ratio, LNR = metastatic lymph node ratio, NLR = neutrophil to lymphocyte ratio, OS = overall survival, PLR = platelet to lymphocyte ratio.
The authors have no conflicts of interest to disclose.
References
- [1].Siegel RL, Miller KD, Jemal A. Cancer statistics, 2016. CA Cancer J Clin 2016;66:7–30. [DOI] [PubMed] [Google Scholar]
- [2].Chen W, Zheng R, Baade PD, et al. Cancer statistics in China, 2015. CA Cancer J Clin 2016;66:115–32. [DOI] [PubMed] [Google Scholar]
- [3].Chagpar R, Xing Y, Chiang YJ, et al. Adherence to stage-specific treatment guidelines for patients with colon cancer. J Clin Oncol 2012;30:972–9. [DOI] [PMC free article] [PubMed] [Google Scholar]
- [4].Hari DM, Leung AM, Lee JH, et al. AJCC Cancer Staging Manual 7th edition criteria for colon cancer: do the complex modifications improve prognostic assessment. J Am Coll Surg 2013;217:181–90. [DOI] [PMC free article] [PubMed] [Google Scholar]
- [5].Webber C, Gospodarowicz M, Sobin LH, et al. Improving the TNM classification: findings from a 10-year continuous literature review. Int J Cancer 2014;135:371–8. [DOI] [PubMed] [Google Scholar]
- [6].Benson AB, 3rd, Venook AP, Al-Hawary MM, et al. NCCN guidelines insights: colon cancer, version 2.2018. J Natl Compr Canc Netw 2018;16:359–69. [DOI] [PMC free article] [PubMed] [Google Scholar]
- [7].Zhang Y, Ma J, Zhang S, et al. A prognostic analysis of 895 cases of stage III colon cancer in different colon subsites. Int J Colorectal Dis 2015;30:1173–83. [DOI] [PubMed] [Google Scholar]
- [8].Halvorsen TB, Seim E. Degree of differentiation in colorectal adenocarcinomas: a multivariate analysis of the influence on survival. J Clin Pathol 1988;41:532–7. [DOI] [PMC free article] [PubMed] [Google Scholar]
- [9].Pei Q, Zhu H, Tan F, et al. Intravascular emboli is an independent risk factor for the prognosis of stage III colorectal cancer patients after radical surgery. Oncotarget 2016;7:57268–76. [DOI] [PMC free article] [PubMed] [Google Scholar]
- [10].Wiratkapun S, Kraemer M, Seow-Choen F, et al. High preoperative serum carcinoembryonic antigen predicts metastatic recurrence in potentially curative colonic cancer: results of a five-year study. Dis Colon Rectum 2001;44:231–5. [DOI] [PubMed] [Google Scholar]
- [11].Mantovani A, Allavena P, Sica A, et al. Cancer-related inflammation. Nature 2008;454:436–44. [DOI] [PubMed] [Google Scholar]
- [12].Kubo H, Murayama Y, Arita T, et al. The prognostic value of preoperative neutrophil-to-lymphocyte ratio in colorectal cancer. World J Surg 2016;40:2796–802. [DOI] [PubMed] [Google Scholar]
- [13].Li W, Tao L, Zhang L, et al. Prognostic role of lymphocyte to monocyte ratio for patients with pancreatic cancer: a systematic review and meta-analysis. Onco Targets Ther 2017;10:3391–7. [DOI] [PMC free article] [PubMed] [Google Scholar]
- [14].Wu Q, Hu T, Zheng E, et al. Prognostic role of the lymphocyte-to-monocyte ratio in colorectal cancer: an up-to-date meta-analysis. Medicine (Baltimore) 2017;96:e7051. [DOI] [PMC free article] [PubMed] [Google Scholar]
- [15].Portale G, Cavallin F, Valdegamberi A, et al. Platelet-to-lymphocyte ratio and neutrophil-to-lymphocyte ratio are not prognostic biomarkers in rectal cancer patients with curative resection. J Gastrointest Surg 2018;22:1611–8. [DOI] [PubMed] [Google Scholar]
- [16].Shen J, Zhu Y, Wu W, et al. Prognostic role of neutrophil-to-lymphocyte ratio in locally advanced rectal cancer treated with neoadjuvant chemoradiotherapy. Med Sci Monit 2017;23:315–24. [DOI] [PMC free article] [PubMed] [Google Scholar]
- [17].Iasonos A, Schrag D, Raj GV, et al. How to build and interpret a nomogram for cancer prognosis. J Clin Oncol 2008;26:1364–70. [DOI] [PubMed] [Google Scholar]
- [18].Steyerberg EW, Eijkemans MJ, Harrell FE, Jr, et al. Prognostic modeling with logistic regression analysis: in search of a sensible strategy in small data sets. Med Decis Making 2001;21:45–56. [DOI] [PubMed] [Google Scholar]
- [19].Schmoll HJ, Tabernero J, Maroun J, et al. Capecitabine plus oxaliplatin compared with fluorouracil/folinic acid as adjuvant therapy for stage iii colon cancer: final results of the NO16968 randomized controlled phase III trial. J Clin Oncol 2015;33:3733–40. [DOI] [PubMed] [Google Scholar]
- [20].Benson AB, 3rd, Schrag D, Somerfield MR, et al. American society of clinical oncology recommendations on adjuvant chemotherapy for stage II colon cancer. J Clin Oncol 2004;22:3408–19. [DOI] [PubMed] [Google Scholar]
- [21].Xiao Y, Ye Y, Yearsley K, et al. The lymphovascular embolus of inflammatory breast cancer expresses a stem cell-like phenotype. Am J Pathol 2008;173:561–74. [DOI] [PMC free article] [PubMed] [Google Scholar]
- [22].Qiu HB, Zhang LY, Li YF, et al. Ratio of metastatic to resected lymph nodes enhances to predict survival in patients with stage III colorectal cancer. Ann Surg Oncol 2011;18:1568–74. [DOI] [PubMed] [Google Scholar]
- [23].Chin CC, Wang JY, Yeh CY, et al. Metastatic lymph node ratio is a more precise predictor of prognosis than number of lymph node metastases in stage III colon cancer. Int J Colorectal Dis 2009;24:1297–302. [DOI] [PubMed] [Google Scholar]
- [24].Dekker JW, Peeters KC, Putter H, et al. Metastatic lymph node ratio in stage III rectal cancer; prognostic significance in addition to the 7th edition of the TNM classification. Eur J Surg Oncol 2010;36:1180–6. [DOI] [PubMed] [Google Scholar]
- [25].Kong SH, Lee HJ, Ahn HS, et al. Stage migration effect on survival in gastric cancer surgery with extended lymphadenectomy: the reappraisal of positive lymph node ratio as a proper N-staging. Ann Surg 2012;255:50–8. [DOI] [PubMed] [Google Scholar]
- [26].Zitvogel L, Pietrocola F, Kroemer G. Nutrition, inflammation and cancer. Nat Immunol 2017;18:843–50. [DOI] [PubMed] [Google Scholar]
- [27].Patel M, McSorley ST, Park JH, et al. The relationship between right-sided tumour location, tumour microenvironment, systemic inflammation, adjuvant therapy and survival in patients undergoing surgery for colon and rectal cancer. Br J Cancer 2018;118:705–12. [DOI] [PMC free article] [PubMed] [Google Scholar]
- [28].Gabay C, Kushner I. Acute-phase proteins and other systemic responses to inflammation. New Engl J Med 1999;340:48–54. [DOI] [PubMed] [Google Scholar]
- [29].Matsumoto I, Tanaka M, Shirakawa S, et al. Postoperative serum albumin level is a marker of incomplete adjuvant chemotherapy in patients with pancreatic ductal adenocarcinoma. Ann Surg Oncol 2015;22:2408–15. [DOI] [PubMed] [Google Scholar]
- [30].Azab B, Kedia S, Shah N, et al. The value of the pretreatment albumin/globulin ratio in predicting the long-term survival in colorectal cancer. Int J Colorectal Dis 2013;28:1629–36. [DOI] [PubMed] [Google Scholar]
- [31].Coussens LM, Werb Z. Inflammation and cancer. Nature 2002;420:860–7. [DOI] [PMC free article] [PubMed] [Google Scholar]
- [32].Shibutani M, Maeda K, Nagahara H, et al. The pretreatment albumin to globulin ratio predicts chemotherapeutic outcomes in patients with unresectable metastatic colorectal cancer. BMC Cancer 2015;15:347. [DOI] [PMC free article] [PubMed] [Google Scholar]
- [33].Toiyama Y, Yasuda H, Ohi M, et al. Clinical impact of preoperative albumin to globulin ratio in gastric cancer patients with curative intent. Am J Surg 2017;213:120–6. [DOI] [PubMed] [Google Scholar]
- [34].Tokunaga R, Sakamoto Y, Nakagawa S, et al. Comparison of systemic inflammatory and nutritional scores in colorectal cancer patients who underwent potentially curative resection. Int J Clin Oncol 2017;22:740–8. [DOI] [PubMed] [Google Scholar]
- [35].Templeton AJ, McNamara MG, Seruga B, et al. Prognostic role of neutrophil-to-lymphocyte ratio in solid tumors: a systematic review and meta-analysis. J Natl Cancer Inst 2014;106: [DOI] [PubMed] [Google Scholar]
- [36].Kim C, Kim WR, Kim KY, et al. Predictive nomogram for recurrence of stage i colorectal cancer after curative resection. Clin Colorectal Cancer 2018. [DOI] [PubMed] [Google Scholar]
- [37].Hoshino N, Hasegawa S, Hida K, et al. Nomogram for predicting recurrence in stage II colorectal cancer. Acta Oncol 2016;55:1414–7. [DOI] [PubMed] [Google Scholar]
- [38].Sobrero A, Grothey A, Iveson T, et al. The hard road to data interpretation: 3 or 6 months of adjuvant chemotherapy for patients with stage III colon cancer. Ann Oncol 2018;29:1099–107. [DOI] [PMC free article] [PubMed] [Google Scholar]
- [39].Song KY, Park YG, Jeon HM, et al. A nomogram for predicting individual survival of patients with gastric cancer who underwent radical surgery with extended lymph node dissection. Gastric Cancer 2014;17:287–93. [DOI] [PubMed] [Google Scholar]
- [40].Allin KH, Bojesen SE, Nordestgaard BG. Baseline C-reactive protein is associated with incident cancer and survival in patients with cancer. J Clin Oncol 2009;27:2217–24. [DOI] [PubMed] [Google Scholar]
- [41].Bedin C, Enzo MV, Del Bianco P, et al. Diagnostic and prognostic role of cell-free DNA testing for colorectal cancer patients. Int J Cancer 2017;140:1888–98. [DOI] [PubMed] [Google Scholar]
- [42].Hardingham JE, Grover P, Winter M, et al. Detection and clinical significance of circulating tumor cells in colorectal cancer—20 years of progress. Mol Med 2015;21suppl 1:S25–31. [DOI] [PMC free article] [PubMed] [Google Scholar]
- [43].Guastadisegni C, Colafranceschi M, Ottini L, et al. Microsatellite instability as a marker of prognosis and response to therapy: a meta-analysis of colorectal cancer survival data. Eur J Cancer 2010;46:2788–98. [DOI] [PubMed] [Google Scholar]
- [44].Taieb J, Kourie HR, Emile JF, et al. Association of prognostic value of primary tumor location in stage III colon cancer with RAS and BRAF mutational status. JAMA Oncol 2018;4:e173695. [DOI] [PMC free article] [PubMed] [Google Scholar]