Abstract
Objective:
Poor total cavopulmonary connection (TCPC) hemodynamics have been hypothesized to be associated with long-term complications in Fontan patients. Image-based Fontan surgical planning has shown great potential as a clinical tool because it can pre-operatively evaluate patient-specific hemodynamics. Current surgical planning paradigms commonly utilize cardiac-gated phase contrast magnetic resonance (MR) imaging to acquire vessel flows. These acquisitions are often taken under breath-held (BH) conditions and ignore the effect of respiration on blood flow waveforms. This study investigates the effect of respiration-driven flow waveforms on patient-specific hemodynamics using real-time MR acquisitions.
Methods:
Patient-specific TCPCs were reconstructed from cardiovascular MR images. Real-time phase contrast MR images were acquired under both free-breathing (FB) and breath-held conditions for 9 patients. Numerical simulations were employed to assess flow structures and hemodynamics used in Fontan surgical planning including hepatic flow distribution (HFD) and indexed power loss (iPL), which were then compared between FB and BH conditions.
Results:
Differences in TCPC flow structures between FB and BH conditions were observed throughout the respiratory cycle. However, the average differences (BH – FB values for each patient, which are then averaged) in iPL and HFD between these conditions were 0.002±0.011 (p = 0.40) and 1±3% (p = 0.28), respectively, indicating no significant difference in clinically important hemodynamic metrics.
Conclusions:
Respiration affects blood flow waveforms and flow structures, but might not significantly influence the values of iPL or HFD. Therefore, breath-held MR acquisition can be adequate for Fontan surgical planning when focusing on iPL and HFD.
1. Introduction
Fontan patients suffer from various long-term complications which are hypothesized to be attributed to an adverse hemodynamic environment in the total cavopulmonary connection (TCPC). Elevated TCPC power loss (PL) under exercise conditions has been associated with diminished patient exercise performance (Khiabani et al., 2015; Tang et al., 2017; Whitehead et al., 2007). Unbalanced hepatic blood flow distribution (HFD) between the two lungs has been associated with increased risk of pulmonary arteriovenous malformations (PAVM) in Fontan patients (Pike et al., 2004; Sundareswaran et al., 2009). These two TCPC hemodynamic metrics are often involved in image-based Fontan surgical planning, which is progressively making its way from a pure research tool to clinical use to improve Fontan surgical outcomes (Corsini et al., 2015; de Zélicourt and Kurtcuoglu, 2016; Trusty et al., 2018; Wei et al., 2017). Historically, the majority of surgical planning cases utilized blood flow waveforms segmented from magnetic resonance images (MRI) acquired under breath-held (BH) conditions. The BH acquisition is preferable because it reduces image artifacts due to respiratory motion(Wei et al., 2016) but it ignores the impact of respiration on the flow waveforms.
Recent clinical studies have demonstrated that passive flow in the TCPC is affected by respiration in single ventricle patients. Fogel et al. has shown that flow in the systemic venous pathway of Fontan patients is phasic to both cardiac and respiratory cycles; approximately 70% of the flow is cardiac-dependent, while the remainder depends on respiratory influence (Fogel et al., 1997). Hsia et al. reported that hepatic venous flow (measured with Doppler ultrasonography) depends on respiration in Fontan subjects more so than in normal subjects and is larger during inspiration than expiration(Hsia et al., 2001; Hsia et al., 2000). Hjortdal et al. also observed increased inferior vena cava (IVC) flow during inspiration in Fontan patients (Hjortdal et al., 2003). During inspiration, the negative intra-thoracic pressure assists the forward flow in the vena cavae and the pulmonary arteries (PAs), increasing venous return as compared to expiration. Recently, Wei et al. showed increased pulsatility in systemic return flows during free-breathing (FB) conditions compared to the BH setting. (Wei et al., 2016). These respiratory flow effects may have important implications in the evaluation of TCPC hemodynamics and require further investigation.
Recognizing this shortcoming, Marsden et al. simulated TCPC hemodynamics by including a respiratory influence on the IVC and SVC flow waveforms (Marsden et al., 2007). This was done by superimposing the patient-specific flow waveform of a cardiac cycle with the flow waveform of a respiratory cycle from Hjortdal et al. (Hjortdal et al., 2003). When compared with a steady flow model, their respiration model showed reduced energetic efficiency. While this study effectively elucidates the effect of respiration on TCPC energetics, it is not clear whether the respiratory influence is patient-specific or statistically significant for a larger population and other clinically important hemodynamic metrics. Thus, further investigation using patient-specific respiratory flow waveforms is necessary. To bridge this knowledge gap, the current study utilizes real-time phase contrast MRI (PC-MRI) patient-specific flow waveforms acquired under BH and FB conditions, which serve as boundary conditions for numerical simulations. These simulations were conducted to assess TCPC flow structure and clinically important hemodynamic metrics that are commonly involved in Fontan surgical planning including PL and HFD (de Zélicourt and Kurtcuoglu, 2016; Marsden, 2013; Wei et al., 2017). These metrics were compared between BH and FB conditions to demonstrate the impact of respiratory flow on assessing TCPC hemodynamics in Fontan surgical planning.
2. Materials and Methods
2.1. Patient Cohort
Single ventricle patients with a TCPC anatomy were selected from the Georgia Tech/Children’s Hospital of Philadelphia Fontan database. With informed consent and Institutional Review Board approval, prospective cardiovascular magnetic resonance (CMR) data at resting BH and FB conditions were acquired. Patients included in this study had: (i) a TCPC completion, and (ii) real time PC-MRI acquired at all TCPC inlets. Patients were excluded if: (i) a pacemaker or implanted metal was present, or (ii) severe CMR image artifacts distorted the images. A total of nine consecutive patients were included after two were excluded due to severe image artifacts.
2.2. CMR Acquisition
Anatomic CMR and real time PC-MRI acquisitions were performed on each patient. Static steady-state free precession imaging was acquired, and 3D anatomies were reconstructed (Frakes et al., 2003; Frakes et al., 2005) (figure illustrated in Supplementary Material 1). An echoplanar (EPI) sequence utilizing shared velocity encoding was applied to acquire real time PC-MR images (Lin et al., 2012) across the Fontan pathway (FP) at the IVC superior to the hepatic vein confluence and the superior vena cavae (SVC) as separate velocity maps for at least 10 seconds (approximately 20 frames per second). The same imaging protocol was performed under BH (acquired at end expiration) and FB resting conditions. The velocity of the diaphragm under BH conditions was more constant at end expiration than at end inspiration (Holland et al., 1998). Therefore, it was suggested to acquire MRI under end expiration (Fratz et al., 2013). This sequence has been validated in phantom models and shown to be reliable for low-velocity flows (Lin et al., 2012). Conventional PC-MR images were also acquired at the left (LPA) and right (RPA) pulmonary arteries during resting BH conditions at the end of expiration. The patient demographic and image acquisition parameters are summarized in Table 1.
Table 1.
Demographic details of the patients analyzed and summary of CMR acquisition parameters
| Patient characteristics | Range |
|---|---|
| Age (years) | 17–28 |
| Body surface area (m2) | 1.64–1.92 |
| Gender (Male/Female) | 6/3 |
| IVC connection type (IA/EC) * | 8/1 |
| Ventricular morphology (LV/RV/MV)† | 3/5/1 |
|
Transverse static steady state free precession CMR | |
| Number of slices | 45 – 70 |
| Matrix (pixel) | 256 X168 |
| Spatial resolution (mm) | 1.17 – 1.48 |
| Slice thickness (mm) | 3 – 4 |
| Echo time (ms) | 1.21 – 1.27 |
|
Real time PC-MRI at FP and SVC | |
| Encoding velocity (cm/s) | 60 – 150 |
| Number of images | 199 – 511 |
| Temporal resolution (ms) | 32 – 77 |
|
Conventional PC-MRI at LPA and RPA | |
| Encoding velocity (cm/s) | 60 – 100 |
| Number of images | 24 – 30 |
IA – Intra-atrial, EC- Extra-cardiac.
LV = left ventricle, RV = right ventricle, MV = mixed ventricle
2.3. Selection of Respiratory Cycle
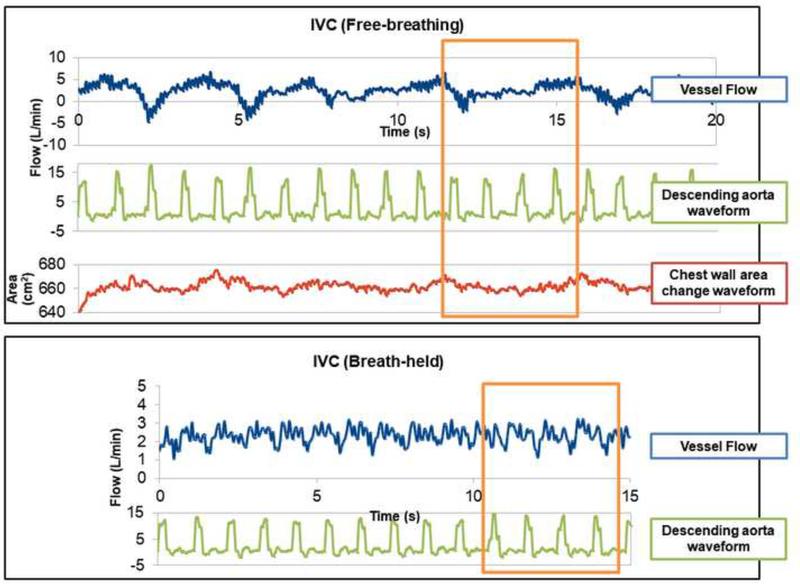
Patient-specific flow conditions were obtained by segmenting real time PC-MR images at the cross section of each vessel. The segmentation was done by using a freely available scientific package Mediviso Segment (http://medviso.com/products/segment/) (Heiberg et al., 2010). The details of the real time PC-MRI processing are described in Wei et al. (Wei et al., 2016) The change of chest wall area, tracked in the same images of vessel flows, assists in identifying the respiratory cycle and its relation with the vessel flow waveforms. It is not trivial to determine the cardiac cycle because real time PC-MRI acquisition does not contain any electrocardiograms (ECG). Therefore, this study segmented the ascending aorta and/or descending aorta that present on the same images as the SVC and FP, respectively. The aortic flow waveform is then used to define the cardiac cycle. An example of the segmented waveforms is illustrated in Figure 1. For each inlet vessel (FP and SVC) in all data sets, respiratory cycles were identified in FB conditions. An approximately the same duration with the same number of cardiac cycles under BH conditions was selected as a surrogate “respiratory cycle” under BH conditions for numerical modeling and comparison purposes. FB and BH flow waveforms of the patients included in this study were illustrated in Supplementary Material 2.
Figure 1.
Example of segmented waveforms for vessel flow, descending aorta flow, and chest wall area of Patient A under FB and BH conditions. The selected cycle for simulation is highlighted by the rectangle.
2.4. Hemodynamic Comparison
Computational fluid dynamics (CFD) was used to simulate patient specific hemodynamics. The FP and SVC waveforms were utilized as inlet boundary conditions in the CFD. The outlet flow waveforms (LPA and RPA) under FB condition were not available (due to the more notable vessel motion of the PAs during FB condition). Therefore, resistance boundary conditions based on flows obtained from conventional BH MRI were prescribed at the outlets (Peiró and Veneziani, 2009; Quarteroni et al., 2016). A similar setting was validated by an in vitro experiment(Tree et al., 2018). The finite element solver LifeV (www.lifev.org) was used (Mirabella et al., 2012). A three-element Windkessel (resistor, capacitor, and resistor) model was employed to prescribe lung resistances at the end of the LPA and RPA (Alastruey et al., 2008). Simulations were performed for each patient under pulsatile FB and BH conditions.
For all simulations, PL was computed at each time step using the following equation:
| (1) |
Indexed power loss (iPL), which represents the non-dimensional power loss through the TCPC (Dasi et al., 2009; Wei et al., 2018), was computed by normalizing time-averaged PL by flow and patient body surface area (BSA) (iPL =PL/(ρQs3/BSA2)), where Qs is the total systemic venous return and ρ is blood density = 1060 kg m-3. Pulsatile PL and iPL were computed using the pulsatile FB and BH waveforms. Non-pulsatile PL and iPL were computed using time-averaged FB and BH waveforms as boundary conditions for the CFD simulations.
Particle tracking was performed with PARAVIEW software (Kitware Inc., Clifton Park, NY, USA) to visualize the flow field. HFD was computed by seeding particles at the FP and counting the number of particles leaving through the LPA and RPA:
| (2) |
where %HFD(LPA) is the percentage of particles seeded at the FP leaving through the LPA, and nFP- LPA and nFP-RPA are the total number of particles exiting through the LPA and RPA, respectively. The difference in %HFD (LPA) between BH and FB conditions was then defined as Δ%HFD = %HFDBH-%HFDFB. Details of the numerical simulations, Windkessel model parameters and particle tracking were described in Supplementary Material 3.
2.5. Statistical Analysis
Statistical comparisons were conducted to identify differences between FB and BH conditions. Paired sample t-tests were utilized for normally distributed data, while Wilcoxon signed ranks test was used for non-normal distributions. For all statistical analysis, a p-value ≤ 0.05 is considered significant.
3. Results
3.1. Flow Field Comparison
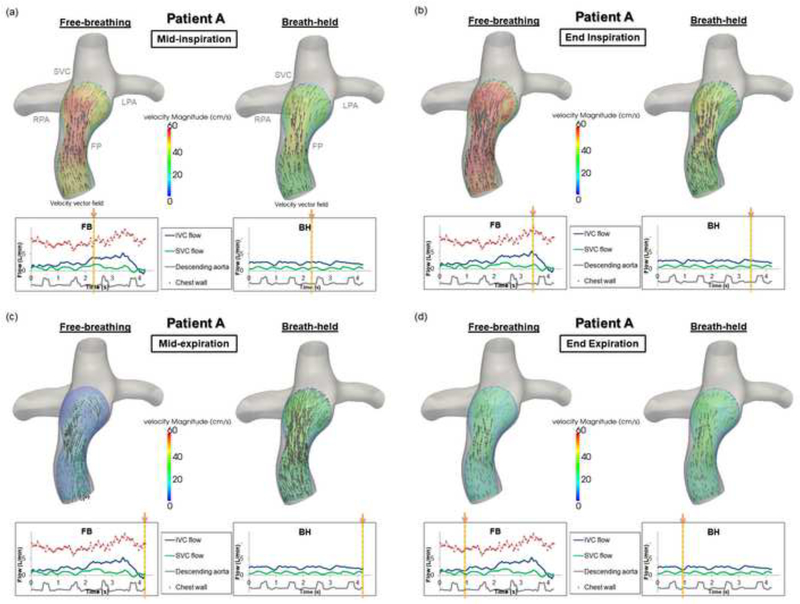
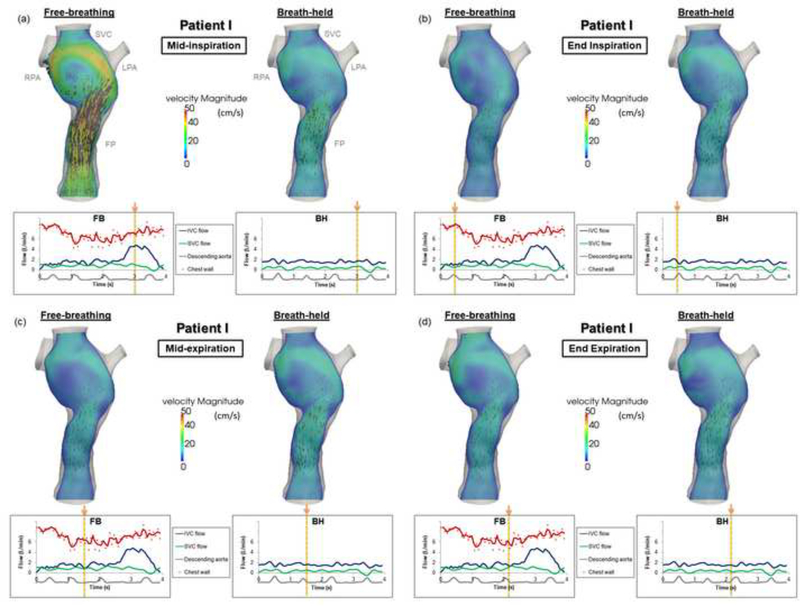
To better understand the hemodynamic differences between the TCPC flow fields under FB and BH conditions, velocity fields across a coronal plane within the TCPC were compared for each patient. Particle tracking videos were also created to visualize the instantaneous flow fields (see Supplementary Material 4-7). In general, larger variations in the TCPC flow field (velocity magnitude) within the duration of a respiratory cycle were observed qualitatively under FB conditions compared to BH conditions. In all patients, the maximum velocity magnitude was higher during inspiration under FB conditions than during the corresponding time point under BH conditions. During expiration, retrograde flow (as observed from the PC-MRI data and prescribed in the flow boundary conditions) in the FP and SVC was observed in some patients under FB conditions, while no retrograde flow was seen in the FP under BH conditions for any patient. For most patients, the FB and BH flow fields were most similar at end expiration. The following sections illustrate the flow fields for two patients as representative cases. Note that in the flow field figures, the same velocity contour scale was used for a given patient throughout the four phases (mid-inspiration, end inspiration, mid-expiration, and end expiration).
The velocity field in the FP of Patient A throughout different phases of the respiratory cycle is visualized in Figure 2. During mid-inspiration (Figure 2(a)), forward flow was noted in both conditions, while higher peak velocity magnitudes were found under the FB condition. During end-inspiration (Figure 2(b)), maximum flow and maximum velocity magnitudes were observed in the FP under the FB condition. During mid-expiration, retrograde flow existed in the FP under the FB condition, resulting in different flow fields between the FB and BH conditions (Figure 2(c)). Finally, similar velocity magnitudes and directions were observed in both the FB and BH conditions at end expiration (Figure 2(d)).
Figure 2.
Fontan pathway flow fields under free-breathing and breath-held conditions for Patient A throughout different phases of the respiratory cycle: (a) mid-inspiration, (b) end inspiration, (c) mid-expiration, (d) end expiration. (Velocity magnitude unit: cm/s)
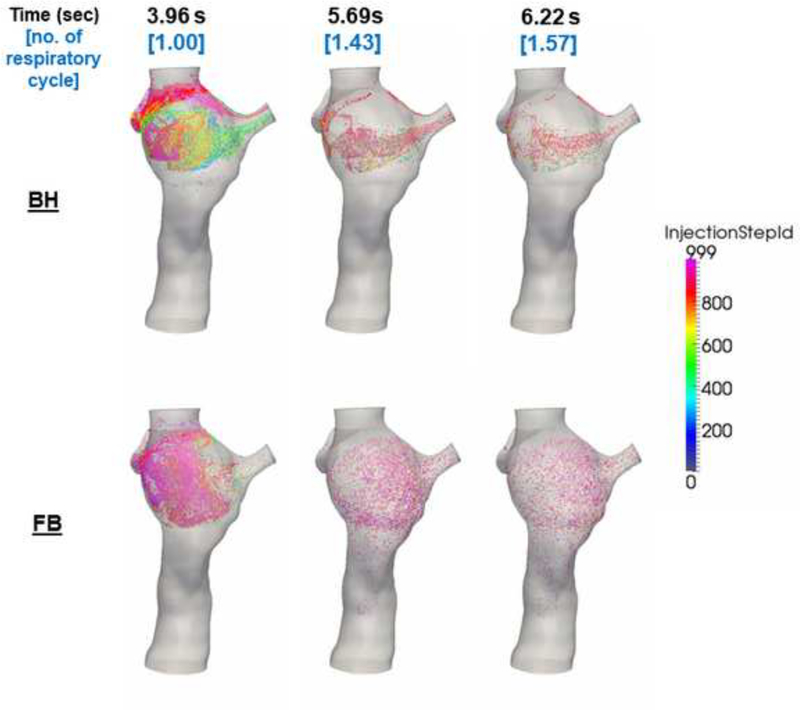
The TCPC velocity field for Patient I throughout different phases of the respiratory cycle is visualized in Figure 3(a-d). The maximum velocity magnitude of the FB condition under inspiration was higher than that of the BH condition. From the particle tracking videos of Patient I (Supplemental Materials 4 (FB) and 5 (BH)), different flow recirculation patterns were observed between the two conditions. During the FB condition, flow recirculation occurred at the inferior part of the FP. This recirculation could have been caused by higher SVC flow compared to FP flow around t = 3.84–3.97 s (as demonstrated in the flow waveforms in Figure 3). Figure 4 confirmed the cause of this flow recirculation by showing that flow particles seeded at the SVC flushed the FP. Under the BH condition however the recirculation caused by the SVC irrigation to the FP was not observed, while flow recirculation was observed at the center of the TCPC. The particle tracking videos of Patient I are shown in Supplemental Materials 6 (FB) and 7 (BH)).
Figure 3.
TCPC flow fields under free-breathing and breath-held conditions for Patient I throughout different phases of the respiratory cycle: (a) mid-inspiration, (b) end inspiration, (c) mid-expiration, (d) end expiration. (Velocity magnitude unit: cm/s).
Figure 4.
Screenshots of the particle tracking videos of Patient I with particles seeded at the SVC under FB and BH conditions. Higher Injection Step ID corresponds to particles released later in time.
3.2. Hepatic Flow Distribution
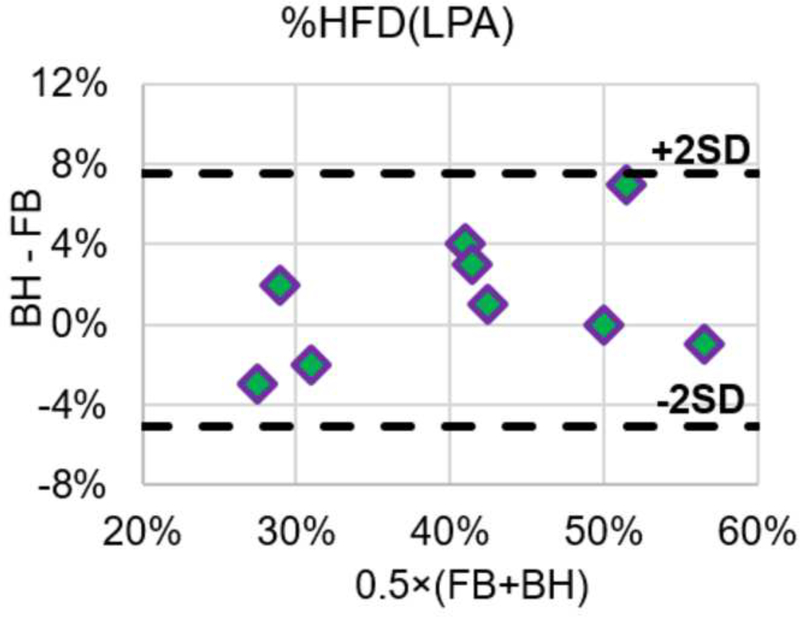
Global pulmonary flow distribution (PFD) and HFD under FB and BH conditions were computed and summarized in Table 2. Comparing the two conditions, the average difference observed in time-averaged HFD were 1%, with a range of -3% to 7%. The preference of hepatic flow to the left/right lungs is not statistically different (p = 0.28) between the FB and BH conditions. This was also reflected by the Bland–Altman plot of HFD shown in Figure 5. The “2SD” lines in indicate the 95% limits of agreement.
Table 2.
Hepatic flow distribution (HFD) under FB and BH conditions
| Patient | Age (years) | Body Surface Area (m2) | Fontan type* | %PFD(LPA) | %HFD(LPA) | |
|---|---|---|---|---|---|---|
| FB | BH | |||||
| A | 21 | 1.64 | IA | 46% | 42% | 43% |
| B | 19 | 1.74 | IA | 27% | 39% | 43% |
| C | 28 | 1.64 | IA | 25% | 29% | 26% |
| D | 26 | 1.82 | IA | 38% | 32% | 30% |
| E | 27 | 1.92 | IA | 53% | 50% | 50% |
| F | 17.2 | 1.83 | IA | 52% | 57% | 56% |
| G | 22 | 1.92 | IA | 49% | 40% | 43% |
| H | 17 | 1.8 | EC | 41% | 28% | 30% |
| I | 19 | 1.77 | IA | 31% | 48% | 55% |
| Average ± Standard Deviation | 21.8±4. 2 | 1.79±0.10 | 40±11% | 40±10% | 42±11% | |
IA – Intra-atrial, EC- Extra-cardiac.
Figure 5.
Bland-Altman comparison of %HFD(LPA) under FB and BH conditions
3.3. TCPC Power Loss
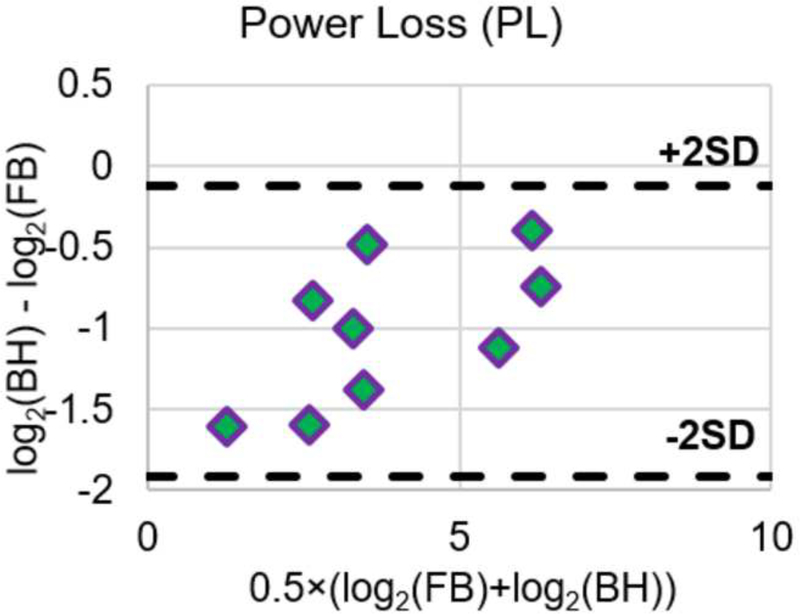
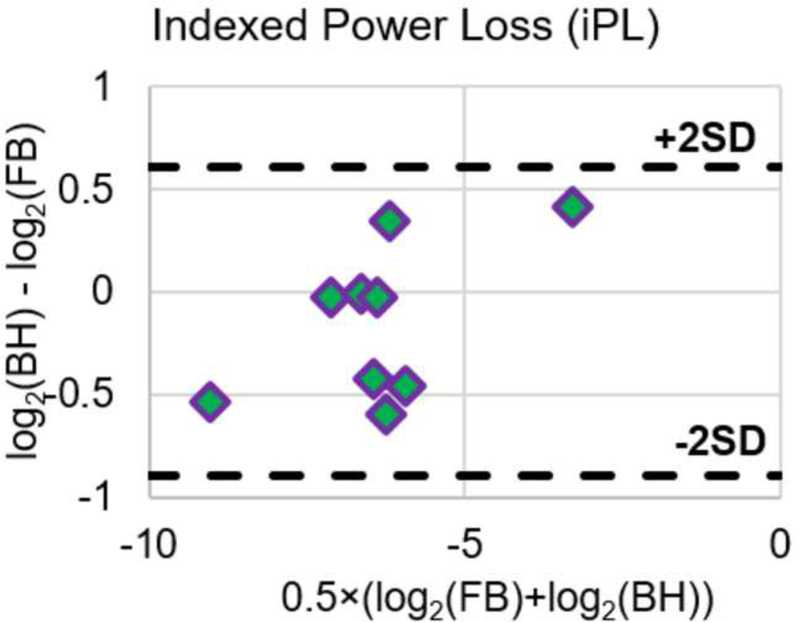
Table 3 and Table 4 tabulate PL and iPL respectively under FB and BH conditions. For each patient, power loss was the highest under the FB (pulsatile) condition. Power loss for the other conditions was found in the following descending order for all patients: FB (pulsatile), FB (non-pulsatile), BH (pulsatile), and BH (non-pulsatile). In all patients and at all conditions, pulsatile TCPC power loss was higher than non-pulsatile flow TCPC power loss. When comparing between FB and BH pulsatile iPL, the average difference in iPL was 0.002±0.011. There was no significant difference in iPL between the two conditions (p = 0.40). Figure 6 shows the Bland-Altman plots of PL and iPL, reinforcing the insignificant differences between FB and BH conditions. Since the differences of PL and iPL were not normally distributed, corresponding log scales were utilized to form the Bland-Altman plots.
Table 3.
TCPC power loss PL under FB and BH conditions
| Patient | Age (years) | Body Surface Area (m2) | Fontan type * | Pulsatile PL (mW) | Non-pulsatile PL (mW) | ||
|---|---|---|---|---|---|---|---|
| FB | BH | FB | BH | ||||
| A | 21 | 1.64 | IA | 8.43 | 4.75 | 5.31 | 4.62 |
| B | 19 | 1.74 | IA | 13.63 | 9.77 | 11.84 | 9.05 |
| C | 28 | 1.64 | IA | 72.61 | 33.37 | 57.75 | 32.38 |
| D | 26 | 1.82 | IA | 10.43 | 3.45 | 6.28 | 3.1 |
| E | 27 | 1.92 | IA | 14.01 | 6.99 | 10.58 | 6.02 |
| F | 17.2 | 1.83 | IA | 102.8 | 61.24 | 100.79 | 60.5 |
| G | 22 | 1.92 | IA | 17.75 | 6.8 | 11.42 | 6.29 |
| H | 17 | 1.8 | EC | 81.86 | 62.11 | 63 | 60.2 |
| I | 19 | 1.77 | IA | 4.25 | 1.39 | 2.9 | 1.33 |
| Average ± Standard Deviation | 21.8±4.2 | 1.79±0.10 | 36.19±38.15 | 21.10±24.86 | 29.99±35.05 | 20.39±24.45 | |
IA – Intra-atrial, EC- Extra-cardiac.
Table 4.
TCPC power loss iPL under FB and BH conditions
| Patient | Age (years) | Body Surface Area (m2) | Fontan type * | Pulsatile iPL | Non-pulsatile iPL | ||
|---|---|---|---|---|---|---|---|
| FB | BH | FB | BH | ||||
| A | 21 | 1.64 | IA | 0.0163 | 0.0108 | 0.0103 | 0.0105 |
| B | 19 | 1.74 | IA | 0.0073 | 0.0071 | 0.0063 | 0.0066 |
| C | 28 | 1.64 | IA | 0.0885 | 0.1181 | 0.0704 | 0.1146 |
| D | 26 | 1.82 | IA | 0.0023 | 0.0016 | 0.0014 | 0.0014 |
| E | 27 | 1.92 | IA | 0.0133 | 0.0099 | 0.0101 | 0.0085 |
| F | 17.2 | 1.83 | IA | 0.0121 | 0.0154 | 0.0119 | 0.0152 |
| G | 22 | 1.92 | IA | 0.0193 | 0.0141 | 0.0124 | 0.0130 |
| H | 17 | 1.8 | EC | 0.0101 | 0.0101 | 0.0078 | 0.0098 |
| I | 19 | 1.77 | IA | 0.0121 | 0.0119 | 0.0083 | 0.0114 |
| Average ± Standard Deviation | 21.8±4.2 | 1.79±0.10 | 0.0201±0.0261 | 0.0212±0.0362 | 0.0154±0.0209 | 0.0221±0.0352 | |
IA – Intra-atrial, EC- Extra-cardiac.
Figure 6.
Bland-Altman plots of PL and iPL under FB and BH conditions
4. Discussion
Image-based surgical planning of the Fontan procedure has emerged in the past few decades to provide surgeons additional insights to the possible hemodynamic outcomes of a given surgical option. Patient specific hemodynamics, power loss, and hepatic flow distribution are common metrics used to evaluate the performance of patients’ current Fontan connection (Trusty et al., 2016) or that of potential surgical options (Sundareswaran et al., 2009). However, these metrics are often evaluated using flow waveforms acquired under breath-held conditions. Wei et al. concluded that respiration significantly affects the properties of TCPC flow waveforms, e.g. pulsatilities, but not time-averaged venous flow rates (Wei et al., 2016). The effect of respiration on flow waveforms has the potential to influence the simulated TCPC hemodynamic metrics (Khiabani et al., 2012; Wei et al., 2017), which are important to Fontan surgical planning. This current work serves as an extension of Wei et al. (Wei et al., 2016) to investigate how the respiratory flow waveform influences simulated TCPC hemodynamics.
In this study, the patient-specific effect of respiration on flow waveforms was evaluated with the use of real time PC-MRI data acquired under FB and BH conditions. The flow waveforms under BH conditions were driven by cardiac pulsation, while those under FB conditions were driven by both cardiac pulsation and respiration. Therefore, comparison between FB and BH conditions could isolate the effect of respiration-driven flow waveform on TCPC hemodynamics. CFD simulations utilizing patient-specific flow waveforms under FB and BH conditions demonstrated differences in the TCPC flow field between these conditions. As observed in the velocity fields of the CFD results, during mid-inspiration and end inspiration under the FB condition, higher flow rates through the TCPC resulted in increased peak velocity magnitude within the TCPC. This finding agrees with previous studies that showed increased IVC flow during inspiration in Fontan patients (Hjortdal et al., 2003). During inspiration, the negative intra-thoracic pressure in the chest cavity assists the forward flow in the TCPC, increasing venous return. During mid-expiration and end expiration, the velocity magnitude and direction of velocity vectors show more similarity between the two conditions. This resemblance is expected since the BH data were acquired during end-expiration, and the caval flow rates were of similar magnitude in the two conditions.
In addition to comparisons of instantaneous flow fields, the impact of respiratory flow was also explored for clinically important hemodynamic metrics including HFD and iPL. Statistical analysis demonstrates no significant difference in neither HFD nor iPL between FB and BH conditions. Moreover, Bland-Altman plots conclude the agreement between FB and BH conditions in assessing TCPC hemodynamic metrics.
Even though instantaneous flow structures are different between FB and BH conditions, the time-averaged hemodynamic metrics used in Fontan surgical planning, HFD and iPL, are not statistically significantly different between the two conditions. The major flow structure differences between FB and BH conditions are observed during mid-inspiration, which FB condition have higher velocity magnitudes; however the velocity directions are in general consistent between the two conditions during mid-inspiration. In addition, the presence of retrograde flow in the vena cava may differ between the FB and BH conditions during expiration (e.g. patient A). However, these differences did not have a major impact on the resulting time-averaged HFD and iPL. In most patients, the flow mixing patterns between FP and SVC were similar between FB and BH conditions. Different FP-SVC flow mixing patterns were observed in Patient I, but the resulting HFD only differs by 7% and iPL only differs by 0.0002 between the two conditions. This suggests the difference in FB and BH flow waveforms contributes to differences in TCPC flow structures and also instantaneous HFD and iPL values, but has only a minor impact on the resulting time-averaged HFD and iPL.
Time-averaged HFD and iPL are important clinical metrics evaluated in Fontan surgical planning. Impact of pulsatile flow waveforms in Fontan patients has been investigated previously within a cardiac cycle (Dur et al., 2010; Dur et al., 2012), but not for respiratory cycles. Even though differences in iPL were observed between pulsatile and non-pulsatile conditions for both FB and BH conditions, there were no significant difference between pulsatile iPL between FB and BH conditions. The findings from the current study suggest that, in general, the routine use of BH conditions in Fontan surgical planning is acceptable. This is important, not only because fewer image artifacts exist in MRI under BH conditions (Wei et al., 2016), but also because numerical simulations with BH flow waveforms require less computational time (Wei et al., 2017). This is particularly important in image-based surgical planning of Fontan surgery, when simulations of multiple surgical options have to be completed in a short time frame.
5. Limitations
The major limitations of this study are due to the assumptions made in the computational model. The first limitation refers to the outlet boundary conditions. We approximated the downstream circulation with a Windkessel model, and the parameters were empirically tuned to the available patient-specific data. Even though this approach gives a reliable representation of the effects of the peripheral vasculature, the assumptions made may introduce some inaccuracies. Second, this study focuses on investigating the effect of respiratory flow on evaluating TCPC hemodynamics. In order to isolate this effect, all CFD simulations adopt rigid vessel wall assumptions. A previous study suggested that wall compliance has little impact on time-averaged HFD and energy efficiency (Long et al., 2012). Future study should investigate whether this holds under the influence of change in intrathoracic pressure under FB condition. Third, the respiratory cycle in this work was identified by tracing the change in chest wall area from a transverse CMR image. Note that chest wall motion, in reality, is 3-dimensional. iPL was used as a major hemodynamic metric, given its relevance to Fontan surgery planning. However, this metric was original formulated for time-averaged flow. Future work shall address the pulsatile contribution of power loss to iPL. In addition, a uniform spatial distribution was used to seed particles at the FP plane for HFD quantification. This method does not account for the spatial velocity profile at the FP and therefore may be less accurate than using an appropriately distributed particle flux. Nevertheless, all these limitations should not affect the comparison of FB and BH conditions significantly. Finally, while the current study only included nine patients (mainly intra-atrial and adult patients) due to data availability, it serves as the first study to investigate the effect of BH MRI acquisition on TCPC hemodynamic metrics using patient-specific FB waveforms acquired via real-time MRI. Future work should extend this investigation to include extra-cardiac and also younger patients. It would also be worthwhile to explore the potentially difference between intra-atrial and extra-cardiac patients and how respiration effects would be different in the two templates.
6. Conclusions
This study demonstrated the effects of respiration-driven flow waveforms in the evaluation of TCPC hemodynamics. The use of BH acquired flow waveforms appears to have negligible effects on both HFD and iPL, but does affect the TCPC’s instantaneous flow fields. These findings support that the routine use of BH MRI acquisition to obtain flow waveforms for Fontan surgical planning is acceptable when evaluating HFD and iPL. Therefore, BH MRI acquisition may continue to serve as the favorable scanning protocol with the advantage of minimizing image artifacts due to respiratory motion while still offering accurate surgical planning metrics.
Supplementary Material
Supplemental Material 1. Figure illustrating the reconstructed anatomies of the patients investigated. All patients are intra-atrial patients except Patient H
Supplemental Material 2. Patient specific inlet flow waveforms that were used as boundary conditions of simulations
Supplemental Material 3. Details of CFD Simulation Setup
Supplemental Material 4. Particle Tracking Video of Patient I under FB condition. Particles were seeded at the FP and SVC for one respiratory cycle and colored by velocity magnitude.
Supplemental Material 5. Particle Tracking Video of Patient I under BH condition. Particles were seeded at the FP and SVC for one respiratory cycle and colored by velocity magnitude
Supplemental Material 6. Particle Tracking Video of Patient I under FB condition. Particles were released only at the SVC for one respiratory cycle and are colored by their release time step
Supplemental Material 7. Particle Tracking Video of Patient I under BH condition. Particles were released only at the SVC for one respiratory cycle and are colored by their release time step
Acknowledgement
The authors acknowledge Veronica O'Connor and Ravi Doddasomayajula from The Children’s Hospital of Philadelphia for assistance with patient data collection; Alex Shao from Georgia Institute of Technology for assistance with data processing; Huijuan Xu from Georgia Institute of Technology for assistance with the CFD solver; Prem Midha from Georgia Institute of Technology for assistance with video processing; and Connor Huddleston from Georgia Institute of Technology for proofreading.
Funding Sources: National Heart, Lung, and Blood Institute HL67622, HL089647 and HL098252. American Heart Association Predoctoral Fellowship 17PRE33630117.
Footnotes
Conflict of Interest
No benefits in any form have been or will be received from a commercial party related directly or indirectly to the subject of this manuscript.
Publisher's Disclaimer: This is a PDF file of an unedited manuscript that has been accepted for publication. As a service to our customers we are providing this early version of the manuscript. The manuscript will undergo copyediting, typesetting, and review of the resulting proof before it is published in its final citable form. Please note that during the production process errors may be discovered which could affect the content, and all legal disclaimers that apply to the journal pertain.
References
- 1.Alastruey J, Parker K, Peiró J, Sherwin S, 2008. Lumped parameter outflow models for 1D blood flow simulations: effect on pulse waves and parameter estimation. Comput. Phys. Commun 4, 317–336. [Google Scholar]
- 2.Corsini C, Baker C, Baretta A, Biglino G, Hlavacek AM, Hsia T-Y, Kung E, Marsden A, Migliavacca F, Vignon-Clementel I, Pennati G, 2015. Integration of Clinical Data Collected at Different Times for Virtual Surgery in Single Ventricle Patients: A Case Study. Annals of Biomedical Engineering 43, 1310–1320. [DOI] [PubMed] [Google Scholar]
- 3.Dasi LP, Pekkan K, de Zelicourt D, Sundareswaran KS, KrishnankuttyRema R, Del Nido P, Yoganathan AP, 2009. Hemodynamic Energy Dissipation in the Cardiovascular System: Generalized Theoretical Analysis on Disease States. Ann Biomed Eng 37, 661–673. [DOI] [PMC free article] [PubMed] [Google Scholar]
- 4.de Zélicourt DA, Kurtcuoglu V, 2016. Patient-Specific Surgical Planning, Where Do We Stand? The Example of the Fontan Procedure. Annals of Biomedical Engineering 44, 174–186. [DOI] [PubMed] [Google Scholar]
- 5.Dur O, DeGroff CG, Keller BB, Pekkan K, 2010. Optimization of Inflow Waveform Phase -Difference for Minimized Total Cavopulmonary Power Loss. J Biomech Eng-T Asme 132. [DOI] [PubMed] [Google Scholar]
- 6.Dur O, Kocyildirim E, Soran O, Wearden PD, Morell VO, DeGroff CG, Pekkan K, 2012. Pulsatile venous waveform quality affects the conduit performance in functional and "failing" Fontan circulations. Cardiology in the Young 22, 251–262. [DOI] [PubMed] [Google Scholar]
- 7.Fogel MA, Weinberg PM, Hoydu A, Hubbard A, Rychik J, Jacobs M, Fellows KE, Haselgrove J, 1997. The Nature of flow in the systemc venous pathway measured by magnetic resonance blood tagging in patients having the Fontan operation. J Thorac Cardiovasc Surg 114, 1032–1041. [DOI] [PubMed] [Google Scholar]
- 8.Frakes DH, Conrad CP, Healy TM, Monaco JW, Fogel M, Sharma S, Smith MJ, Yoganathan AP, 2003. Application of an adaptive control grid interpolation technique to morphological vascular reconstruction. IEEE Trans Biomed Eng 50, 197–206. [DOI] [PubMed] [Google Scholar]
- 9.Frakes DH, Smith MJ, Parks J, Sharma S, Fogel M, Yoganathan AP, 2005. New techniques for the reconstruction of complex vascular anatomies from MRI images. J Cardiovasc Magn Reson 7, 425–432. [DOI] [PubMed] [Google Scholar]
- 10.Fratz S, Chung T, Greil GF, Samyn MM, Taylor AM, Buechel ERV, Yoo SJ, Powell AJ, 2013. Guidelines and protocols for cardiovascular magnetic resonance in children and adults with congenital heart disease: SCMR expert consensus group on congenital heart disease. Journal of Cardiovascular Magnetic Resonance 15. [DOI] [PMC free article] [PubMed] [Google Scholar]
- 11.Heiberg E, Sjögren J, Ugander M, Carlsson M, Engblom H, Arheden H, 2010. Design and validation of Segment - freely available software for cardiovascular image analysis. BMC Med Imaging 10. [DOI] [PMC free article] [PubMed] [Google Scholar]
- 12.Hjortdal VE, Emmertsen K, Stenbog E, Frund T, Schmidt MR, Kromann O, Sorensen K, Pedersen EM, 2003. Effects of exercise and respiration on blood flow in total cavopulmonary connection: a real-time magnetic resonance flow study. Circulation 108, 1227–1231. [DOI] [PubMed] [Google Scholar]
- 13.Holland AE, Goldfarb JW, Edelman RR, 1998. Diaphragmatic and cardiac motion during suspended breathing: preliminary experience and implications for breath-hold MR imaging. Radiology 209, 483–489. [DOI] [PubMed] [Google Scholar]
- 14.Hsia TY, Khambadkone S, Deanfield JE, Taylor JF, Migliavacca F, De Leval MR, 2001. Subdiaphragmatic venous hemodynamics in the Fontan circulation. J Thorac Cardiovasc Surg 121, 436–447. [DOI] [PubMed] [Google Scholar]
- 15.Hsia TY, Khambadkone S, Redington AN, Migliavacca F, Deanfield JE, Leval M.R.d., 2000. Effects of respiration and gravity on infradiaphragmatic venous flow in normal and Fontan patients. Circulation 102, 148–153. [DOI] [PubMed] [Google Scholar]
- 16.Khiabani R, Restrepo MR, Tang E, de Zelicourt D, Sotiropoulos F, Fogel MA, Yoganathan AP, 2012. Effect of flow pulsatility on modeling the hemodynamics in the total cavopulmonary connection. J Biomech 45, 2376–2381. [DOI] [PMC free article] [PubMed] [Google Scholar]
- 17.Khiabani R, Whitehead K, Han D, Restrepo M, Tang E, Bethel J, Paridon S, Fogel M, Yoganathan A, 2015. Exercise capacity in single-ventricle patients after Fontan correlates with haemodynamic energy loss in TCPC. Heart 101, 139–143. [DOI] [PubMed] [Google Scholar]
- 18.Lin HY, Bender JA, Ding Y, Chung YC, Hinton AM, Pennell ML, Whitehead KK, Raman SV, Simonetti OP, 2012. Shared velocity encoding: A method to improve the temporal resolution of phasecontrast velocity measurements. Magn Reson Med 68, 703–710. [DOI] [PMC free article] [PubMed] [Google Scholar]
- 19.Long CC, Hsu M.C.C.M.c., Bazilevs Y, Feinstein JA, Marsden AL, 2012. Fluid – structure interaction simulations of the Fontan procedure using variable wall properties. International Journal for Numerical Methods in Biomedical Engineering 28, 513–527. [DOI] [PubMed] [Google Scholar]
- 20.Marsden AL, 2013. Simulation based planning of surgical interventions in pediatric cardiology. Phys Fluids 25. [DOI] [PMC free article] [PubMed] [Google Scholar]
- 21.Marsden AL, Vignon-Clementel IE, Chan FP, Feinstein JA, Taylor CA, 2007. Effects of exercise and respiration on hemodynamic efficiency in CFD simulations of the total cavopulmonary connection. Ann Biomed Eng 35, 250–263. [DOI] [PubMed] [Google Scholar]
- 22.Mirabella L, Haggerty CM, Passerini T, Piccinelli M, Powell AJ, Nido PJD, Veneziani A, Yoganathan AP, 2012. Treatment planning for a TCPC test case: A numerical investigation under rigid and moving wall assumptions. Int J Numer Method Biomed Eng 29, 197–216. [DOI] [PubMed] [Google Scholar]
- 23.Peiró J, Veneziani A, 2009. Reduced models of the cardiovascular system, Cardiovascular Mathematics. Springer; Italy, pp. 347–394. [Google Scholar]
- 24.Pike NA, Vricella LA, Feinstein JA, Black MD, Reitz BA, 2004. Regression of severe pulmonary arteriovenous malformations after Fontan revision and "hepatic factor" rerouting. Ann Thorac Surg 78, 697–699. [DOI] [PubMed] [Google Scholar]
- 25.Quarteroni A, Veneziani A, Vergara C, 2016. Geometric multiscale modeling of the cardiovascular system, between theory and practice. Comput.Methods in Appl.Mech.Eng 302, 193–252. [Google Scholar]
- 26.Sundareswaran KS, de Zelicourt D, Sharma S, Kanter KR, Spray TL, Rossignac J, Sotiropoulos F, Fogel MA, Yoganathan AP, 2009. Correction of pulmonary arteriovenous malformation using imagebased surgical planning. JACC Cardiovasc Imaging 2, 1024–1030. [DOI] [PMC free article] [PubMed] [Google Scholar]
- 27.Tang E, Wei ZA, Whitehead KK, Khiabani RH, Restrepo M, Mirabella L, Bethel J, Paridon SM, Marino BS, Fogel MA, Yoganathan AP, 2017. Effect of Fontan geometry on exercise haemodynamics and its potential implications. Heart. [DOI] [PubMed] [Google Scholar]
- 28.Tree M, Wei ZA, Trusty PM, Raghav V, Fogel M, Maher K, Yoganathan A, 2018. Using a Novel In Vitro Fontan Model and Condition-Specific Real-Time MRI Data to Examine Hemodynamic Effects of Respiration and Exercise. Ann Biomed Eng 46, 135–147. [DOI] [PMC free article] [PubMed] [Google Scholar]
- 29.Trusty PM, Restrepo M, Kanter KR, Yoganathan AP, Fogel MA, Slesnick TC, 2016. A pulsatile hemodynamic evaluation of the commercially available bifurcated Y-graft Fontan modification and comparison with the lateral tunnel and extracardiac conduits. J Thorac Cardiov Sur 151, 1529–1536. [DOI] [PubMed] [Google Scholar]
- 30.Trusty PM, Slesnick TC, Wei ZA, Rossignac J, Kanter KR, Fogel MA, Yoganathan AP, 2018. Fontan Surgical Planning: Previous Accomplishments, Current Challenges, and Future Directions. J Cardiovasc Transl Res 11, 133–144. [DOI] [PMC free article] [PubMed] [Google Scholar]
- 31.Wei Z, Whitehead KK, Khiabani RH, Tree M, Tang E, Paridon SM, Fogel MA, Yoganathan AP, 2016. Respiratory Effects on Fontan Circulation during Rest and Exercise Utilizing Real Time Cardiac Magnetic Resonance Imaging. Ann Thorac Surg 101, 1818–1826. [DOI] [PMC free article] [PubMed] [Google Scholar]
- 32.Wei ZA, Tree M, Trusty PM, Wu W, Singh-Gryzbon S, Yoganathan A, 2018. The Advantages of Viscous Dissipation Rate over Simplified Power Loss as a Fontan Hemodynamic Metric. Ann Biomed Eng 46, 404–416. [DOI] [PMC free article] [PubMed] [Google Scholar]
- 33.Wei ZA, Trusty PM, Tree M, Haggerty CM, Tang E, Fogel M, Yoganathan AP, 2017. Can time-averaged flow boundary conditions be used to meet the clinical timeline for Fontan surgical planning? J Biomech 50, 172–179. [DOI] [PMC free article] [PubMed] [Google Scholar]
- 34.Whitehead KK, Pekkan K, Kitajima HD, Paridon SM, Yoganathan AP, Fogel MA, 2007. Nonlinear power loss during exercise in single-ventricle patients after the Fontan: insights from computational fluid dynamics. Circulation 116, I165–171. [DOI] [PubMed] [Google Scholar]
Associated Data
This section collects any data citations, data availability statements, or supplementary materials included in this article.
Supplementary Materials
Supplemental Material 1. Figure illustrating the reconstructed anatomies of the patients investigated. All patients are intra-atrial patients except Patient H
Supplemental Material 2. Patient specific inlet flow waveforms that were used as boundary conditions of simulations
Supplemental Material 3. Details of CFD Simulation Setup
Supplemental Material 4. Particle Tracking Video of Patient I under FB condition. Particles were seeded at the FP and SVC for one respiratory cycle and colored by velocity magnitude.
Supplemental Material 5. Particle Tracking Video of Patient I under BH condition. Particles were seeded at the FP and SVC for one respiratory cycle and colored by velocity magnitude
Supplemental Material 6. Particle Tracking Video of Patient I under FB condition. Particles were released only at the SVC for one respiratory cycle and are colored by their release time step
Supplemental Material 7. Particle Tracking Video of Patient I under BH condition. Particles were released only at the SVC for one respiratory cycle and are colored by their release time step


