Abstract
Chemically simplified lipid mixtures are used here as models of the cell plasma membrane exoplasmic leaflet. In such models, phase separation and morphology transitions controlled by line tension in the liquid-disordered (Ld) + liquid-ordered (Lo) coexistence regime have been described [1]. Here, we study two four-component lipid mixtures at different cholesterol fractions: brain sphingomyelin (BSM) or 1,2-distearoyl-sn-glycero-3-phosphocholine (DSPC)/1,2-dioleoyl-sn-glycero-3-phosphocholine (DOPC)/1-palmitoyl-2-oleoyl-sn-glycero-3-phosphocholine (POPC)/cholesterol (Chol). On giant unilamellar vesicles (GUVs) display a nanoscopic-to-macroscopic transition of Ld + Lo phase domains as POPC is replaced by DOPC, and this transition also depends on the cholesterol fraction. Line tension decreases with increasing cholesterol mole fractions in both lipid mixtures. For the ternary BSM/DOPC/Chol mixture, the published phase diagram [19] requires a modification to show that when cholesterol mole fraction is > ~ 0.33, coexisting phase domains become nanoscopic.
Keywords: Lipid domain, Liquid disordered phase, Liquid ordered phase, Giant unilamellar vesicle, Line tension
1. Introduction
Separated liquid phase domains in the plasma membrane exoplasmic leaflet could play important roles in cellular membrane functions. A type of domain in cells termed a “raft” contributes to protein sorting, membrane trafficking, signal transduction, and viral infection [2, 3]. How does the cell control formation of lipid rafts? What is the role of cholesterol in the lateral segregation of the lipid bilayer? Finding the answers to these questions will help us realize how the cell regulates lateral compartmentalization for specific physiological responses happening through the cell membrane.
The outer or exoplasmic membrane leaflet in mammalian cells largely consists of sphingomyelin (SM), phosphatidylcholine (PC), and cholesterol (Chol). The inner or cytoplasmic leaflet is mainly composed of phosphatidylethanolamine (PE), phosphatidylserine (PS), and Chol. The plasma membrane has a total of ~35–45% Chol, but it remains unknown how Chol is distributed between exoplasmic and cytoplasmic leaflets, and for this reason we study a range of Chol concentrations. Natural SM has a mixture of hydrocarbon chains with the amide-linked chain ranging in length from 16 to 24 carbons, creating a length difference between the two chains [4]. Sphingolipids typically have higher melting temperatures (Tm) than phospholipids, which is crucial to create the liquid-ordered (Lo) phase, used as a model for the membrane raft. Although 18:0,18:0-phosphatidylcholine (DSPC) is negligible in natural plasma membranes, this high melting temperature phospholipid has proven to be useful in model membranes because it is both stable and chemically well-defined [5–7].
Lipid bilayer mixtures of the type, (high Tm phospholipid)/(low Tm phospholipids)/Chol have rich phase behavior that can be used to model the behavior of natural membranes. Liquid-liquid phase separation can occur on the exoplasmic leaflet of the lipid bilayer. Heterogeneity of acyl lengths, unsaturation, headgroup types, melting points, and Chol fraction all influence this phase separation [8]. Equilibrium isothermal phase diagrams locate phase regions as a function of lipid composition, and can provide useful models of the cell membrane [9]. Two types of phase diagrams, which have been termed Type I and Type II, describe the exoplasmic models. Type I phase diagrams have two regions of macroscopic two-phase coexistence: Ld + gel phase (Lβ) at lower Chol fractions, and crystals of Chol monohydrate + Lo phase at higher Chol fractions. Type II phase diagrams have four macroscopic regions of phase coexistence: In addition to the same two-phase regions observed in the Type I diagrams, there is two-phase Ld + Lo and three-phase Ld + Lo + Lβ coexistence. A principle that connects Type I and Type II behaviors is the line tension between coexisting Ld and Lo phases [1]. High line tension creates an energy penalty that is minimized by large, visible “macroscopic” Ld and Lo phase domains, whereas a lower energy penalty at the Ld/Lo interface can give rise to numerous small domains with a size scale of tens of nanometers.
Ld + Lo coexistence with simplified lipid mixtures receives the most attention as a model for the exoplasmic leaflet of mammalian cell plasma membrane behavior. Nanoscopic Ld + Lo domains can be detected using techniques sensitive to small length scales, such as fluorescence resonance energy transfer (FRET) [10], electron spin resonance (ESR) [11], and small angle neutron scattering (SANS) [12]. FRET and ESR have detected nanodomains that possess Ld or Lo characteristics of order and probe partitioning, indicating that liquid-liquid phase separation could occur at the nanoscopic scale in cells [10, 11]. Nanoscale lipid rafts enriched in long-chain saturated sphingolipids and Chol might be induced when needed to form platforms for biological reactions on the cell membrane [3].
Line tension at the Ld/Lo phase boundary controls the domain size transition from nanometers to microns [13]. This line tension tends to drive phase domains toward the minimum perimeter– a single round domain within a matrix of the other phase. This simple morphology can be regulated when a long-range repulsive interaction competes with the free energy cost of forming domain interface [14]. The first clear visual observation of macroscopic Ld + Lo phase separation was reported using fluorescence microscopy imaging of giant unilamellar vesicles (GUVs) [15]. This microscopy method has proved to be a valuable tool for studying lipid model membranes. Note that DOPC, which gives rise to high line tensions, has been employed for the specific purpose of creating macroscopic Ld + Lo phase separation in model mixtures, whereas POPC gives rise to low line tension and Ld + Lo nanodomains. Interesting phase morphologies occur during the transition between nanoscopic and macroscopic mixtures [5].
Our purpose is to measure line tension in these high Chol mixtures in order to better understand line tension in the high-cholesterol fraction lipid mixtures of the mammalian plasma membrane. Line tension can not be measured for the nanodomains with POPC, but can be measured as POPC is replaced by DOPC. Four-component lipid membrane models show that lipid composition can control the nano-to-macro transition of domain morphology [1, 5]. The phase separation and morphological transition controlled by Ld/Lo line tension have been demonstrated in our previous study, but at a non-physiologically low Chol fraction of 0.2 [1]. Here, we investigate the effects of higher Chol content in the lipid bilayer on line tension and Ld + Lo morphology of GUVs composed of four-component lipid mixtures. We find that increased Chol fraction reduces line tension, and in the case of BSM/DOPC/Chol, at Chol fractions > ~ 0.17 in the Ld phase or > ~ 0.39 in the Lo phase, all Ld + Lo domains become nanoscopic. An earlier study from the Baumgart group also found that increased Chol fraction resulted in decreased line tension, with the important difference that egg sphingomyelin, which yields much higher line tension, was used, thus no nanodomains were formed [13]. In contrast, the lipid mixtures described here were chosen to form nanodomains as models for natural cell membranes that also form Ld + Lo nanodomains. Based on published data, we expected that higher Chol fractions in these mixtures would result in lower line tension as the critical point is approached. Here we show quantitatively that higher Chol fraction can cause a transition from macroscopic to nanoscopic phase domains.
2. Materials and methods
2.1. Materials
Phospholipids, including porcine brain sphingomyelin (BSM) were purchased from Avanti Polar Lipids (Alabaster, AL). Purity of phospholipids was determined to be higher than 99.5% using thin layer chromatography (TLC). Briefly, about 20 μg of lipid was spotted on washed and activated Adsorbosil TLC plates (Alltech, Deerfield, IL) and developed in the solvent system chloroform/methanol/water = 65/25/4 volume fraction. Phospholipid concentrations were measured using an inorganic phosphate assay [16], with an error <1% from 10 replicates. Chol was purchased from Nu Chek Prep, Inc. (Elysian, MN), and stock solutions were prepared at defined concentrations using standard gravimetric procedures. The fluorescent dye, 1,1′-didodecyl-3,3,3′,3′- tetramethylindocarbocyanine perchlorate (C12:0 DiI) was purchased from Invitrogen (Carlsbad, CA). The concentration of C12:0 DiI was measured using absorption spectroscopy with extinction coefficient of 143,000 M−1cm−1.
2.2. GUV preparation
GUVs were prepared by electroformation [17] with modifications. Each sample contained 300 nmol of lipid mixture dissolved in 200 μL chloroform. A detailed procedure was described in a previous study [1]. In brief, the lipid films were swelled in 100 mM sucrose solution at 55 °C for 2 h in an AC field with frequency of 5 Hz and amplitude of 1 V using a Wavetek FG2C function generator (Meterman, Everett, WA), then cooled to 23 °C over 12 h using a Digi-sense temperature controller R/S (Cole Palmer, Vernon Hills, IL). GUVs containing 100 mM sucrose were harvested into 100 mM glucose and allowed to settle for at least 2 h before microscope visualization. To keep the harvested GUVs intact, a difference of osmolality of less than 5 mOsmol/kg H2O between the sucrose and glucose solutions was ensured using an osmometer (Model 5004, Precision Systems, Inc., Natick, MA).
2.3. Phase morphology determination
GUVs were observed at 23 °C using an inverted Nikon Eclipse Ti-E microscope (Nikon Instruments, Melville, NY) with a 60× 1.2 NA water immersion objective. Sample chambers for GUV loading and observation were assembled with a no. 1.5 coverslip, traditional microscopy slide, and a silicone spacer (0.25 mm thickness, Sigma-Aldrich, St. Louis, MO) inserted between the coverslip and slide. ~ 3 μl GUV suspension was added to the chamber and allowed to settle for at least 5 minutes prior to observation. Fields of view were selected with brightfield visualization followed by fluorescence illumination of C12:0 DiI, which favorably partitions into the Ld phase. We used this probe at 0.02 mol% of total lipid in the sample to minimize light-induced artifacts in phase morphology determination [5, 18]. The artifact that creates uniform GUVs caused by fission of Ld and Lo phases among the BSM-containing GUVs, as previously reported [18], was not observed in our lipid models at higher Chol mole fractions of 0.36 and 0.38 (Figure S7 in Supplementary Material). GUV images were taken with a Zyla 5.5 sCMOS camera (Andor Technology Ltd., Belfast, UK). For each field containing isolated GUVs appearing to be free of multilamellar or tethered vesicles, 3 to 5 images were obtained of the GUV surface distant from the coverslip in order to describe the phase morphologies.
In a four-component lipid mixture containing one high Tm lipid, two low Tm lipids, and Chol, a substitution ratio termed ρ is used to describe the lipid composition for the phase morphology transition from nanoscopic to modulated to macroscopic domains on GUVs, defined as,
| (1) |
where DOPC is a low Tm lipid inducing macrodomains and POPC is a low Tm lipid inducing nanodomains.
At different ρ values of a four-component lipid mixture, the numbers of GUVs with uniform, modulated, and macroscopic patterns were counted. The GUV surface appearing uniform, but known by other methods to have coexisting Ld and Lo phases in nanoscale [6, 19, 20], was scored as having nanoscopic domains. The thin stripes, honeycomb, stripe-like patterns, and nonrounded small domains on GUVs at intermediate ρ values were counted as having modulated domains. Visible round domains on GUVs were counted as macroscopic.
2.4. Line tension measurements
Line tension was determined using the flicker spectroscopy method of Esposito et al. [21]. Based on a series of 500 Ld/Lo boundary images, the fluctuation spectrum of a phase domain boundary on a GUV is decomposed into Fourier modes that are correlated to line tension by Equation 2,
| (2) |
where n is the mode number, un is the mode amplitude, σ is the line tension, R0 is the radius of a circle yielding the domain area, kB is the Boltzmann constant, and T is the absolute temperature.
Empirically determined, only Fourier modes 2 to 5 were chosen for analysis in measuring line tension with fluctuating domain simulations [1], as described by Esposito et al. [21]. A relatively high concentration of C12:0 DiI of 0.2 mol% of total lipid was necessary in order to achieve sufficient contrast at the Ld/Lo interface. Microscope visualization for line tension measurements was improved by use of an additional 1.5x intermediate magnifier. C12:0 DiI was excited through a Spectra X Light Engine (Lumencor, Inc., Beaverton, OR) with a green LED (542/27). A filter cube, assembled with excitation filter (545/25), emission filter (605/70), and a dichroic beam splitter, was used for fluorescence illumination.
For all four-component lipid mixtures, we can only start to measure line tension at a ρ value where circular Ld + Lo domains are visible under the fluorescence microscope. The GUV sample was visualized using the lowest illumination intensity that provided a satisfactory signal, which for our instrument was 3% illumination intensity of the Spectra X. Once a suitable domain was found, image data were collected at 50% illumination intensity. During the image acquisition of 500 frames, the Spectra X was triggered by the camera so that the LED was only on for the 10 ms exposure time. During the 20 ms between frames, the LED was off in order to minimize light-induced artifacts.
Analysis of domain boundary fluctuations was implemented using Matlab R2014b and followed the basic methodology of Esposito et al. 2007 [21]. Briefly, the software located domain boundaries with Matlab’s Canny edge detection. The largest boundary was defined as the domain of interest. A domain boundary image was recognized as a valid frame for analysis only when it appeared roughly circular and within 3% variation of the original domain area. The average Fourier transform of the valid boundary frames was then employed to calculate line tension σ for each mode using Equation 2.
To acquire reliable line tension values, circular domains had to be located at the top center of a GUV with the domain diameter greater than ~ 5 μm but less than 1/5th of the GUV diameter [21]. For each lipid domain, we made a 15 s time series: a 10 ms exposure time with a 30 ms cycle time. Six to twenty such Ld + Lo domains were imaged for each ρ value. As long as lipid domains were smaller than 1/5 the GUV diameter, line tension values were found to be independent of lipid domain type (Ld or Lo), domain size, or GUV diameter [1]. Detailed in Table S1 in Supplementary Material, fast cooling was needed for GUV samples at higher ρ values in order to break up larger macroscopic domains into desirable sizes around 5 μm.
We tested for light-induced artifacts by looking for changes in line tension for successive sets of 100 frames, as described in Section 3, Subset analysis, in Supplementary Material, with the results shown in Figure S1. We rejected frames that showed light-induced artifacts of break-up or fusion of lipid domains, or changes in the amplitude or frequency of the fluctuations of the domains during the 15 seconds of measurement.
3. Results and discussion
3.1. Phase morphology transition of DSPC/DOPC/POPC/Chol
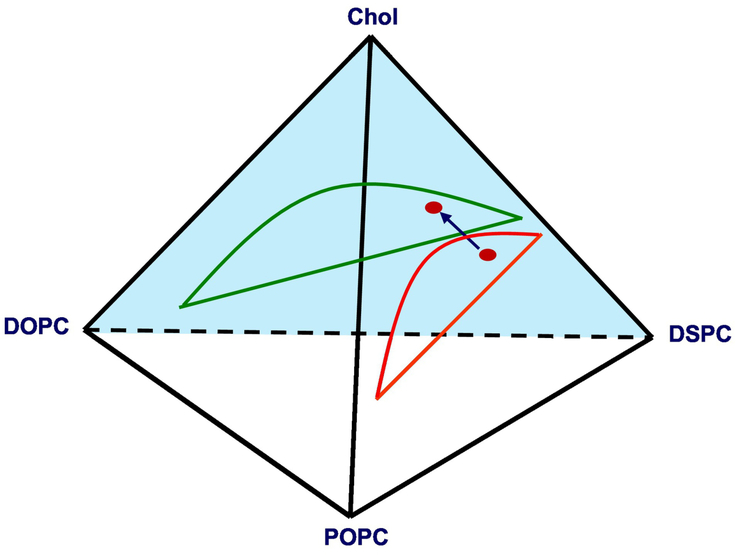
The tetrahedral phase diagram in Figure 1 illustrates the compositions used to examine the phase morphology transition within the Ld + Lo coexistence region. Starting from the ternary DSPC/POPC/Chol mixture at a fixed DSPC/Chol ratio, POPC was gradually replaced by DOPC as described by Equation 1.
Fig. 1.
Schematic diagram of substitution of POPC with DOPC within the Ld + Lo volume of the DSPC/DOPC/POPC/Chol lipid mixture.
The blue arrow indicates this compositional replacement that we term “ρ trajectory” within the Ld + Lo volume in the tetrahedral phase diagram.
ρ ≡ χDOPC / (χDOPC + χPOPC).
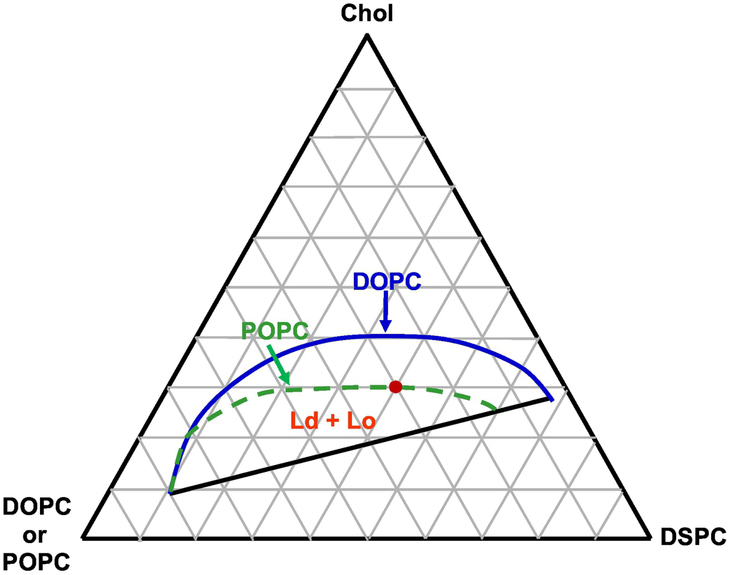
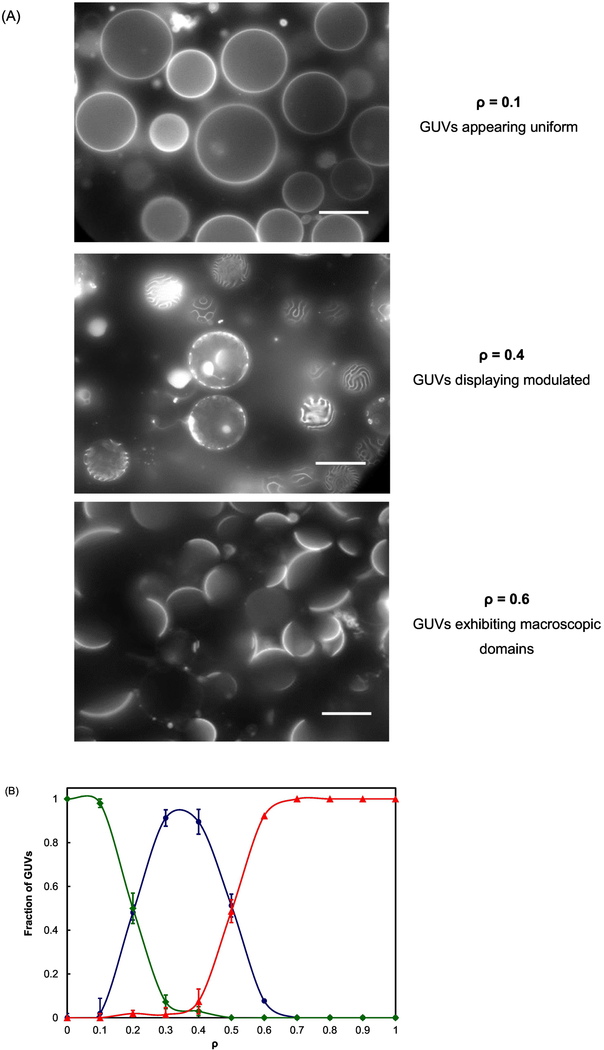
A DSPC/(DOPC+POPC)/Chol lipid mixture with mole ratio of 0.4/0.3/0.3, close to the upper boundary of the Ld + Lo coexistence regime, was selected for this study as shown in Figure 2 [6]. Modulated GUVs appear at intermediate ρ values within the Ld + Lo coexistence regime, as shown for ρ = 0.4 in Figure 3A. GUVs with nanoscopic Ld + Lo coexistence displaying a uniform surface, whereas GUVs with macroscopic Ld + Lo coexistence show phase separation with visible round Ld + Lo domains. Figure 3A shows that phase morphology exhibits a transition from nanoscopic to modulated to macrodomains as a function of ρ. In Figure 3B, we observe modulated phases in a range of ρ values (termed a “ρ window”) from 0.2 to 0.6. At ρ < 0.2, uniform GUVs dominate, whereas at ρ > 0.6, macroscopic GUVs with round Lo + Ld domains account for the majority of the GUV sample.
Fig. 2.
Composite phase diagram indicating the coexisting Ld + Lo regimes of DSPC/DOPC/Chol or DSPC/POPC/Chol lipid mixtures at 23 °C [6].
Dashed green line, Ld + Lo boundary for ρ = 0; solid blue line for ρ = 1; both Ld + Lo regimes share a common lower boundary (solid). Phase boundaries from [6] are drawn to show the difference between low Tm lipids DOPC and POPC in mixtures with DSPC/Chol.
Fig. 3.
Description of morphology transition of coexisting Ld + Lo vs ρ.
The four-component lipid mixture is DSPC/(DOPC+POPC)/Chol with mole ratios of 0.4/ 0.3/ 0.3; (A) Fluorescence microscopy images of GUVs at different ρ values; (B) Phase morphologies vs ρ. ◆, uniform GUVs; ●, modulated GUVs; ▲, macroscopic GUVs. Scale bar: 20 μm. Error bars correspond to SE.
3.2. Line tension decreases at higher cholesterol fraction
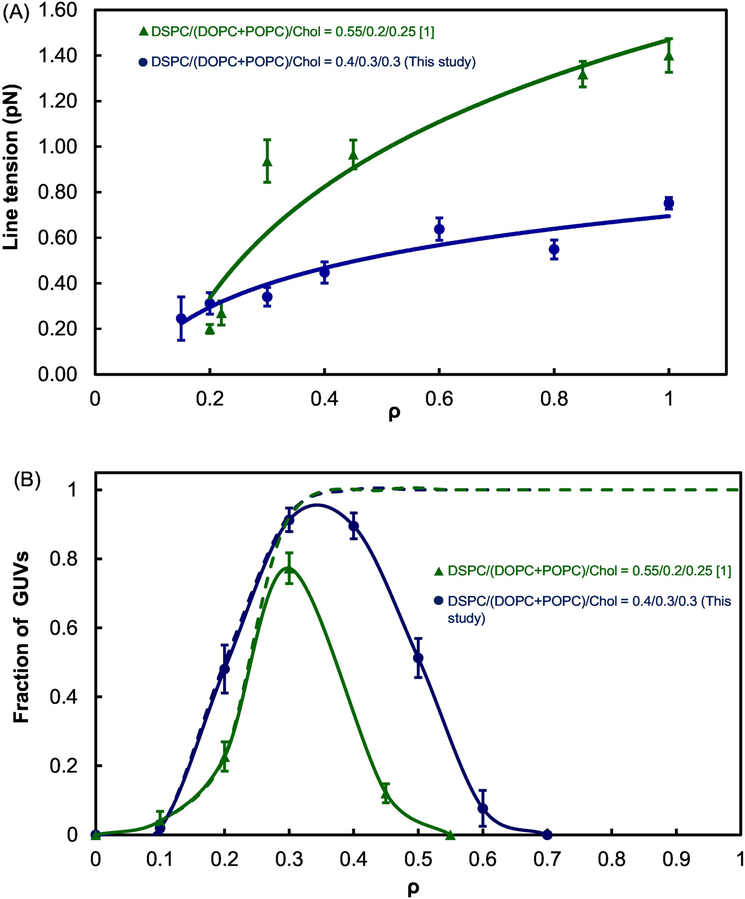
Line tension of DSPC/(DOPC+POPC)/Chol with mole ratios = 0.4/0.3/0.3 for this study was measured using the technique described in Section 2.4. As shown in Figure 4A, line tension increased from ~ 0.3 to 0.75 pN as ρ increased from 0.2 to 1.0 (blue circles). For the lower Chol fraction, DSPC/(DOPC+POPC)/Chol = 0.55/0.2/0.25 [1], line tension varied from 0.2 to 1.4 pN for a similar range of the ρ trajectory (green triangles). These two data sets indicate that line tension is reduced by 35 to 50 % in the lipid mixture when Chol mole fraction is increased modestly from 0.25 to 0.3. Figure 4B shows that the lipid mixture with the higher Chol mole fraction of 0.3 displays modulated phases in a slightly broader range of ρ values ranging from 0.2 to 0.6.
Fig. 4.
Line tension variation (A) and morphology transition (B) along a ρ trajectory for different Chol fractions.
DSPC/(DOPC+POPC)/Chol = 0.55/0.20/0.25 [1] = ▲“low cholesterol” and
DSPC/(DOPC+POPC)/Chol = 0.4/0.3/0.3 (this study) = ●“high cholesterol”; dashed lines in Figure 4B show sum of macro plus modulated domains. Error bars correspond to SE. Line tension values from 5 to 15 GUV domains were averaged for each data point at different ρ values.
3.3. Modulated phase windows shift to higher ρ values with increasing Chol mole fraction in BSM/DOPC/POPC/Chol mixtures
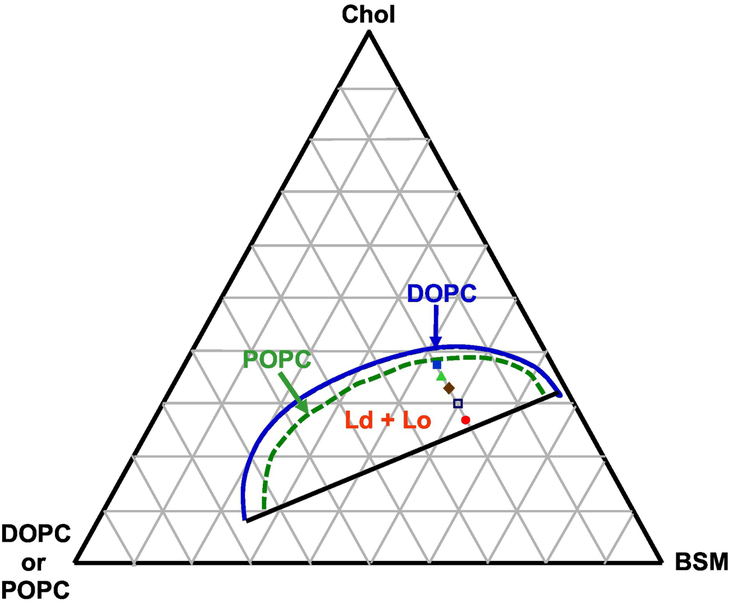
Compared to the mixtures with DSPC, the larger region of liquid-liquid immiscibility of BSM/DOPC/POPC/Chol mixtures enabled us to study a wider range of Chol fractions. In addition, this mixture contains the natural lipid SM, found in the exoplasmic leaflet of mammalian cell membranes. With a fixed mole fraction of low Tm lipids (DOPC + POPC) = 0.2, the Chol mole fraction could be increased from 0.27 to 0.33 and still yield macroscopic domains. However, at higher Chol fractions of 0.36 and 0.38, the majority of the GUVs were observed as uniform, which did not change for up to 48 hours. Very few macroscopic lipid domains were found. We include results with these few macro domains in the Supplementary Material. Table 1 shows the compositions of BSM/DOPC/POPC/Chol mixtures used in this study. Figure 5 presents the location of these chosen lipid compositions within the Ld + Lo coexistence regime in the phase diagram [19].
Table 1.
Compositions of the four-component lipid systems used.
| Lipids | Compositions |
|---|---|
| DSPC/(DOPC+POPC)/Chol | 0.55/0.20/0.25 |
| DSPC/(DOPC+POPC)/Chol | 0.4/0.3/0.3 |
| BSM/(DOPC+POPC)/Chol | 0.53/0.2/0.27 |
| BSM/(DOPC+POPC)/Chol | 0.5/0.2/0.3 |
| BSM/(DOPC+POPC)/Chol | 0.47/0.2/0.33 |
| BSM/(DOPC+POPC)/Chol | 0.44/0.2/0.36 |
| BSM/(DOPC+POPC)/Chol | 0.42/0.2/0.38 |
Fig. 5.
Composite phase diagram indicating the coexisting Ld + Lo regimes of BSM/DOPC/Chol or BSM/POPC/Chol lipid mixtures at 25 °C [19].
Dashed green line shows upper boundary for ρ = 0; solid blue line for ρ = 1; both Ld + Lo regimes share a common lower boundary (solid black line). Phase boundaries from [19] are drawn to show the difference between low Tm lipids DOPC and POPC in mixtures with BSM/Chol.
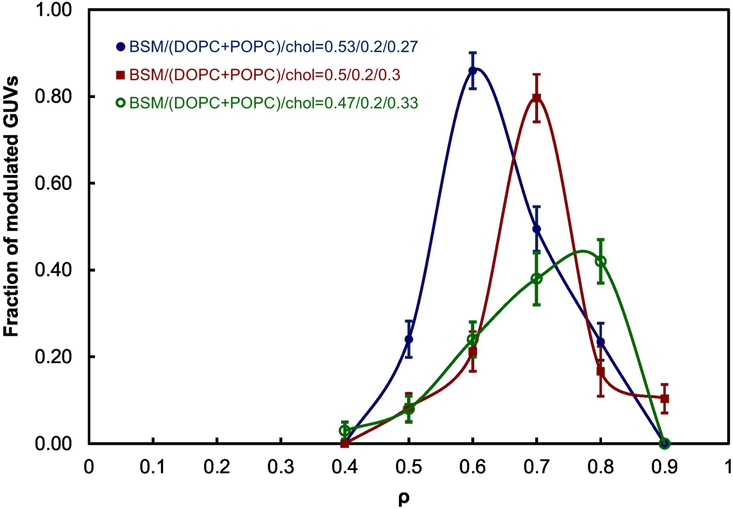
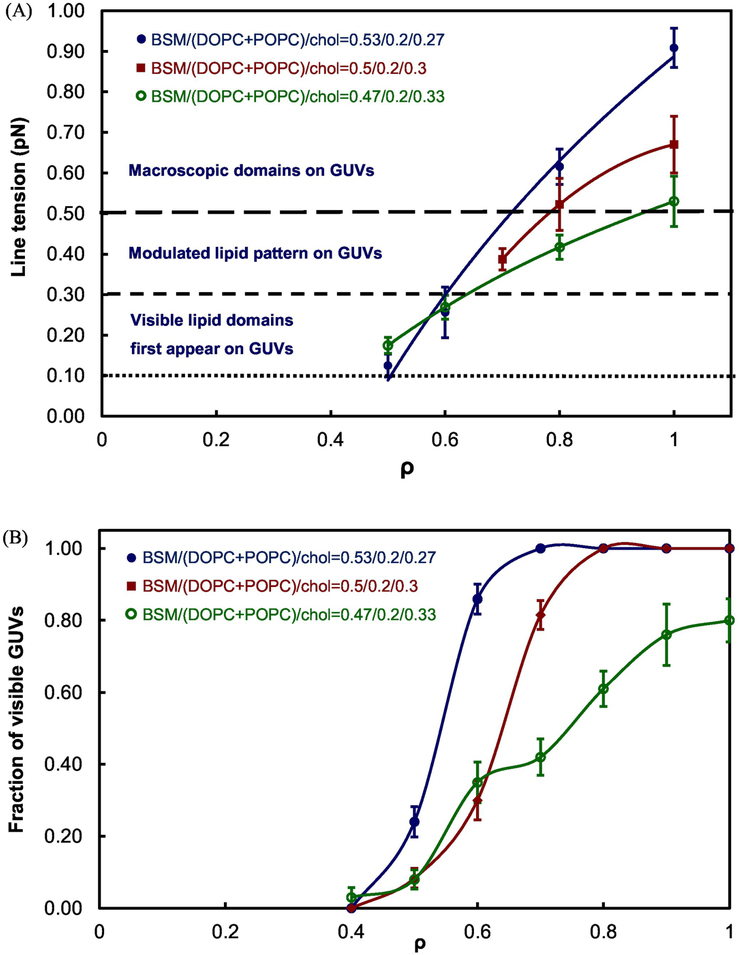
Figure 6 shows the ρ windows of BSM/DOPC/POPC/Chol. An increase of Chol fraction from 0.27 to 0.33 moves the ρ window center from 0.6 to 0.8 and decreases line tension at ρ = 1 from 0.9 to 0.5, as presented in Figure 7A. Thus, these modest increases in Chol fraction have pronounced influence on line tension.
Fig. 6.
Modulated-phase compositions (“ρ windows”) of coexisting Ld + Lo determined for BSM/DOPC/POPC/Chol with different Chol mole fractions from 0.27 mole fraction to 0.33. The ρ-window center shifts from ρ = 0.6 to 0.8 with increasing Chol mole fraction from 0.27 to 0.33. Error bars correspond to SE.
Fig. 7.
Line tension increases as ρ increases and Ld + Lo domains become visible at higher line tension at three Chol fractions of 0.27, 0.3, and 0.33 for BSM/DOPC/POPC/Chol.
(A) In all three lipid mixtures, visible domains first appear at line tension between 0.1 to 0.3 pN (dotted line). Modulated GUVs become dominant at line tension between 0.3 to 0.5 pN (dashed line). Above 0.5 pN, macroscopic GUVs with large and round domains account for the majority (long dashed line). Line tension values from 5 to 15 GUV domains were determined and averaged for each data point at different ρ values; (B) Fractions of visible lipid domains (modulated plus macro domains) correspond to line tension change as ρ increases. Error bars correspond to SE.
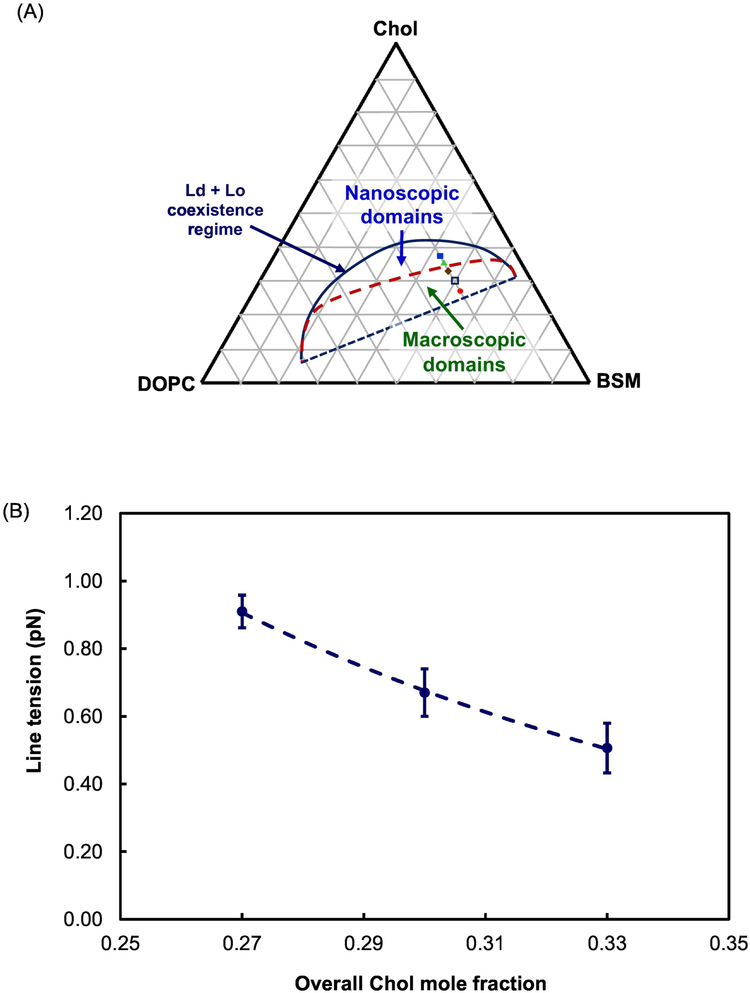
We found Ld + Lo domains to be mostly nanoscopic at Chol fractions of 0.36 and 0.38. These data are shown in Figure S3 in Supplementary Material. At the Chol mole fraction higher than 0.33, which is not close to the upper limit of the Ld + Lo coexistence at Chol fraction ~ 0.4, the GUVs were > 90% uniform. With this new information, we modify the previously determined BSM/DOPC/Chol phase diagram [19], to show a red dashed line boundary between nanodomains at higher Chol fractions and macrodomains at lower Chol fractions, as shown in Figure 8A.
Fig. 8.
Line tension decreases for BSM/DOPC/Chol with increasing Chol content.
(A) The phase diagram from BSM/DOPC/Chol [19] is now modified to show the nanodomain region at high Chol fractions above the dashed red line, obtained from measurements with DOPC fraction fixed at 0.2; (B) Line tension decreases as overall Chol fraction increases from 0.27 to 0.33; (C) The Chol fraction of Ld increases by 80%, from 0.1 to 0.18, but increases only by about 10% from 0.35 to 0.39 in Lo, as shown by the blue and green arrows, respectively. Error bars correspond to SE.
3.4. Line tension consistently decreases with increasing Chol mole fraction in BSM/DOPC/POPC/Chol lipid mixtures
Figure 7A shows line tension of the BSM/DOPC/POPC/Chol model membranes at three different Chol mole fractions of 0.27, 0.3, and 0.33, respectively. Line tension consistently decreases with Chol fractions from 0.27 to 0.33. For each lipid mixture, line tension could be measured starting at ρ = 0.5 to 0.7, where round domains were first detected under the microscope. The Ld and Lo phases are still far apart in composition, but there is likely to be a reduced thickness mismatch, resulting in lower line tension [12] and nanoscopic domains appearing at higher ρ values. Line tension of the lipid mixtures containing Chol fractions of 0.36 and 0.38 was measured to be between 0.19 to 0.39 pN for the < 10% of vesicles that showed macroscopic domains, as described in Figure S4 in Supplementary Material. ~ 90% of GUVs with Chol fractions 0.36 and 0.38 were uniform, indicating nanoscopic Ld + Lo. A boundary between appearance of macro/nanodomains in the Ld + Lo coexistence regime is therefore shown in Figure 8A.
As shown in Figure 7A, visible Lo + Ld domains begin to appear at line tension between ~ 0.1 – 0.3 pN. In this regime, most lipid domains appear with domain diameter < 2 μm and irregular shape. Between 0.3 and 0.5 pN, the modulated domain patterns appear on the GUV. Above 0.5 pN, macroscopic domains are found for the majority of GUVs in this BSM/DOPC/POPC/Chol model system. With line tension < 0.5 pN, only a few GUVs with round lipid domains could be observed in each sample under fluorescence microscopy. We prepared several slides for each lipid composition to acquire sufficient lipid domains for imaging. 5 to 15 round lipid domains with diameter around 5 μm were sought for each line tension measurement. For the lipid mixtures containing Chol fractions of 0.27 and 0.33, appropriate domains could be found at ρ = 0.5. For the lipid mixture containing the Chol fraction of 0.3, lipid domains with measurable size were first found at ρ = 0.7. Seul and Andelman (1995) showed that domain patterns could be controlled by competing interactions of dipole-dipole repulsion and line tension [14]. Depending on the values of the line tension and the competing interaction, different patterns appear. A round domain is formed when line tension is relatively high, and a stripe-like or branched domain (modulated patterns) appear at lower line tension. In our lipid mixture with Chol mole fraction ≤ 0.33, modulated GUVs dominated for line tension < 0.5 pN. Thin stripes, honeycomb, stripe-like patterns, and non-rounded small domains on GUVs were observed under fluorescence microscopy. The finding is consistent with the results reported by Seul and Andelman in 1995 [14]. Macroscopic Ld + Lo domains appeared for line tension > 0.5 pN.
3.5. Correlation of line tension and cholesterol content in the ternary BSM/DOPC/Chol bilayer
Line tension was measured as a function of Chol concentration for the ternary BSM/DOPC/Chol membrane model in the Ld + Lo coexistence region. Figure 8A shows all of the lipid compositions located on the phase diagram of BSM/DOPC/Chol [19] with the aforementioned red boundary between macroscopic and nanoscopic Ld/Lo domains. With a fixed mole fraction of DOPC at 0.2, the Chol content was raised as shown. Figure 8B shows that line tension decreases from 0.91 to 0.51 as overall Chol mole fraction increases from 0.27 to 0.33. Figure 8C shows how the Chol fraction in each of the coexisting phases changes during this line tension change. Chol fractions in the Ld + Lo domains were found from the lever rule from the phase boundary lipid compositions in the coexistence regime of the phase diagram for BSM/DOPC/Chol mixtures [19]. The Ld phase Chol fraction changes 80%, increasing from 0.1 to 0.18, while the Lo phase Chol fraction changes only about 10%, from 0.35 to 0.39. This large change of Chol fraction in the Ld phase leads to an increase of the Ld thickness [12]. The line tension decreases, correlated with the reduced thickness mismatch between the Ld and Lo phases. Thus, Chol fraction has a major role in the value of the line tension. A similar result was reported for line tension measurements of GUVs of egg-SM/DOPC/Chol using micropipette aspiration [13] as compositions were prepared to approach the critical point. In that study, average line tension values decreased from 3.3 pN to 0.5 pN with total Chol fraction increasing from 0.16 to 0.4 [13]. Note that line tension values for lipid mixtures containing egg-SM are higher than those for otherwise identical lipid mixture containing BSM [1], and Ld and Lo phase domains stayed macroscopic at these higher line tensions.
4. Conclusions
In bilayer mixtures of the type, (high Tm phospholipid)/(low Tm phospholipids)/Chol, increasing the Chol fraction decreases the Ld/Lo line tension, whereas increasing the DOPC fraction raises line tension. A new finding is that Chol fractions > 0.33 in BSM/DOPC/Chol mixtures leads to uniform GUVs, meaning that Ld + Lo nanodomains form in a larger region of the composition space in what is usually considered to be a “macrodomain” Ld + Lo mixture. The phase diagram for this mixture has now been modified to show this new finding. Thus, by control of line tension, Chol fraction can determine whether Ld + Lo domains are nanoscopic or macroscopic.
Supplementary Material
Highlights.
GUVs composed of BSM or DSPC/DOPC/POPC/Chol can be generated using electroformation.
A nanoscopic-to-macroscopic transition within Ld/Lo coexistence regime is exhibited on GUVs as POPC is replaced by DOPC.
The Chol content can control line tension and thus determine whether Ld/Lo domains are nanoscopic or macroscopic.
Line tension of 0.1–0.3 pN has been detected for initial formation of visible Ld/Lo lipid domains.
Line tension decreases as correlated with reduced thickness mismatch between the Ld and Lo phases.
Acknowledgements
This work was supported by U.S. National Science Foundation grant No. MCB-1410926 and U.S. National Institutes of Health grant No. GM105684 to G.W.F.
Footnotes
Publisher's Disclaimer: This is a PDF file of an unedited manuscript that has been accepted for publication. As a service to our customers we are providing this early version of the manuscript. The manuscript will undergo copyediting, typesetting, and review of the resulting proof before it is published in its final citable form. Please note that during the production process errors may be discovered which could affect the content, and all legal disclaimers that apply to the journal pertain.
References
- [1].Usery RD, Enoki TA, Wickramasinghe SP, Weiner MD, Tsai WC, Kim MB, Wang S, Torng TL, Ackerman DG, Heberle FA, Katsaras J, Feigenson GW, Line tension controls liquid-disordered + liquid-ordered domain size transition in lipid bilayers, Biophys. J 112 (2017) 1431–1443. [DOI] [PMC free article] [PubMed] [Google Scholar]
- [2].Simons K, Ikonen E, Functional rafts in cell membranes, Nature 387 (1997) 569–572. [DOI] [PubMed] [Google Scholar]
- [3].Lingwood D, Simons K, Lipid Rafts As a Membrane-Organizing Principle, Science 327 (2010) 46–50. [DOI] [PubMed] [Google Scholar]
- [4].Ramstedt B, Slotte JP, Membrane properties of sphingomyelins, FEBS Letters 531 (2002) 33–37. [DOI] [PubMed] [Google Scholar]
- [5].Goh SL, Amazon JJ, Feigenson GW, Toward a Better Raft Model: Modulated Phases in the Four-Component Bilayer, DSPC/DOPC/POPC/CHOL, Biophys. J 104 (2013) 853–862. [DOI] [PMC free article] [PubMed] [Google Scholar]
- [6].Konyakhina TM, Wu J, Mastroianni JD, Heberle FA, Feigenson GW, Phase diagram of a 4-component lipid mixture: DSPC/DOPC/POPC/chol, Biochim. Biophys. Acta, Biomembr 1828 (2013) 2204–2214. [DOI] [PMC free article] [PubMed] [Google Scholar]
- [7].Amazon JJ, Goh SL, Feigenson GW, Competition between line tension and curvature stabilizes modulated phase patterns on the surface of giant unilamellar vesicles: A simulation study, Physical Review E 87 (2013) 022708. [DOI] [PubMed] [Google Scholar]
- [8].García-Sáez AJ, Schwille P, Stability of lipid domains, FEBS Letters 584 (2010) 1653–1658. [DOI] [PubMed] [Google Scholar]
- [9].Feigenson GW, Phase boundaries and biological membranes, Annu. Rev. Biophys. Biomol. Struct 36 (2007) 63–77. [DOI] [PMC free article] [PubMed] [Google Scholar]
- [10].Sengupta P, Holowka D, Baird B, Fluorescence resonance energy transfer between lipid probes detects nanoscopic heterogeneity in the plasma membrane of live cells, Biophys. J 92 (2007) 3564–3574. [DOI] [PMC free article] [PubMed] [Google Scholar]
- [11].Borbat PP, Costa-Filho AJ, Earle KA, Moscicki JK, Freed JH, Electron spin resonance in studies of membranes and proteins, Science 291 (2001) 266–269. [DOI] [PubMed] [Google Scholar]
- [12].Heberle FA, Petruzielo RS, Pan J, Drazba P, Kučerka N, Standaert RF, Feigenson GW, Katsaras J, Bilayer thickness mismatch controls domain size in model membranes, J. Am. Chem. Soc 135 (2013) 6853–6859. [DOI] [PubMed] [Google Scholar]
- [13].Tian A, Johnson C, Wang W, Baumgart T, Line tension at fluid membrane domain boundaries measured by micropipette aspiration, Phys. Rev. Lett 98 (2007) 208102.1–208102.4. [DOI] [PubMed] [Google Scholar]
- [14].Seul M, Andelman D, Domain shapes and patterns: the phenomenology of modulated phases, Science 267 (1995) 476–483. [DOI] [PubMed] [Google Scholar]
- [15].Korlach J, Schwille P, Webb WW, Feigenson GW, Characterization of lipid bilayer phases by confocal microscopy and fluorescence correlation spectroscopy, Proc. Natl. Acad. Sci. USA 96 (1999) 8461–8466. [DOI] [PMC free article] [PubMed] [Google Scholar]
- [16].Kingsley PB, Feigenson GW, The synthesis of a perdeuterated phospholipid: 1,2-dimyristoyl-sn-glycero-3-phosphocholine-d72, Chem. Phys. Lipids 24 (1979) 135–147. [Google Scholar]
- [17].Angelova MI, Soléau S, Méléard Ph., Faucon F, Bothorel P, Preparation of giant vesicles by external AC electric fields. Kinetics and applications, Progr. Colloid Polym. Sci 89 (1992) 127–131. [Google Scholar]
- [18].Morales-Penningston NF, Wu J, Farkas ER, Goh SL, Konyakhina TM, Zheng JY, Webb WW, Feigenson GW, GUV preparation and imaging: Minimizing artifacts, Biochim. Biophys. Acta, Biomembr 1798 (2010) 1324–1332. [DOI] [PMC free article] [PubMed] [Google Scholar]
- [19].Petruzielo RS, Heberle FA, Drazba P, Katsaras J, Feigenson GW, Phase behavior and domain size in sphingomyelin-containing lipid bilayers, Biochim. Biophys. Acta, Biomembr 1828 (2013) 1302–1313. [DOI] [PMC free article] [PubMed] [Google Scholar]
- [20].Heberle FA, Wu J, Goh SL, Petruzielo RS, Feigenson GW, Comparison of Three Ternary Lipid Bilayer Mixtures: FRET and ESR Reveal Nanodomains, Biophys. J 99 (2010) 3309–3318. [DOI] [PMC free article] [PubMed] [Google Scholar]
- [21].Esposito C, Tian A, Melamed S, Johnson C, Tee SY, Baumgart T, Flicker spectroscopy of thermal lipid bilayer domain boundary fluctuations, Biophys. J 93 (2007) 3169–3181. [DOI] [PMC free article] [PubMed] [Google Scholar]
Associated Data
This section collects any data citations, data availability statements, or supplementary materials included in this article.


