

Abstract
Neuropsychiatric manifestations in lupus (NPSLE) affect ~20-40% of patients. In the central nervous system, lipocalin-2 (LCN2) can promote injury through mechanisms directly linked to NPSLE, including brain barrier disruption, neurotoxicity, and glial activation. Since LCN2 is elevated in lupus and has been implicated in neuroinflammation, we investigated whether LCN2 is required for the pathogenesis of NPSLE. Here, we investigated the effects of LCN2 deficiency on the development of neurobehavioral deficits in the B6.Sle1.Sle3 (Sle1,3) mouse lupus model. Sle1,3 mice exhibited depression-like behavior and impaired spatial and recognition memory, and these deficits were attenuated in Sle1,3-LCN2KO mice. Whole-brain flow cytometry showed a significant increase in brain infiltrating leukocytes in Sle1,3 mice that was not reduced by LCN2 deficiency. RNA sequencing on sorted microglia revealed that several genes differentially expressed between B6 and Sle1,3 mice were regulated by LCN2, and that these genes are key mediators of the neuroinflammatory cascade. Importantly, LCN2 is upregulated in the cerebrospinal fluid of NPSLE patients across 2 different ethnicities. Our findings establish the Sle1,3 strain as an NPSLE model, demonstrate that LCN2 is a major regulator of the detrimental neuroimmune response in NPSLE, and identify CSF LCN2 as a novel biomarker for NPSLE.
Keywords: Lipocalin-2, Neuropsychiatric lupus, Neuroinflammation, Microglia, RNA-seq
1. INTRODUCTION
Systemic lupus erythematosus (SLE) is a chronic autoimmune disease that disproportionately affects women of childbearing age [1,2]. Primary (e.g. disease related) manifestations of central nervous system disease in lupus patients, known as neuropsychiatric SLE (NPSLE), affect approximately 20-40% of patients, an estimate that varies widely across reports [3,4]. Patients with diffuse NPSLE present with signs and symptoms including cognitive decline, acute confusion, psychosis, and depression [4], and the pathophysiology that underlies these manifestations is not well understood. This can result in suboptimal treatment, including non-specific immunosuppression, that is generally non-curative [4].
Lipocalin-2 (LCN2) is an acute-phase reactant protein with pleiotropic immune functions. Originally discovered in granules of neutrophils in close association with the gelatinase matrix metalloproteinase 9 (MMP9), it is also known as neutrophil gelatinase-associated lipocalin, or NGAL [5]. Other common names include 24p3, siderocalin, and uterocalin, and the diversity of pseudonyms speaks to its variety of known effects [6]. In the periphery, LCN2 is a major regulator of innate immunity through its binding to siderophores, resulting in iron sequestration to starve invading bacteria [7], fungi [8], and plasmodia [9]. LCN2 is upregulated at mucosal [10] and epithelial [11] barriers, ready to exert its anti-microbial effects, and it is also produced by several cell types, including macrophages [12], neutrophils [5], and activated leukocytes [13], upon infection. Additionally, LCN2 is a key regulator of cellular differentiation and survival, inducing both proliferation and apoptosis [14]. LCN2 is also implicated in chronic inflammation, and is upregulated in several autoimmune diseases, including SLE. While the use of LCN2 and anti-LCN2 antibodies as urinary and serum biomarkers respectively in SLE has been reported [15, 16], the role of LCN2 in NPSLE has not been investigated.
Within the CNS, LCN2 is produced at very low levels but is quickly upregulated in neuroinflammation [17]. Several brain resident cell types, including endothelial cells [18], astrocytes [19], microglia [17], and neurons [20], both produce and possess receptors for LCN2, and this allows for several effects within the brain. LCN2 binding to endothelial cells results in activation of these cells and disruption of tight junction proteins [21], thereby permeabilizing the blood-brain-barrier to peripheral effectors. LCN2 is also a potent inducer of chemotaxis [22], and therefore further drives cellular infiltration. Within the CNS parenchyma, LCN2 results in the deramification and activation of microglia [23] and promotes reactive astrocytosis [24], therefore perpetuating the inflammatory response within the brain. LCN2 can induce neurotoxicity through this cascade or through direct effects on neurons [25]. Indeed, LCN2-deficient mice exhibit reduced glial activation and improved cognition after middle cerebral artery occlusion [21] and a reduction in neuronal dysfunction after spinal cord injury [26]. Moreover, in the context of autoimmune neuroinflammation, LCN2 deficiency ameliorates experimental autoimmune encephalitis (EAE), the mouse model of multiple sclerosis [27]. Alternatively, there have been reports of LCN2 deficiency worsening disease, including increased stress-induced anxiety [20] and exacerbated EAE [28]; some postulate that LCN2 actually protects the brain during inflammatory conditions [29]. Given that LCN2 promotes several neuropathological mechanisms that are thought to underlie NPSLE, we aimed to determine the effects of LCN2 deficiency in a lupus-prone mouse.
To investigate the effects of LCN2 deficiency on NPSLE, we developed the Sle1,3-LCN2 knockout (KO) mouse. Sle1,3 mice are a bicongenic strain in which two susceptibility loci, Slel and Sle3, from the NZM2410 spontaneous lupus-prone strain were introgressed onto a nonautoimmune B6 mouse [30]. The Sle1,3 mouse exhibits increased T cell activation, autoantibodies, and a progressive glomerulonephritis, thereby recapitulating several aspects of human lupus [31]. Though the Sle1,3 mouse has not previously been investigated for the presence of a neuropsychiatric phenotype, the NZB/NZW F1 mouse, from which the NZM2410 was derived, exhibits deficits in learning and memory [32]. The Sle1,3 mouse was crossed with the B6.LCN2-deficient (LCN2KO) mouse for 10 generations to develop the Sle1,3-LCN2KO mouse. This strain facilitates the determination of the role of LCN2 within the chronic inflammatory context of SLE. In the present study, we investigated the hypothesis that LCN2 deficiency attenuates NPSLE manifestations in the lupus-prone Sle1,3 mouse.
2. MATERIAL and METHODS
2.1. Mice
B6.Sle1/Sle3 (Sle1,3) mice are a bicongenic strain derived from the introgression of 2 lupus susceptibility loci from the NZM2410 spontaneous SLE model onto non-autoimmune C57B6 (B6) mice [31]. Sle1,3 mice exhibit increased T cell activation, autoantibodies to nuclear antigens, and glomerulonephritis. B6.LCN2KO (LCN2KO) mice (50) were crossed with the Sle1,3 mouse for 10 generations to create the Sle1,3-LCN2KO mice. B6 controls were obtained from the Jackson Laboratory (Bar Harbor, Maine). All mice in the study were female and were housed at a temperature of 21–23°C on a 12:12 hour light:dark cycle.
2.2. Experimental design
Sle1,3 mice, Sle1,3-LCN2KO mice, LCN2KO mice, and B6 controls (n=5-10 mice/group) were assessed at 7 to 10 months of age for the presence of cognitive and affective deficits. After sacrifice, spleen weight was determined, and brains were either fixed, paraffin-embedded, and sectioned for histological analysis, or dissected and snap-frozen in liquid nitrogen and stored at −80°C for analysis of gene and protein expression. Brains from a separate cohort of mice (n=4-5/group) were evaluated by flow cytometry. Infiltrating CD4+ and CD8+ T cells and CD45+ cells were quantified, and CD11b+ CD45-low CD64+ microglia were sorted for RNA sequencing and downstream analysis.
2.3. Assessment of systemic disease
Serum IgG autoantibodies against double-stranded DNA at 7 to 10 months of age were measured by ELISA. Plates were coated with 0.1 mg/mL salmon sperm DNA (ThermoFisher Scientific, Waltham, MA) in PBS in a warm room overnight and rinsed with PBS on the following day. Plates were blocked with 1% BSA in PBS for 1 hour at 37°C. Samples were added at a 1:100 dilution and 6 subsequent two-fold dilutions to 1:3200 and incubated for 2 hours at 37°C. Next, samples were incubated with an alkaline phosphatase conjugated goat antimouse secondary antibody (Southern Biotech) and incubated for 1 hour at 37°C. Plates were then washed, developed with phosphatase substrate (Sigma Aldrich) in 1M diethanolamine, pH 9.8 (Sigma Aldrich), and read at 405 nm using an Infinite F50 microplate reader (Tecan Group, Switzerland). Absorbance is reported as (optical density of sample/optical density of positive control 20-week old MRL/lpr serum on the same plate) × 100. Proteinuria was assessed semiquantitatively via Uristix where +1 is 30 mg/dL, +2 is 100 mg/dL, +3 is 300 mg/dL, and +4 is 2000 mg/dL (Siemens Healthcare, Tarrytown, NY). Spleens were dissected and weighed, and the organ weight was normalized to body weight for assessment of splenomegaly.
2.4. Behavioral assessment
A series of tests extensively validated and employed in MRL/lpr mice [33-36] were performed to assess cognition and depression-like behavior. The behavioral spectrometer was used to assess general locomotor activity, grooming, rearing, and exploration of the center zone [37]. Additional tests included the saccharin preference test for anhedonia [38], the object placement test for spatial memory, and the object recognition test for recognition memory [39]. Mice were equilibrated in the test room for 30 minutes prior to the tests under low incandescent light with soft background noise. Four cohorts of mice were assessed, and data were combined when age and testing conditions were comparable. All tests were digitally recorded by Viewer tracking software (Biobserve, Bonn, Germany).
2.4.1. Behavioral spectrometer.
The behavioral spectrometer (Behavioral Instruments: Hillsborough, NJ) is a 40 cm × 40 cm enclosed arena with infrared beams, a vibration-sensitive floor, and video tracking that is used to detect and measure behavior. Mice were placed in the behavioral spectrometer for 9 minutes, and behaviors were measured using Viewer Software. Stereotyped behaviors, including rearing, running, and time still, as well as track length, time spent in the center of the arena, and number of center entries, were assessed [37]. The central zone was defined as a 15 cm × 15 cm area in the center of the box.
2.4.2. Object placement test.
The object placement test is based on the propensity of mice to preferentially explore objects in novel positions, as previously described [39]. Briefly, mice were placed in a 40 cm × 40 cm arena for a training phase to freely explore two identical objects. Mice were then returned to their home cage for a 45-minute retention interval and subsequently placed back in the arena in which one of the objects had been relocated to a new position. The amount of time that mice spent exploring the two objects during the testing interval was measured manually with a stopwatch by an observer blind to the condition of the mice. Exploration was defined as time spent in contact with the object. The total exploration time during the training phase was also measured to ensure that mice in all conditions had equivalent levels of exploration. Mice with less than 3 seconds of total exploration during the training phase were excluded (Sle1,3 n=2; Sle1,3-LCN2KO n=1). To ensure adequate exploration of the objects during the training and testing phase, mice were trained to criteria, for a minimum of 5 minutes and until 3 seconds of exploration or 8 minutes, whichever came first. Mice were tested for a minimum of 4 minutes and until 3 seconds of exploration or 8 minutes, whichever came first. The preference score, or percent preference, was defined as (the amount of time spent exploring the object in the new position/total exploration time) × 100. Training and testing phases were recorded by Viewer software.
2.4.3. Object recognition test.
The object recognition test is also based on the robust tendency of mice to preferentially explore novel objects as previously described [39]. In this task, mice are again placed in the arena with two identical objects for a training phase, and the retention interval used was 120 minutes. During the testing phase, a new object was introduced and duration of exploration was recorded. Exploration was defined as time spent in contact with the object. To ensure adequate exploration of the objects during the training and testing phase, mice were trained to criteria, for a minimum of 3 minutes and until 3 seconds of exploration or 8 minutes, whichever came first. Mice were tested for a minimum of 3 minutes and until 3 seconds of exploration or 8 minutes, whichever came first. Mice with less than 3 seconds of total exploration during the training phase were excluded (B6 n=1; Sle1,3 n=4; Sle1,3-LCN2KO n=2). Objects were previously validated to ensure equal exploratory valence and were counterbalanced during training and testing. Exploration during the training phase was also measured, and both training and testing phases were recorded by Viewer software. The total exploration time during the training phase was also measured in order to ensure that mice in all conditions had equivalent levels of exploration.
2.4.4. Saccharin preference test.
Mice were placed in individual cages and simultaneously exposed to 2 bottles of water, one containing water treated with 1% saccharin and one containing untreated water. Mice tend to prefer saccharin-treated water, and a lack of this preference is indicative of anhedonia, or loss of response to pleasure or reward. The amount of saccharintreated and untreated water consumed during a 120-minute period was measured by weighing the water bottles. Water bottle positions were counterbalanced and switched every 30 minutes. Preference for saccharin-treated water was evaluated as (saccharin water consumed/total consumption) × 100. Anhedonia was defined as a reduction in saccharin preference relative to controls.
2.5. Renal Histopathology
Kidney sections were deparaffinized, rehydrated, and stained with hematoxylin and eosin (H&E) and periodic acid-Schiff (PAS) by the Histology and Comparative Pathology Core at the Albert Einstein College of Medicine. Kidney sections were scored by a nephropathologist (L.H.) who was blinded to the genotypes of the groups. Scoring was assigned as described [40]. Briefly, sections were assessed for glomerular deposits, endocapillary proliferation, glomerular sclerosis, interstitial inflammation, interstitial fibrosis, and tubular casts and dilatation. Each category was then assigned a score of 0–4, where 0 is normal appearing histology and 4 is the most severe disease. Scores for glomerular deposits, endocapillary proliferation, and glomerular sclerosis were averaged to obtain a score for glomerular histology; scores for interstitial inflammation, interstitial fibrosis, and tubular casts and dilatation were averaged to obtain a score for tubulointerstitial histology.
2.6. Immunofluorescence staining
Mice were transcardially perfused first with ice cold PBS and then with 2.5% paraformaldehyde. Brain tissue was isolated, further fixed in 2.5% paraformaldehyde for 48 hours, and then embedded in paraffin for coronal sectioning. For immunofluorescent staining, sections were deparaffinized in xylene and rehydrated in ethanol. Antigen retrieval was performed in citrate or Tris-EDTA buffer and sections were blocked in 20% normal horse serum. Staining for Iba-1 (rabbit anti-Iba-1, Wako, Osaka, Japan), GFAP (rabbit anti-mouse GFAP, Millipore, Darmstadt, Germany), and NeuN (mouse anti-mouse NeuN, Millipore, Darmstadt, Germany) were performed on 5 mm coronal sections. All fluorophore-conjugated secondary antibodies were from Jackson ImmunoResearch, West Grove, PA. Following immunostaining, all sections were counterstained with DAPI, washed, air dried, and mounted. Primary and secondary antibodies were withheld from sections to assess background and non-specific staining. Images were taken on a fluorescent microscope (Evos FL Auto 2, ThermoFisher Scientific) and quantified using ImageJ (National Institutes of Health, Bethesda, MD). Microglia and astrocyte density were calculated as the mean fluorescent intensity in regions of interest to determine an intensity score.
2.7. Terminal deoxyribonucleotidyl transferase dUTP nick end labeling (TUNEL)
TUNEL was carried out by utilizing an in-situ cell death detection kit-fluorescein (Roche, Indianapolis, IN) on paraffin-embedded coronal sections. Slides were examined under a Evos FL Auto 2 fluorescence microscope. One representative image was taken from each section, and the number of TUNEL positive cells in the dentate gyrus of the hippocampus was counted for each section.
2.8. RT-PCR
RNA was isolated from the pellet that resulted from protein extraction of cortex and hippocampus samples using TRIzol and the Direct-Zol Miniprep Kit (Zymo Research, Irvine, CA). Reverse transcription was performed using the Superscript First-Strand System (Life Technologies, Norwalk, CT), and real-time PCR was performed in triplicate using the SYBR Green Method (ThermoFisher Scientific). Values for the genes of interest were normalized to GAPDH, and fold change was determined using the delta-delta CT method.
2.9. Tissue processing, flow cytometry and fluorescence activated cell sorting (FACS)
Mice were transcardially perfused first with ice cold PBS. Brains were then excised and placed in ice cold HBSS until processing. The brains were weighed, infused with digestion buffer (2.5 mg/mL Liberase TL (Roche, Basel, Switzerland) and 1 mg/mL of DNase I in HBSS) using a 30 g needle, cut into small pieces, and placed into C-tubes (Miltenyi Biotec) containing 4 mL of digestion buffer. C-tubes were placed on a GentleMACS dissociator (Miltenyi Biotec) and run on the m_brain_3 protocol, after which they were placed in an incubator for 30 minutes at 37°C with shaking at 200 rpm. After incubation, C-tubes were placed back on the GentleMACS dissociator and run on the m_brain_3 protocol. Released cells were passed through a 40 μm nylon mesh using a cell masher and washed with 100 ml of wash buffer (autoMACS Running Buffer, Miltenyi Biotec). Microglia and infiltrating cells were isolated using a 30/70 percoll gradient (Percoll Plus, GE Healthcare). The cells collected from the gradient interphase were washed with HBSS and counted using an automated cell counter (Countess, Invitrogen); dead cells were discriminated using trypan blue. Cells were stained with live/dead Aqua viability dye (Invitrogen), incubated with Fc-block (BD Bioscience), and stained with fluorochromeconjugated antibodies (see fluorochrome list in Supplemental Table 1). Data were acquired on a BD FACSAria cell sorter (BD Biosciences, San Jose, CA), and microglia were sorted for further analyses. Pelleted sorted cells were immediately lysed in extraction buffer from a PicoPure RNA isolation kit (Arcturus Bioscience), and lysates were stored at −80°C until RNA was extracted. Analysis of the flow cytometric data was performed using Flowjo software (TreeStar, Ashland, OR).
2.10. RNA sequencing (RNA-seq)
RNA from FACSorted microglia of age-matched female BL/6, Sle1,3, Sle1,3-LCN2KO, and LCN2KO mice were extracted using a PicoPure RNA isolation kit according to manufacturer’s instructions. Sample quality control, processing, and library preparation were performed by the Northwestern University Next Generation Sequencing Core. RNA quality and quantity were measured using Agilent High Sensitivity RNA ScreenTape System (Agilent Technologies). RNA-seq libraries were prepared from 3 ng of total RNA using the QuantSeq 3’ biased mRNA-Seq Library Prep Kit for Illumina (Lexogen). DNA libraries were sequenced on an Illumina NextSeq 500 instrument with a target read depth of ~20 million reads per sample.
2.11. RNA-seq analysis
Raw sequencing files were first de-multiplexed using bcl2fastq. The resulting fastq files were trimmed of low-quality reads and bases, polyA tails, and adaptors using bbduk (http://Jgi.doe.gov/data-and-tools/bb-tools/). The trimmed fastq files were aligned to the mouse reference genome (mm10, Genome Reference Consortium GRCm38) using the STAR (Spliced Transcripts Alignment to a Reference) algorithm [41]. HTSeq was run on the resulting BAM files to provide raw gene counts. Raw gene counts for each sample were merged into a single gene expression table and normalized for read depth using counts per million (CPM). Four of the highest quality samples from each experimental group were included for subsequent analyses. Two samples were eliminated due to low gene counts at a given expression level and one sample was eliminated due to lower exonic mapping. Sample libraries showed an average of 81% alignment to the reference genome. For the RNA-seq analysis, we focused on the set of highly expressed genes (8435) (log2 normalized expression >4). For visualization, GENE-E (https://software.broadinstitute.org/GENE-E/) was used to perform K-means clustering (K=6) on differentially expressed genes (1467) as defined by ANOVA test (p<0.05) across any two groups shown in the heatmap. GO associations and the related p-values were determined by GOrilla [42]. Volcano plots were generated using the log2 fold change of normalized gene counts between BL/6 and Sle1,3 microglia and between Sle1,3 and Sle1,3-LCNKO microglia on the x-axis and p-values (-log10) on the y-axis. Pairwise differential genes with a false discovery rate (FDR) of 10% and fold change in expression between experimental groups >2 were determined using DEseq2. The fold change scatter plot in Figure 6 was constructed using log2 fold change of normalized gene counts between BL/6 and Sle1,3 microglia versus between Sle1,3 and Sle1,3- LCNKO microglia. Plots were generated using the ggplot2 package in software from R Studio.
Figure 6. Expression of several key genes is regulated by LCN2.
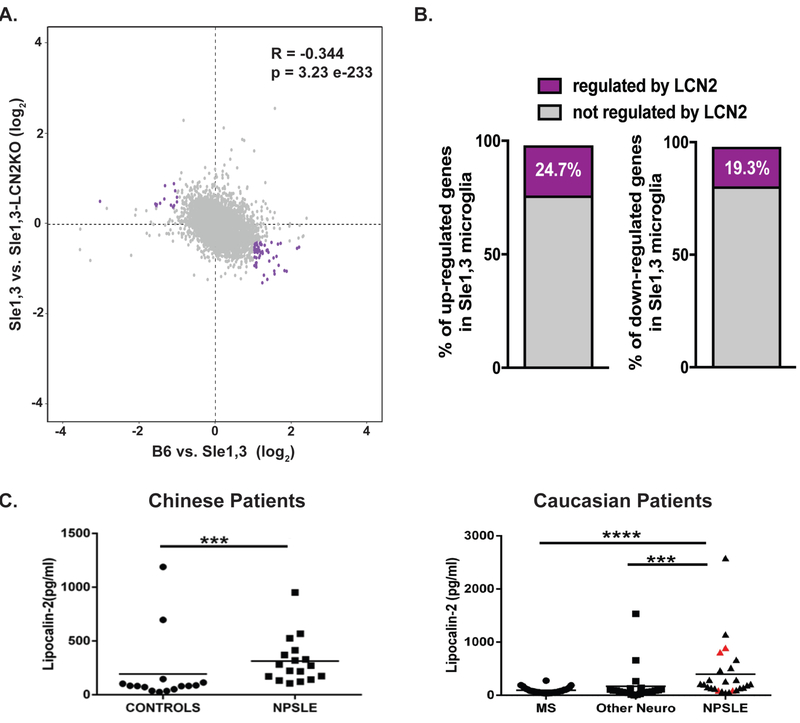
(A) Scatter plot of genes expressed by microglia (8435) displaying the log2 fold change in expression between B6 vs Sle1,3 (x axis) and Sle1,3 vs Sle1,3-LCN2KO microglia (y axis). Genes indicated in purple reflect those that are either increased or decreased in Sle1,3 microglia compared to B6 microglia by a fold change in expression >2 that are reversed by LCN2KO towards B6 levels by at least half the initial change in CPM values. (B) Percentage of genes either increased or decreased in expression in Sle1,3 microglia compared to B6 microglia with an adjusted p<0.1 (or a false discovery rate of 10%, as determined by DESeq2 Benjamin & Hochberg correction) and fold change in expression >2 that are reversed by LCN2KO towards B6 levels by at least half the initial change in CPM values (shown in purple). A complete list of differentially expressed genes is provided in Supplementary Table 4. (A-B) B6: n=4; Sle1,3: n=4; Sle1,3-LCN2KO: n=4; and LCN2KO: n=4. (C) LCN2 was quantified in the CSF of 2 cohorts of NPSLE patients and controls. Among the Caucasian patients, patients with neuropsychiatric symptoms attributable to SLE are represented by black triangles, while SLE patients with neuropsychiatric symptoms attributable to other primary causes are represented by red triangles. Dot plots were plotted using Prism 5 software. Mann Whitney U test was used to generate P values, comparing the protein level differences among the sample groups. * = p<0.05, ** = p < 0.01, *** = p < 0.001, **** = p < 0.0001.
2.12. Patient cohorts and CSF assays
CSF samples were obtained from two patient cohorts, one from Hong Kong, composed primarily of Chinese subjects, and one from Halifax, composed primarily of Caucasian subjects. The Hong Kong cohort comprised of 17 NPSLE patients and 15 control subjects; patient demographics are summarized in Supplementary Table 2. The control subjects in the Chinese cohort had been subjected to a spinal tap for other indications (e.g., headaches, suspected meningitis, altered state of consciousness) but did not have SLE or other autoimmune neurological diseases. The Halifax cohort comprised of 25 NPSLE patients and 54 disease controls; patient demographics are summarized in Supplementary Table 3. The 54 disease controls included 31 patients with definite or probable MS, 3 patients with ALS, and the rest with a variety of neurological diseases. In all subjects, CSF was collected via a spinal tap, as warranted by the subjects’ medical conditions, with informed consent. CSF samples were aliquoted and stored frozen at −70°C till the day of assay. Samples were spun down to remove cells and debris before assay. Samples that were contaminated with blood were not used. Lipocalin-2 in the CSF was measured using the Human Lipocalin-2 ELISA kit from Raybiotech, with CSF being diluted at a 1:5 dilution, following the manufacturer’s protocol. Dot plots and data analysis was conducted using Prism 5 software.
2.13. Statistical analysis
All statistical analysis was performed using GraphPad Prism software (La Jolla, CA) and JMP12 (SAS, Cary, NC). Normality was determined with the D’Agostino and Pearson normality test and, for most experiments, significant effects between groups of mice were determined by ANOVA or Kruskal Wallis test for normal or nonparametric data, respectively. The Dunn’s post-hoc analysis was performed to compare all groups to B6 controls or all groups to the lupus-prone Sle1,3 mice. Results are displayed as the mean±SEM of control versus treated. For the immunofluorescent and immunohistochemical staining studies, absolute cell number or mean fluorescent intensity was quantified when calculating the differences between the groups. In vitro experiments were performed on duplicate or triplicate samples, and were repeated at least once to ensure reproducibility. For all analyses, significance was defined as p <0.05.
2.14. Study approval
All animal study protocols were approved by the Institutional Animal Care and Use Committee at the Albert Einstein College of Medicine. All described human research was conducted with approvals from the respective Institutional Review Boards.
3. RESULTS
3.1. Sle1,3 mice exhibit deficits in exploratory behavior and motor coordination that are attenuated by LCN2 deficiency
To determine if Sle1,3 mice exhibit neurobehavioral deficits and the effects of LCN2 on this phenotype, B6 mice, Sle1,3 mice, Sle1,3-LCN2KO mice, and B6.LCN2KO (below referred to as LCN2KO) mice were assessed using a battery of validated neurobehavioral tests. First, mice were evaluated for general locomotor activity and other behaviors using a behavioral spectrometer at 4 to 6 months of age (young cohort) and at 7 to 10 months of age (old cohort). There were no significant differences in locomotor behaviors between B6 and Sle1,3 mice in either the younger (data not shown) or older cohort, including total track length (H=7.34, p=0.062, Figure 1A), time still (H=20.19, p=0.0003, B6 vs Sle1,3: p=0.13, Figure 1B), and time running (H=21.99, p>0.0001, B6 vs Sle1,3: p=0.12, Figure 1C). However, LCN2KO mice are more active than Sle1,3 mice, spending less time still (H=20.19, p=0.0003, Sle1,3 vs LCN2KO p=0.0017, Figure 1B) and more time running (H=21.99, p=0.0003, Sle1,3 vs LCN2KO p<0.0001, Figure 1C). Older Sle1,3 mice spent significantly less time rearing than B6 mice (F(3,32)=8.75, p=0.0002, B6 vs Sle1,3: p=0.024, Figure 1D), which is indicative of less exploratory behavior. Furthermore, there was no difference in time spent rearing between Sle1,3-LCN2KO and B6 mice F(3,32)=8.75, p=0.0002, B6 vs Sle1,3-LCN2KO: p=0.97, Figure 1D), suggesting that LCN2 deficiency ameliorates the observed exploration deficit.
Figure 1. Sle1,3 mice exhibit deficits in exploratory behavior and motor coordination that are attenuated by LCN2 deficiency.

(A-D) The duration of normal behaviors during the 9 minutes spent in the behavioral spectrometer were recorded by Viewer software. (A) Track length (B6: n=9; Sle1,3: n=10; Sle1,3-LCN2KO: n=5; and LCN2KO: n=9), (B) time spent still (B6: n=9; Sle1,3: n=11; Sle1,3-LCN2KO: n=5; and LCN2KO: n=11), and (C) time spent running (B6: n=9; Sle1,3: n=11; Sle1,3-LCN2KO: n=5; and LCN2KO: n=11) were assessed to determine if mice had normal locomotor behavior. (D) Time spent rearing, or standing on hind legs, an exploratory posture, were also assessed (B6: n=9; Sle1,3: n=11; Sle1,3-LCN2KO: n=5; and LCN2KO: n=11). (E) The number of slips while mice traversed a 1.2 cm beam was measured to assess motor coordination B6: n=5; Sle1,3: n=3; Sle1,3-LCN2KO: n=5; and LCN2KO: n=4. Mice were assessed at 7-10 months of age. Results are displayed as mean±SEM. *p<0.05, **p<0.01, and ****p<0.0001 by Kruskal-Wallis and post-hoc Dunn’s multiple comparisons test (A-C) or ANOVA and post-hoc Dunnett’s multiple comparisons test (D-E).
To examine motor coordination, mice were placed on a cylindrical beam, and the number of slips as the mice traversed the beam were counted. Young Sle1,3 mice exhibited a significant motor coordination deficit when compared with B6 controls, and there was a trend toward reduction of this deficit in the Sle1,3-LCN2KO mice (data not shown). Older Sle1,3 mice exhibit a greater deficit in the balance beam test (F(3,13)=66.38, p<0.0001), slipping almost 5 times more frequently than B6 controls (B6 vs Sle1,3 p<0.0001), with LCN2 deficiency significantly reducing this phenotype (Sle1,3 vs Sle1,3-LCN2KO p<0.0001, Figure 1E).
3.2. Sle1,3 mice exhibit anhedonia and cognitive dysfunction that is attenuated with LCN2 deficiency
Approximately 65% of NPSLE patients present with mood disorders, and depression is the most commonly reported affective disorder [43]. LCN2 is elevated in depressed patients [44], and is upregulated in mice exposed to stress where it inhibits neuronal growth and contributes directly to the depressive phenotype [20]. The saccharin preference test, which measures the integrity of the normal murine inclination toward saccharin-treated water, was performed at 7 months of age on Sle1,3 mice, Sle1,3-LCN2KO mice, and controls. Sle1,3 mice exhibited a reduction in preference for saccharin-treated water relative to B6 mice (F(3,20)=3.483, p=0.035, B6 vs Sle1,3 p=0.021, Figure 2A). This behavior is indicative of anhedonia, or deficient pleasure-seeking activity, which is consistent with depression-like behavior. Sle1,3-LCN2KO mice demonstrated a significantly restored preference when compared with Sle1,3 mice (Sle1,3 vs Sle1,3-LCN2KO p=0.01, Figure 2A), indicating that LCN2 deficiency ameliorates depression-like behavior.
Figure 2. Sle1,3 mice demonstrate cognitive and affective deficits that are ameliorated by LCN2 deficiency.

(A) Anhedonia was assessed by the saccharin preference test, and the amount of saccharin-treated water consumed was assessed as a percentage of total water consumption during the test. B6: n=8; Sle1,3: n=5; Sle1,3-LCN2KO: n=5; and LCN2KO: n=6. (B) Visuospatial and (C) recognition memory were assessed with the (B) object placement test and (C) object recognition test. The preference score of each mouse is reported as percent of total exploration time that is spent exploring (B) the object in a novel position, and (C) the novel object. Object placement test: B6: n=5; Sle1,3: n=6; Sle1,3-LCN2KO: n=8; and LCN2KO: n=4. Object recognition test: B6: n=9; Sle1,3: n=11; Sle1,3-LCN2KO: n=7; and LCN2KO: n=10. Results are displayed as mean±SEM. *p<0.05, **p<0.01 and ***p<0.001 by ANOVA and post-hoc Bonferroni’s multiple comparisons test (A) or post-hoc Dunnett’s multiple comparisons test (B-C).
Given that LCN2 is upregulated in elderly depressed patients with memory impairment [45], the effects of LCN2 on spatial and recognition memory were evaluated. In the object placement test, which measures a mouse’s preference for an object in a novel position, older Sle1,3 mice exhibited a significant reduction in preference for the relocated object when compared with B6 control mice (F(3,19)=8.81, p=0.0007, B6 vs Sle1,3 p=0.039, Figure 2B). This spatial memory deficit was reversed with LCN2 deficiency, with Sle1,3-LCN2KO mice demonstrating a preference for the newly positioned object that was similar to that of B6 controls and significantly increased when compared with Sle1,3 mice (Sle1,3 vs Sle1,3-LCN2KO p=0.0003, Figure 2B). Similarly, in the object recognition test, during which the preference for a new object introduced into the arena is measured, older Sle1,3 mice exhibited significantly less preference than B6 controls (F(3,33)=4.03, p=0.05, B6 vs Sle1,3 p=0.019, Figure 2C). Preference for the novel object was not impaired with LCN2 deficiency (B6 vs Sle1,3-LCN2KO p=0.098, Figure 2C), suggesting that LCN2 signaling is involved in the observed cognitive deficit. Furthermore, no cognitive deficits were observed in younger mice (data not shown), demonstrating the progressive nature of the disease. All subsequent experiments were therefore conducted in older mice.
3.3. Systemic lupus activity is not reduced with LCN2 deficiency
LCN2 can promote brain barrier disruption through activation of endothelial cells, disruption of tight junction proteins, and induction of chemotaxis of infiltrating leukocytes [46]. To determine if a reduction in extra-cranial disease may be contributing to the observed attenuation of the neuropsychiatric phenotype, systemic parameters, including autoantibody titers, splenomegaly, and renal pathology were assessed. As expected, older Sle1,3 mice demonstrate high anti-double stranded DNA (dsDNA) antibody titers when compared with B6 controls (F(3,14)=6.23, p=0.0066, B6 vs Sle1,3 p=0.029). However, Sle1,3-LCN2KO mice did not exhibit a significant reduction in serum anti-dsDNA antibodies (Sle1,3 vs Sle1,3-LCN2KO p=0.98, Figure 3A). Moreover, the splenomegaly present in Sle1,3 mice (F(3,15)=11.2, p=0.0004, B6 vs Sle1,3 p=0.044, Figure 3B) was also not reduced with LCN2 deficiency (Sle1,3 vs Sle1,3-LCN2KO p=0.50, Figure 3B).
Figure 3. Systemic disease burden is not reduced by LCN2 deficiency.

(A) Antibodies to double stranded DNA were assessed in serum diluted 1:3200 from mice at 7-10 months of age. Data were normalized and are shown as a percentage of positive control. B6: n=5; Sle1,3: n=4; Sle1,3-LCN2KO: n=5; and LCN2KO: n=4 (B) Spleen weight normalized to body weight was compared between groups to assess the presence of splenomegaly. B6: n=5; Sle1,3: n=4; Sle1,3- LCN2KO: n=5; and LCN2KO: n=5. (C-D) PAS stained kidney sections from 12-15-month old mice were scored blindly by an experienced nephropathologist on a scale of 0 to 4, where 0 was no apparent disease and 4 was the most severe. B6: n=3; Sle1,3: n=4; Sle1,3-LCN2KO: n=3; and LCN2KO: n=4. (C) Glomerular parameters assessed included sclerosis, deposits, and endocapillary proliferation. (D) Tubulo-interstitial parameters included tubular casts and dilatation and interstitial fibrosis and inflammation. The average score in glomerular (C) and tubulo-interstitial (D) pathology for each sample is shown. n=3-4/group. (E-F) Single-cell suspensions from hemisected brains were analyzed by flow cytometry to quantify populations of infiltrating (E) CD4+ T cells and (F) CD8+ T cells. B6: n=5; Sle1,3: n=4; Sle1,3-LCN2KO: n=5; and LCN2KO: n=5. Results are displayed as mean±SEM. *p<0.05 by ANOVA and post-hoc Dunnett’s multiple comparisons test (A-B) or by Kruskal-Wallis and post-hoc Dunn’s multiple comparisons test (C-F).
To investigate the effect of LCN2 on another key lupus manifestation in the Sle1,3 strain, the presence of renal disease was assessed in periodic acid-Shiff (PAS)-stained kidney sections from 12- to 15-month-old mice. In the glomerular compartment, Sle1,3 mice exhibited endocapillary proliferation (H=8.86, p=0.01, B6 vs Sle1,3 p=0.014) and immune complex deposition (H=8.31, p=0.019, B6 vs Sle1,3 p=0.015) when compared with B6 mice, but no measurable glomerular sclerosis (H=5.42, p=0.18, B6 vs Sle1,3 p=0.49; data not shown). Similar renal disease severity was present in Sle1,3 LCN2KO mice (endocapillary proliferation: Sle1,3 vs Sle1,3-LCN2KO p>0.99; immune deposits: Sle1,3 vs Sle1,3-LCN2KO p>0.99; data not shown). A combined score of all glomerular indices demonstrated a similar pattern (H=9.04, p=0.009, B6 vs Sle1,3 p=0.018; Sle1,3 vs Sle1,3-LCN2KO p>0.99, Figure 3C). Similarly, Sle1,3 exhibit tubular dilatation and casts when compared with B6 mice, and this was unaffected by LCN2 deficiency (H=8.45, p=0.016, B6 vs Sle1,3 p=0.026; Sle1,3 vs Sle1,3-LCN2KO p>0.99; data not shown). No interstitial inflammation or fibrosis was evident in any of the samples (interstitial inflammation: H=6.15, p=0.1; interstitial fibrosis H=5.42, p=0.18; data not shown). A combined score of all tubulointerstitial parameters reflects the presence of damage in Sle1,3 mice that is unchanged with LCN2 deficiency (H=9.98, p=0.003, B6 vs Sle1,3 p=0.011; Sle1,3 vs Sle1,3-LCN2KO p>0.99, Figure 3D).
Flow cytometry performed on brain cellular suspensions found significant infiltration of CD45+ cells (F(3,14)=20.86, p<0.0001; B6 vs Sle1,3 p=0.0003, data not shown), including CD4+ T cells (H=15.25, p=0.002: B6 vs Sle1,3 p=0.018, Figure 3E) and CD8+ T cells (H=14.4, p=0.0024: B6 vs Sle1,3 p=0.006, Figure 3F) in Sle1,3 mice when compared with B6 controls. Infiltration of peripheral immune cells was not reduced by LCN2 deficiency (infiltrating CD45+ cells, not shown; CD4+ T cells, CD8+ T cells: Sle1,3 vs Sle1,3 LCN2KO p>0.99, Figure 3E-F). The lack of systemic disease attenuation suggests that the effects on NPSLE seen by LCN2 deficiency are primarily the result of brain-specific pathways, rather than any decrease in systemic inflammation or brain infiltration by lymphocytes.
3.4. LCN2 and associated genes are upregulated in the brains of Slel,3 mice
To determine the effects of LCN2 on neuroinflammation, cortical expression of proinflammatory genes in older mice was determined by RT-PCR. LCN2 expression was increased >30 fold in samples from Sle1,3 mice when compared with B6 controls (F(3.9)=8.36, p=0.006; B6 vs Sle1,3 p=0.01, Figure 4A), consistent with a contribution of LCN2 to the NPSLE phenotype. MMP9, which complexes with LCN2 and is involved in aberrant synaptic plasticity, learning, and memory in patients [47] and animal models [48], was also significantly upregulated in Sle1,3 brains (H=7.96, p=0.024; B6 vs Sle1,3 p=0.03, Figure 4A). ICAM-1, an adhesion molecule involved in leukocyte transmigration during inflammation, was significantly elevated in Sle1,3 mice compared to B6 controls (H=10.4, p=0.0012; B6 vs Sle1,3 p=0.004, Figure 4A). Interestingly, CXCL10 (a.k.a. IP-10), a classic chemoattractant that can be protective or destructive based on the inflammatory context [49], was significantly elevated in the brains of Sle1,3-LCN2KO mice but not those from Sle1,3 mice or B6 LCN2KO mice (F(3,10)=4.28, p=0.035; B6 vs Sle1,3 p=0.91). In the hippocampus, LCN2 is also significantly upregulated in Sle1,3 mice (F(3,11)=77.46, p<0.0001; B6 vs Sle1,3 p=0.001, data not shown).
Figure 4. Effects of LCN2 on neuroinflammation.

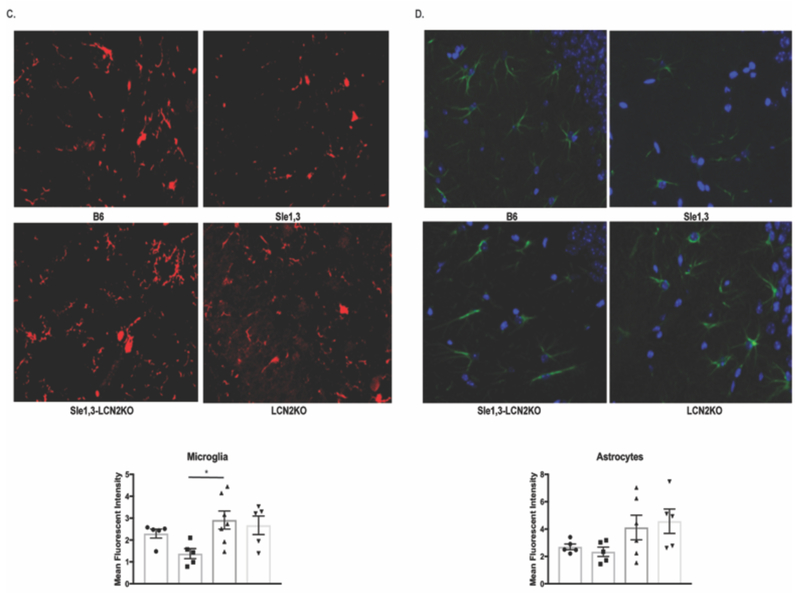
(A) Gene expression from cortical lysates were assessed by RT-PCR. LCN2: B6: n=3; Sle1,3: n=4; Sle1,3-LCN2KO: n=3; and LCN2KO: n=3; MMP9, CXCL10, and ICAM1: B6: n=3; Sle1,3: n=4; Sle1,3-LCN2KO: n=4; and LCN2KO: n=3. (B) Apoptosis was assessed in the dentate gyrus of the hippocampus by TUNEL at 20x magnification. The total number of TUNEL-positive cells and the number of apoptotic microglia and neurons were assessed. (C) Iba-1 and (D) GFAP staining was performed to assess (C) microglia and (D) astrocyte morphology and density. (B-C): B6: n=5; Sle1,3: n=5; Sle1,3-LCN2KO: n=7; and LCN2KO: n=5. (D): B6: n=5; Sle1,3: n=5; Sle1,3-LCN2KO: n=6; and LCN2KO: n=5. Representative images and mean fluorescent intensity are shown. Results are displayed as mean±SEM. *p<0.05, **p<0.01 and ***p<0.001 by ANOVA and post-hoc Dunnett’s multiple comparisons test (A: LCN2 and CXCL10; B: neuronal apoptosis; C-D) or by Kruskal-Wallis and post-hoc Dunn’s multiple comparisons test (A: MMP9 and ICAM-1; B: apoptosis and microglia apoptosis).
3.5. LCN2 deficiency reduces brain apoptosis and microglial activation in Sle1,3 mice
Within the CNS, LCN2 promotes apoptosis of astrocytes [24], microglia [23], and neurons [25]. Moreover, elevated levels of LCN2 during inflammation results in increased apoptosis of activated microglia in a manner similar to activation-induced cell death in lymphocytes [23]. We therefore postulated that LCN2 deficiency would lead to a reduction of apoptosis in lupus-prone Sle1,3 mice, and assessed the effects of LCN2 deficiency on apoptosis through terminal deoxyribonucleotidyl transferase dUTP nick end labeling (TUNEL). We focused on the dentate gyrus of the hippocampus, a region known to be involved in emotionality and affected by LCN2 [20], and found a significant increase in TUNEL-positive cells in Sle1,3 mice when compared with B6 controls (F(3,18)=14.23, p<0.0001; B6 vs Sle1,3 p=0.0002, Figure 4B). Moreover, the number of apoptotic cells was significantly decreased in Sle1,3-LCN2KO mice, confirming a reduction of apoptosis with LCN2 deficiency (Sle1,3 vs Sle1,3-LCN2KO p=0.0001, Figure 4B). Co-staining of TUNEL-positive cells with Iba1 and NeuN to identify microglia and neurons, respectively, revealed that numerically most of the cells undergoing apoptosis were microglia; increased numbers of apoptotic microglia in Sle1,3 mice (H=8.01, p=0.046, B6 vs Sle1,3 p=0.04, Figure 4B) which trended to normalize in the Sle1,3-LCN2KO strain (Sle1,3 vs Sle1,3-LCN2KO p=0.053, Figure 4B) was observed. Interestingly, neuronal apoptosis was also increased in Sle1,3 mice (F(3,18)=7.18, p=0.002, B6 vs Sle1,3 p=0.01, Figure 4B), with a significant reduction in apoptotic neurons found in the Sle1,3-LCN2KO strain (Sle1,3 vs Sle1,3-LCN2KO p=0.003, Figure 4B). This suggests that LCN2 deficiency results in preservation of parenchymal cells, which potentially contributes to the improved neurobehavioral profile.
Given that LCN2 is involved in the activation and deramification of glia, we looked for morphological changes between the Sle1,3 mice and their LCN2-deficient counterparts. Iba-1 staining was performed on brain sections, and the hippocampus was assessed in each group. We found a preponderance of ameboid microglia in Sle1,3 mice and a more ramified morphology in the Sle1,3-LCN2KO samples (Figure 4C). Quantification of mean fluorescence intensity of Iba-1 staining showed some reduction of the intensity score in Sle1,3 mice that could be a result of increased apoptotic sensitivity because of the high levels of LCN2 (F(3,17)=3.59, p=0.036; B6 vs Sle1,3 p=0.15). Sle1,3-LCN2KO samples showed a significant increase in Iba-1 intensity when compared with Sle1,3 (Sle1,3 vs Sle1,3-LCN2KO p=0.016, Figure 4C), indicative of less apoptosis and/or more ramifications being captured. GFAP staining for astrocytes was performed to determine if LCN2 resulted in extension of astrocytic cell processes indicative of activation. However, no obvious morphological changes were evident between the groups, with no significant difference in GFAP intensity (F(3,17)=2.34, p=0.11, Figure 4D).
3.6. Sle1,3 microglia exhibit aberrant expression of genes associated with cognition and immune processes that are rescued by LCN2 deficiency
Given the reversal in microglia phenotype observed in the Sle1,3-LCN2KO mice, we postulated that microglia would exhibit differential regulation of genes between the different strains. Gene expression profiles of fluorescence-activated cell sorting (FACS)-purified CD11b+ CD64+ CD45-low microglia from hemisected brains from each genotype were assessed. Principal component analysis (PCA) was performed to assess the overall similarity between samples, revealing a clear separation between samples and a distinct grouping by genotypes (Figure 5A). K-means clustering (K=6; Figure 5B) of the 1467 differentially expressed genes (p<0.05, compared across any two of the strains) yielded six main categories: genes that were associated with Sle1,3 disease independent of LCN2 in Clusters 0 and 4 (Sle1,3-related signature); genes that were regulated by LCN2 independent of disease in Clusters 1, 2 and 3 (LCN2-regulated genes), and genes that were regulated by both Sle1,3 and LCN2 in Cluster 5 (NPSLE signature).
Figure 5. LCN2 deficiency restores expression of genes that regulate cognition and learning.
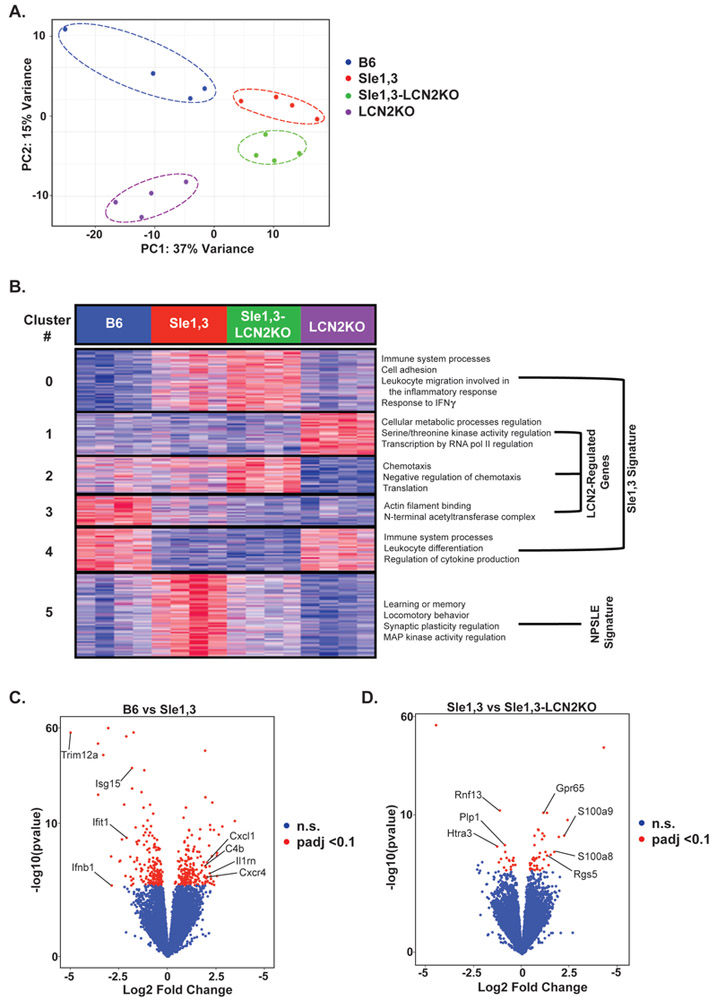
FACS-purified microglia from 7-10-month old mice were used for RNA sequencing. (A) Principal component analysis (PCA) shows clustering of samples by genotype. (B) Heatmap of K-means (K=6) clustering on 1467 differential genes determined by ANOVA (p<0.05) and corresponding GO processes from each cluster. GO analysis revealed increased expression of genes involved in cognition and signal transduction in Sle1,3 microglia that was restored in Sle1,3-LCN2KO microglia (cluster 5). (C-D) Volcano plot of differentially expressed genes with an adjusted p<0.1 (or a false discovery rate of 10%, as determined by DESeq2 Benjamin & Hochberg correction) between BL/6 and Sle1,3 microglia (C) and Sle1,3 and Sle1,3-LCN2KO microglia (D) are shown in red. A complete list of differentially expressed genes is provided in Supplementary Table 4. Genes of particular interest are specified in the Figure. B6: n=4; Sle1,3: n=4; Sle1,3-LCN2KO: n=4; and LCN2KO: n=4.
The Sle1,3-related signature, which consists of genes differentially expressed in Sle1,3 microglia when compared with B6, includes genes that were either upregulated (Cluster 0) or downregulated (Cluster 4) in Sle1,3 microglia independent of LCN2. Cluster 0 includes several enriched Gene Ontology (GO) terms involved in the immune response, including immune system processes (p<4.58×10⁻⁶), cell adhesion (p<1.71×10⁻⁴), leukocyte migration involved in the inflammatory response (p<1.88×10⁻⁴), and response to interferon-gamma (p<1.71×10⁻⁴). Another GO term of interest is S100b protein binding (p<3.62×10⁻⁷), given that S100b is associated with cognitive impairment in SLE patients [50]. GO terms enriched in cluster 4 include other immune system processes (p<4.58×10⁻⁶), including several interferon response genes, leukocyte differentiation (p<4.43×10⁻⁵), and regulation of cytokine production (p<1.54×10⁻⁴). These Sle1,3- related changes suggest that there is specific regulation of immune-related genes in microglia that contributes to the observed disease phenotype.
LCN2-regulated genes, represented in clusters 1, 2, and 3, are differentially regulated as a result of LCN2 deficiency irrespective of disease state. Cluster 1 consists of genes downregulated by LCN2, and GO terms include regulation of cellular metabolic process (p<1.06×10⁻⁶), regulation of protein serine/threonine kinase activity (p<7.l6×10−5), and regulation of transcription by RNA polymerase II (p<6.46×10⁻⁷). This is consistent with the role of LCN2 in regulating metabolism and homeostasis [6]; nevertheless, these genes were not differentially expressed between B6 and Sle1,3, and therefore are probably unrelated to pathogenesis. In cluster 2, the expression pattern is opposite to that of cluster 1, and these genes are enriched in microglia from all strains except in LCN2KO mice. GO terms include chemotaxis (p<5.03×10⁻⁴), negative regulation of chemotaxis (p<2.41×10⁻¹), and translation (p<5.42×10⁻¹⁰). Cluster 3 includes genes that are downregulated in Sle1,3 microglia but are upregulated by LCN2. GO terms include actin filament binding (p<7.69×10⁻⁴) and the N-terminal acetyltransferase (NatC) complex (p<9.16×10⁻⁴).
Cluster 5, the NPSLE signature cluster, consists of genes upregulated in Sle1,3 microglia when compared with B6, that are restored to B6 levels in Sle1,3-LCN2KO microglia. When compared with total expressed genes, genes within this cluster were associated with several pathways related to NPSLE, including learning or memory (p<2.70×10⁻⁴), locomotory behavior (p<3.32×10⁻⁵), and regulation of synaptic plasticity (p<4.32×10⁻⁴). Signal transducer activity (p<6.94×10⁻⁴) and regulation of MAP kinase activity (p<2.03×10⁻⁴) were also among the enriched GO terms in this cluster (Figure 5B).
To evaluate the pathways altered in Sle1,3 microglia, differentially expressed genes (331) between B6 and Sle1,3 microglia were determined with a false discovery rate (FDR) of 10%. Ifnb and several genes induced by interferons, including Isgl5, Ifitl, and Triml2a, were downregulated by at least 2-fold in Sle1,3 microglia when compared with B6 (Figure 5C; Supplementary Table 4). Moreover, several classical immune genes, including chemokine-associated Cxcl1 and Cxcr4, complement-associated C4b, and immunomodulator IL1rn were upregulated by greater than 2-fold in Sle1,3 microglia when compared with B6. This expression profile is indicative of the chronic inflammatory environment in the lupus-prone Sle1,3 brain when compared with non-autoimmune B6 controls.
Sle1,3-LCN2KO mice demonstrated attenuation in several neurobehavioral deficits exhibited by their Sle1,3 counterparts. Correspondingly, genes downregulated by at least 2-fold in Sle1,3-LCN2KO microglia compared to Sle1,3 microglia include Rnf13, which induces apoptosis [51], and Htra3, which inhibits TGF-beta, a known inducer of LCN2 [52] (Figure 5D; Supplementary Table 4). Plp1, a promoter of microglial cell activation [53], was also significantly downregulated in Sle1,3-LCN2KO microglia. Genes upregulated by greater than 2-fold include those involved in G protein signaling, such as Gpr65 and Rgs5, and S100a8 and S100a9, which are involved in TLR4 binding.
3.7. LCN2 regulates gene pathways differentially expressed in diseased microglia
To determine whether the gene pathways affected in Sle1,3 are regulated by LCN2, we compared the differentially expressed genes between BL/6 and Sle1,3 with those between Sle1,3 and Sle1,3-LCNKO. We found that the fold change in gene expression was negatively correlated (R=−0.344) between these pairwise comparisons (Figure 6A). Similarly, of the 186 genes that were up-regulated in Sle1,3 compared to B6, 46 (24.7%) were reduced by deletion of LCN2 (Figure 6B; Supplementary Table 4). Genes of interest include Mal, which is required for TLR4 signaling [54], Apod, a key gene in learning and memory [55], and Plpl, involved in microglial activation [53]. Furthermore, of the 145 genes that were down-regulated in Sle1,3 compared to B6, 28 (19.3%) were elevated by deletion of LCN2 (Figure 6B; Supplementary Table 4). Most notable were Daxx, a regulator of apoptosis [56], and Rsad2, an interferon-stimulated gene [57].
3.8. LCN2 is upregulated in the cerebrospinal fluid of NPSLE patients
To establish the relevance of LCN2 to human disease, LCN2 was measured in the cerebrospinal fluid (CSF) of patients with NPSLE and healthy controls. Ethnically Chinese patients with NPSLE exhibited significantly elevated LCN2 levels in the CSF of NPSLE patients compared to the control subjects, as shown in Figure 6C (left panel), with an area under the curve (AUC) value of 0.85 (p < 0.0007). To validate these findings in an independent cohort of a different ethnicity and to ascertain the specificity of this biomarker, we turned to another cohort comprised of Caucasian NPSLE patients, MS controls, and subjects with other neurological conditions. In this cohort, SLE patients with neuropsychiatric events had significantly higher CSF LCN2 levels compared to patients with MS (AUC=0.83, p<0.0001) and also when compared to patients with other neurological diseases (AUC=0.8, p<0.0004), as displayed in Figure 6C (right). Among the SLE patients with neuropsychiatric events, these were attributed to causes other than SLE in seven subjects, as indicated by the red triangles. However, three of these patients also had NP events attributed to SLE. As is apparent from Figure 6C, CSF LCN2 did not distinguish between neuropsychiatric events in lupus patients attributed to SLE or other causes, although the number of available samples may not have been sufficiently large to detect a difference. Interestingly, two control subjects with “other neurological diseases” exhibited significantly elevated CSF LCN2; of these, one had diabetic neuropathy, while the other had progressive multifocal leukoencephalopathy. In both the Chinese and Caucasian patient cohorts, CSF LCN2 was not associated with any particular manifestation of NPSLE (data not shown).
4. DISCUSSION
The pathophysiology of diffuse NPSLE is not fully understood, and as such current treatments are based largely on immunosuppressive drugs rather than directed against a specific, modifiable target [4]. Here, we investigated the effects of LCN2 on the development of neuropsychiatric disease in lupus-prone Sle1,3 mice to shed light on major regulators of the neuroinflammatory cascade in NPSLE. Sle1,3 mice exhibit reduced exploratory behavior, lack of motor coordination, anhedonia, and spatial and recognition memory deficits, all of which are attenuated by LCN2 deficiency. This is consistent with findings in a model of intracerebral hemorrhage in which LCN2KO mice exhibit fewer neurological deficits [58]. Moreover, LCN2 is upregulated in patients with depression [43] and memory impairment [44], and a reduction in LCN2 may have beneficial effects. However, there have been conflicting reports about the effect of LCN2 deficiency on behavior, and some groups report heightened stress-induced anxiety [20] and worse cognitive impairment after LPS challenge [14]. These seemingly conflicting results could be indicative of LCN2 function embodying a U-shaped curve [59], in which too much or too little LCN2 can be detrimental and its effects are largely dependent on the inflammatory context. Here, in a disease state where LCN2 is already chronically elevated, namely NPSLE, deficiency is on balance beneficial.
Despite all of the known effects of LCN2 on innate immunity and signaling, LCN2 deficiency, surprisingly, had no effect on systemic disease burden in the Sle1,3 strain (i.e. splenomegaly and autoantibody titers), and renal pathology indices remain unchanged. This is in contrast with our previous findings in pristane-induced autoimmunity, where LCN2 deficient mice exhibited reduced kidney damage [60]. Again, given LCN2’s context-specific effects, parallels cannot necessarily be drawn between the more intense and prolonged chronic inflammation that resulted in kidney damage in lupus-prone Sle1,3 mice and the response to a single pristane injection in a non-autoimmune strain. Furthermore, several redundant inflammatory pathways can compensate for the lack of LCN2 in the periphery and result in similar downstream signaling. Such pathways and the lack of effect on systemic disease can also explain the fact that Sle1,3-LCN2KO mice did not exhibit a reduction in peripheral leukocyte infiltration into the CNS.
Gene expression analysis in the cortex of age-matched mice by RT-PCR revealed a >30-fold increase in LCN2 in Sle1,3 mice, consistent with a role for LCN2 in promoting the development of neuropsychiatric deficits, and in resonance with the findings from human NPSLE, where CSF LCN2 was significantly elevated. MMP9, a known mediator of brain barrier disruption [61] was also upregulated in Sle1,3 mice. This points to a potential detrimental role of the LCN2/MMP9 complex that protects MMP9 from degradation [46] in the neuropathology seen in Sle1,3 mice. Interestingly, CXCL10 was upregulated in Sle1,3-LCN2KO mice and unchanged in Sle1,3 mice. Kang et al. saw a similar increase in CXCL10 gene expression in LCN2KO mice, suggesting that LCN2 protects the brain in response to systemic inflammation [29]. Despite the reputation of CXCL10 as a classic chemoattractant, recent studies have demonstrated a potential protective role in the context of chronic neuroinflammation [49], and CXCL10-deficient mice have more severe EAE following disease induction.
A striking finding in Sle1,3 mice was the reduction in Iba-1 positive microglia and the increased frequency of activated amoeboid morphology. LCN2 is believed to promote apoptotic sensitivity in a self-regulating pattern similar in activation-induced cell death in lymphocytes, safely removing activated microglia from sites of inflammation [23]. However, in the case of chronically elevated LCN2, this process could become detrimental to microglial homeostasis. Sle1,3-LCN2KO mice exhibit more ramified microglia, and ramification is known to be crucial to microglial surveillance of the neuroimmune environment and the ability of these cells to support synaptic and structural plasticity essential for normal cognition [62].
Transcriptional profiling of sorted microglia allowed for a comprehensive look at the gene expression profile in each genotype. Notably, several gene ontology processes related to neuropsychiatric behavior were enriched in Sle1,3 mice compared to B6 controls and normalized in Sle1,3-LCN2KO mice. These processes included learning and memory, synaptic plasticity, and locomotor behavior, which correlate well with the improvements in cognitive function, depression-like behavior, and motor coordination seen in the Sle1,3-LCN2KO mice. One gene of interest, Plp1, was shown to be specifically regulated by LCN2. Overexpression of Plpl is associated with aberrant microglial activation and downstream proinflammatory signaling [53], and downregulation of this gene in the Sle1,3-LCNKO mice may have contributed to the improved neurobehavioral profile observed.
Another novel aspect of our study is the finding that CSF LCN2 is significantly elevated in NPSLE patients from two different ethnic groups, in contrast to CSF levels from patients with MS or a wide spectrum of other neurological diseases. Given the dearth of CSF (or blood) biomarkers that can help distinguish NPSLE from other neurological conditions, CSF LCN2 emerges as a potential diagnostic marker of NPSLE.
It is interesting that only a subset of the NPSLE patients demonstrated high CSF LCN2 levels. However, NPSLE is clinically heterogeneous, and it is therefore very unlikely that a single mediator/biomarker would be associated/responsible for all manifestations. Additional studies in larger human cohorts will be required to determine if LCN2 is associated with a particular subset of NPSLE. Moreover, in the human studies we were unable to determine the change over time in CSF LCN2 levels which would have required repeated CSF sampling over a short period. As these samples were acquired only when clinically indicated, this was not feasible. In any case, given that a substantial fraction of NPSLE patients have normal levels of CSF LCN2 (Fig. 6C), the utility of this test might lie in its positive predictive value, rather than for ruling out NPSLE.
The CSF controls in the Chinese cohort were from patients who were admitted for suspected subarachnoid hemorrhage or meningitis (e.g. presenting with headache or fever) but turned out to have no central nervous system disease after the lumbar puncture and other imaging studies. Some of these controls might have had other medical illnesses such as diabetes mellitus or hypertension, but they did not have evidence of autoimmune and/or demyelinating disease of the central or peripheral nervous system. For ethical and practical considerations, CSF samples from NPSLE patients in remission and completely healthy controls (i.e. without neurologic complaints or co-morbid conditions) were not studied. Therefore, we feel the controls chosen for this study were the best that could be realistically obtained, especially since we compared LCN2 CSF levels in NPSLE to that of patients both with and without neurologic disease. In any case, we are currently expanding our CSF collections on MS patients and other controls, in order to further examine the specificity of CSF LCN2 for NPSLE.
One limitation of our study is the specific focus on microglia, despite the fact that several cell types within the CNS produce LCN2 and/or express LCN2 receptors. Future studies will be aimed at understanding the effects of LCN2 deficiency on expression profiles of astrocytes, neurons, and endothelial cells. Furthermore, LCN2 deficiency was only assessed in the Sle1,3 strain, and the number of mice studied for each strain was not large. Nevertheless, while breeding difficulties prevented further expansion of the experimental cohorts, the results in the different studies were consistent and support our conclusions. Further work will be focused on investigating the effects of LCN2 in other murine models of lupus to verify that the contribution of LCN2 to NPSLE is not strain-specific.
5. CONCLUSIONS
Our study has identified the Sle1,3 strain as a model of neuropsychiatric disease that exhibits cognitive and affective behavioral deficits. Additionally, we have performed the first analysis of the effects of LCN2 on NPSLE from the behavioral to the transcriptome level, and we have identified key genes, including MMP9 and Plpl, that are regulated by LCN2. Moreover, LCN2 is hyper-expressed within the brain in murine NPSLE, and within the CSF in human NPSLE, where it appears to be relatively specific for NPSLE. This is also the first demonstration of a molecule that is essential for the neuropsychiatric manifestations of lupus, but not for the systemic or renal manifestations of lupus. Taken together, these findings establish LCN2 as a key mediator of NPSLE, and further investigation of its signaling effects is warranted to target the pathway therapeutically.
Supplementary Material
Highlights.
Lipocalin-2 (LCN2) has been implicated in neuroinflammation;
Sle1,3 lupus mice display depression and altered cognition;
Neuropsychiatric deficits are attenuated in LCN2 knockout lupus mice;
LCN2 in the CSF is a novel biomarker for neuropsychiatric lupus.
ACKNOWLEDGEMENTS
We thank the staff of the Einstein histopathology core for their assistance in tissue sectioning, the Northwestern University Robert H. Lurie Cancer Center Comprehensive Flow Core Facility for providing the sorter, and the Northwestern University Next Generation Sequencing for generating the sequencing data.
FUNDING
These studies were supported by training grant T32-GM007288 to E. Mike from the NIH; a NIH Research Supplement to Promote Diversity in Health-Related Research (3R01AR065594-02W1) to E. Mike; a K01 grant from the National Institute of Arthritis and Musculoskeletal Diseases (5K01AR060169) to C.M. Cuda; a training grant T32-AR007611 to H.M. Makinde from the National Institute of Arthritis and Musculoskeletal Diseases; a grant in support of the Rose F. Kennedy Intellectual and Developmental Disabilities Research Center 5U54 HD090260-02 to M. Gulinello; a R01 grant from the National Institute of Arthritis and Musculoskeletal Diseases (3R01AR065594) to C. Putterman; and funding support from the Lupus Research Institute to C. Mohan.
Footnotes
STATEMENT OF COMPETING FINANCIAL INTERESTS
None.
Publisher's Disclaimer: This is a PDF file of an unedited manuscript that has been accepted for publication. As a service to our customers we are providing this early version of the manuscript. The manuscript will undergo copyediting, typesetting, and review of the resulting proof before it is published in its final citable form. Please note that during the production process errors may be discovered which could affect the content, and all legal disclaimers that apply to the journal pertain.
REFERENCES
- [1].Rees F, Doherty M, Grainge MJ, Lanyon P, Zhang W. The worldwide incidence and prevalence of systemic lupus erythematosus: a systematic review of epidemiological studies. Rheumatology (Oxford), 2017;56:1945–61. [DOI] [PubMed] [Google Scholar]
- [2].Izmirly PM, Wan I, Sahl S, Buyon JP, Belmont HM, Salmon JE et al. The Incidence and Prevalence of Systemic Lupus Erythematosus in New York County (Manhattan), New York: The Manhattan Lupus Surveillance Program. Arthritis Rheumatol, 2017;69:2006–17. [DOI] [PMC free article] [PubMed] [Google Scholar]
- [3].Kivity S, Agmon-Levin N, Zandman-Goddard G, Chapman J, Shoenfeld Y. Neuropsychiatric lupus: a mosaic of clinical presentations. BMC medicine, 2015;13:43. [DOI] [PMC free article] [PubMed] [Google Scholar]
- [4].Hanly JG. Diagnosis and management of neuropsychiatric SLE. Nature reviews Rheumatology, 2014;10:338–47. [DOI] [PubMed] [Google Scholar]
- [5].Kjeldsen L, Johnsen AH, Sengelov H, Borregaard N. Isolation and primary structure of NGAL, a novel protein associated with human neutrophil gelatinase. J Biol Chem, 1993;268:10425–32. [PubMed] [Google Scholar]
- [6].Ferreira AC, Da Mesquita S, Sousa JC, Correia-Neves M, Sousa N, Palha JA et al. From the periphery to the brain: Lipocalin-2, a friend or foe? Progress in neurobiology, 2015;131:120–36. [DOI] [PubMed] [Google Scholar]
- [7].Goetz DH, Holmes MA, Borregaard N, Bluhm ME, Raymond KN, Strong RK. The neutrophil lipocalin NGAL is a bacteriostatic agent that interferes with siderophore- mediated iron acquisition. Mol Cell, 2002;10:1033–43. [DOI] [PubMed] [Google Scholar]
- [8].Ferreira MC, Whibley N, Mamo AJ, Siebenlist U, Chan YR, Gaffen SL. Interleukin-17- induced protein lipocalin 2 is dispensable for immunity to oral candidiasis. Infect Immun, 2014;82:1030–5. [DOI] [PMC free article] [PubMed] [Google Scholar]
- [9].Zhao H, Konishi A, Fujita Y, Yagi M, Ohata K, Aoshi T et al. Lipocalin 2 bolsters innate and adaptive immune responses to blood-stage malaria infection by reinforcing host iron metabolism. Cell Host Microbe, 2012;12:705–16. [DOI] [PubMed] [Google Scholar]
- [10].Kjeldsen L, Cowland JB, Borregaard N. Human neutrophil gelatinase-associated lipocalin and homologous proteins in rat and mouse. Biochim Biophys Acta, 2000;1482:272–83. [DOI] [PubMed] [Google Scholar]
- [11].Cowland JB, Sorensen OE, Sehested M, Borregaard N. Neutrophil gelatinase-associated lipocalin is up-regulated in human epithelial cells by IL-1 beta, but not by TNF-alpha. J Immunol, 2003;171:6630–9. [DOI] [PubMed] [Google Scholar]
- [12].Meheus LA, Fransen LM, Raymackers JG, Blockx HA, Van Beeumen JJ, Van Bun SM et al. Identification by microsequencing of lipopolysaccharide-induced proteins secreted by mouse macrophages. J Immunol, 1993;151: 1535–47. [PubMed] [Google Scholar]
- [13].Flo TH, Smith KD, Sato S, Rodriguez DJ, Holmes MA, Strong RK et al. Lipocalin 2 mediates an innate immune response to bacterial infection by sequestrating iron. Nature, 2004;432:917–21. [DOI] [PubMed] [Google Scholar]
- [14].Ferreira AC, Pinto V, Da Mesquita S, Novais A, Sousa JC, Correia-Neves M et al. Lipocalin-2 is involved in emotional behaviors and cognitive function. Front Cell Neurosci, 2013;7:122. [DOI] [PMC free article] [PubMed] [Google Scholar]
- [15].Rubinstein T, Pitashny M, Putterman C. The novel role of neutrophil gelatinase-B associated lipocalin (NGAL)/Lipocalin-2 as a biomarker for lupus nephritis. Autoimmun Rev, 2008;7:229–34. [DOI] [PubMed] [Google Scholar]
- [16].Li YN, Hu FL, Dai YJ, Li R, Ma XX, Du Y et al. Serum anti-lipocalin 2 IgG is a novel biomarker in the diagnosis of systemic lupus erythematosus. Lupus, 2014;23:868–75. [DOI] [PubMed] [Google Scholar]
- [17].Ip JP, Nocon AL, Hofer MJ, Lim SL, Muller M, Campbell IL. Lipocalin 2 in the central nervous system host response to systemic lipopolysaccharide administration. J Neuroinflammation, 2011;8:124. [DOI] [PMC free article] [PubMed] [Google Scholar]
- [18].Marques F, Rodrigues AJ, Sousa JC, Coppola G, Geschwind DH, Sousa N et al. Lipocalin 2 is a choroid plexus acute-phase protein. J Cereb Blood Flow Metab, 2008;28:450–5. [DOI] [PubMed] [Google Scholar]
- [19].Bi F, Huang C, Tong J, Qiu G, Huang B, Wu Q et al. Reactive astrocytes secrete lcn2 to promote neuron death. Proc Natl Acad Sci U S A, 2013;110:4069–74. [DOI] [PMC free article] [PubMed] [Google Scholar]
- [20].Mucha M, Skrzypiec AE, Schiavon E, Attwood BK, Kucerova E, Pawlak R. Lipocalin-2 controls neuronal excitability and anxiety by regulating dendritic spine formation and maturation. Proc Natl Acad Sci U S A, 2011;108:18436–41. [DOI] [PMC free article] [PubMed] [Google Scholar]
- [21].Jin M, Kim JH, Jang E, Lee YM, Soo Han H, Woo DK et al. Lipocalin-2 deficiency attenuates neuroinflammation and brain injury after transient middle cerebral artery occlusion in mice. Journal of cerebral blood flow and metabolism : official journal of the International Society of Cerebral Blood Flow and Metabolism, 2014;34:1306–14. [DOI] [PMC free article] [PubMed] [Google Scholar]
- [22].Lee S, Kim JH, Kim JH, Seo JW, Han HS, Lee WH et al. Lipocalin-2 Is a chemokine inducer in the central nervous system: role of chemokine ligand 10 (CXCL10) in lipocalin-2-induced cell migration. J Biol Chem, 2011;286:43855–70. [DOI] [PMC free article] [PubMed] [Google Scholar]
- [23].Lee S, Lee J, Kim S, Park JY, Lee WH, Mori K et al. A dual role of lipocalin 2 in the apoptosis and deramification of activated microglia. J Immunol, 2007;179:3231–41. [DOI] [PubMed] [Google Scholar]
- [24].Lee S, Park JY, Lee WH, Kim H, Park HC, Mori K et al. Lipocalin-2 is an autocrine mediator of reactive astrocytosis. J Neurosci, 2009;29:234–49. [DOI] [PMC free article] [PubMed] [Google Scholar]
- [25].Lee S, Lee WH, Lee MS, Mori K, Suk K. Regulation by lipocalin-2 of neuronal cell death, migration, and morphology. Journal of neuroscience research, 2012;90:540–50. [DOI] [PubMed] [Google Scholar]
- [26].Rathore KI, Berard JL, Redensek A, Chierzi S, Lopez-Vales R, Santos M et al. Lipocalin 2 plays an immunomodulatory role and has detrimental effects after spinal cord injury. J Neurosci, 2011;31:13412–9. [DOI] [PMC free article] [PubMed] [Google Scholar]
- [27].Nam Y, Kim JH, Seo M, Kim JH, Jin M, Jeon S et al. Lipocalin-2 protein deficiency ameliorates experimental autoimmune encephalomyelitis: the pathogenic role of lipocalin-2 in the central nervous system and peripheral lymphoid tissues. The Journal of biological chemistry, 2014;289:16773–89. [DOI] [PMC free article] [PubMed] [Google Scholar]
- [28].Berard JL, Zarruk JG, Arbour N, Prat A, Yong VW, Jacques FH et al. Lipocalin 2 is a novel immune mediator of experimental autoimmune encephalomyelitis pathogenesis and is modulated in multiple sclerosis. Glia, 2012;60:1145–59. [DOI] [PubMed] [Google Scholar]
- [29].Kang SS, Ren Y, Liu CC, Kurti A, Baker KE, Bu G et al. Lipocalin-2 protects the brain during inflammatory conditions. Mol Psychiatry, 2017. [DOI] [PMC free article] [PubMed] [Google Scholar]
- [30].Morel L, Mohan C, Yu Y, Croker BP, Tian N, Deng A et al. Functional dissection of systemic lupus erythematosus using congenic mouse strains. J Immunol, 1997;158:6019–28. [PubMed] [Google Scholar]
- [31].Mohan C, Morel L, Yang P, Watanabe H, Croker B, Gilkeson G et al. Genetic dissection of lupus pathogenesis: a recipe for nephrophilic autoantibodies. J Clin Invest, 1999;103:1685–95. [DOI] [PMC free article] [PubMed] [Google Scholar]
- [32].Kier AB. Clinical neurology and brain histopathology in NZB/NZW F1 lupus mice. J Comp Pathol, 1990;102:165–77. [DOI] [PubMed] [Google Scholar]
- [33].Gao HX, Campbell SR, Cui MH, Zong P, Hee-Hwang J, Gulinello M et al. Depression is an early disease manifestation in lupus-prone MRL/lpr mice. Journal of neuroimmunology, 2009;207:45–56. [DOI] [PMC free article] [PubMed] [Google Scholar]
- [34].Sakic B, Szechtman H, Talangbayan H, Denburg SD, Carbotte RM, Denburg JA. Disturbed emotionality in autoimmune MRL-lpr mice. Physiol Behav, 1994;56:609–17. [DOI] [PubMed] [Google Scholar]
- [35].Gulinello M, Putterman C. The MRL/lpr mouse strain as a model for neuropsychiatric systemic lupus erythematosus. J Biomed Biotechnol, 2011;2011:207504. [DOI] [PMC free article] [PubMed] [Google Scholar]
- [36].Ballok DA, Ma X, Denburg JA, Arsenault L, Sakic B. Ibuprofen fails to prevent brain pathology in a model of neuropsychiatric lupus. J Rheumatol, 2006;33:2199–213. [PMC free article] [PubMed] [Google Scholar]
- [37].Brodkin J, Frank D, Grippo R, Hausfater M, Gulinello M, Achterholt N et al. Validation and implementation of a novel high-throughput behavioral phenotyping instrument for mice. J Neurosci Methods, 2014;224:48–57. [DOI] [PMC free article] [PubMed] [Google Scholar]
- [38].Bachmanov AA, Tordoff MG, Beauchamp GK. Sweetener preference of C57BL/6ByJ and 129P3/J mice. Chem Senses, 2001;26:905–13. [DOI] [PMC free article] [PubMed] [Google Scholar]
- [39].Ennaceur A, Neave N, Aggleton JP. Spontaneous object recognition and object location memory in rats: the effects of lesions in the cingulate cortices, the medial prefrontal cortex, the cingulum bundle and the fornix. Exp Brain Res, 1997;113:509–19. [DOI] [PubMed] [Google Scholar]
- [40].Chalmers SA, Chitu V, Herlitz LC, Sahu R, Stanley ER, Putterman C. Macrophage depletion ameliorates nephritis induced by pathogenic antibodies. J Autoimmun, 2015;57:42–52. [DOI] [PMC free article] [PubMed] [Google Scholar]
- [41].Dobin A, Davis CA, Schlesinger F, Drenkow J, Zaleski C, Jha S et al. STAR: ultrafast universal RNA-seq aligner. Bioinformatics, 2013;29:15–21. [DOI] [PMC free article] [PubMed] [Google Scholar]
- [42].Eden E, Navon R, Steinfeld I, Lipson D, Yakhini Z. GOrilla: a tool for discovery and visualization of enriched GO terms in ranked gene lists. BMC Bioinformatics, 2009;10:48. [DOI] [PMC free article] [PubMed] [Google Scholar]
- [43].Bachen EA, Chesney MA, Criswell LA. Prevalence of mood and anxiety disorders in women with systemic lupus erythematosus. Arthritis and rheumatism, 2009;61:822–9. [DOI] [PMC free article] [PubMed] [Google Scholar]
- [44].Naude PJ, Eisel UL, Comijs HC, Groenewold NA, De Deyn PP, Bosker FJ et al. Neutrophil gelatinase-associated lipocalin: a novel inflammatory marker associated with late-life depression. J Psychosom Res, 2013;75:444–50. [DOI] [PubMed] [Google Scholar]
- [45].Naude PJ, den Boer JA, Comijs HC, Bosker FJ, Zuidersma M, Groenewold NA et al. Sex-specific associations between Neutrophil Gelatinase-Associated Lipocalin (NGAL) and cognitive domains in late-life depression. Psychoneuroendocrinology, 2014;48:169–77. [DOI] [PubMed] [Google Scholar]
- [46].Suk K Lipocalin-2 as a therapeutic target for brain injury: An astrocentric perspective. Progress in neurobiology, 2016;144:158–72. [DOI] [PubMed] [Google Scholar]
- [47].Domenici E, Wille DR, Tozzi F, Prokopenko I, Miller S, McKeown A et al. Plasma protein biomarkers for depression and schizophrenia by multi analyte profiling of case- control collections. PLoS One, 2010;5:e9166. [DOI] [PMC free article] [PubMed] [Google Scholar]
- [48].Mizoguchi H, Yamada K, Nabeshima T. Matrix metalloproteinases contribute to neuronal dysfunction in animal models of drug dependence, Alzheimer’s disease, and epilepsy. Biochem Res Int, 2011;2011:681385. [DOI] [PMC free article] [PubMed] [Google Scholar]
- [49].McKimmie C Role of CXCL10 in central nervous system inflammation. International journal of interferon, cytokine and mediator research, 2014:1. [Google Scholar]
- [50].Lapa AT, Postal M, Sinicato NA, Bellini BS, Fernandes PT, Marini R et al. S100beta is associated with cognitive impairment in childhood-onset systemic lupus erythematosus patients. Lupus, 2017;26:478–83. [DOI] [PubMed] [Google Scholar]
- [51].Arshad M, Ye Z, Gu X, Wong CK, Liu Y, Li D et al. RNF13, a RING finger protein, mediates endoplasmic reticulum stress-induced apoptosis through the inositol-requiring enzyme (IRE1alpha)/c-Jun NH2-terminal kinase pathway. J Biol Chem, 2013;288:8726–36. [DOI] [PMC free article] [PubMed] [Google Scholar]
- [52].Tocharus J, Tsuchiya A, Kajikawa M, Ueta Y, Oka C, Kawaichi M. Developmentally regulated expression of mouse HtrA3 and its role as an inhibitor of TGF-beta signaling. Dev Growth Differ, 2004;46:257–74. [DOI] [PubMed] [Google Scholar]
- [53].Tatar CL, Appikatla S, Bessert DA, Paintlia AS, Singh I, Skoff RP. Increased Plp1 gene expression leads to massive microglial cell activation and inflammation throughout the brain. ASN Neuro, 2010;2:e00043. [DOI] [PMC free article] [PubMed] [Google Scholar]
- [54].Fitzgerald KA, Palsson-McDermott EM, Bowie AG, Jefferies CA, Mansell AS, Brady G et al. Mal (MyD88-adapter-like) is required for Toll-like receptor-4 signal transduction. Nature, 2001;413:78–83. [DOI] [PubMed] [Google Scholar]
- [55].Elliott DA, Weickert CS, Garner B. Apolipoproteins in the brain: implications for neurological and psychiatric disorders. Clin Lipidol, 2010;51:555–73. [DOI] [PMC free article] [PubMed] [Google Scholar]
- [56].Chen LY, Chen JD. Daxx silencing sensitizes cells to multiple apoptotic pathways. Mol Cell Biol, 2003;23:7108–21. [DOI] [PMC free article] [PubMed] [Google Scholar]
- [57].Drokhlyansky E, Goz Ayturk D, Soh TK, Chrenek R, O’Loughlin E, Madore C et al. The brain parenchyma has a type I interferon response that can limit virus spread. Proc Natl Acad Sci U S A, 2017;114:E95–E104. [DOI] [PMC free article] [PubMed] [Google Scholar]
- [58].Ni W, Zheng M, Xi G, Keep RF, Hua Y. Role of lipocalin-2 in brain injury after intracerebral hemorrhage. J Cereb Blood Flow Metab, 2015;35:1454–61. [DOI] [PMC free article] [PubMed] [Google Scholar]
- [59].Gouweleeuw L, Naude PJW, Rots M, DeJongste MJL, Eisel ULM, Schoemaker RG. The role of neutrophil gelatinase associated lipocalin (NGAL) as biological constituent linking depression and cardiovascular disease. Brain, Behavior, and Immunity, 2015;46:23–32. [DOI] [PubMed] [Google Scholar]
- [60].Pawar RD, Pitashny M, Gindea S, Tieng AT, Levine B, Goilav B et al. Neutrophil Gelatinase Associated Lipocalin is Instrumental in the Pathogenesis of Antibody- Mediated Nephritis. Arthritis and rheumatism, 2012;64:1620–31. [DOI] [PMC free article] [PubMed] [Google Scholar]
- [61].Rosell A, Cuadrado E, Ortega-Aznar A, Hernandez-Guillamon M, Lo EH, Montaner J. MMP-9-positive neutrophil infiltration is associated to blood-brain barrier breakdown and basal lamina type IV collagen degradation during hemorrhagic transformation after human ischemic stroke. Stroke, 2008;39:1121–6. [DOI] [PubMed] [Google Scholar]
- [62].Morris SM. Arginine metabolism: boundaries of our knowledge. J Nutr, 2007;137. [DOI] [PubMed] [Google Scholar]
Associated Data
This section collects any data citations, data availability statements, or supplementary materials included in this article.