

Abstract
For more than 150 years it is known that occupational overexposure of manganese (Mn) causes movement disorders resembling Parkinson’s disease (PD) and PD-like syndromes. However, the mechanisms of Mn toxicity are still poorly understood. Here, we demonstrate that Mn dose- and time-dependently blocks the protein translation of amyloid precursor protein (APP) and heavy-chain Ferritin (H-Ferritin), both iron homeostatic proteins with neuroprotective features. APP and H-Ferritin are post-transcriptionally regulated by iron responsive proteins (IRPs), which bind to homologous iron responsive elements (IREs) located in the 5’-untranslated regions (5’-UTRs) within their mRNA transcripts. Using reporter assays, we demonstrate that Mn exposure repressed the 5’-UTR-activity of APP and H-Ferritin, presumably via increased IRP-IRE binding, ultimately blocking their protein translation. Using two specific Fe2+-specific probes (RhoNox-1 and IP-1) and ion chromatography inductively coupled plasma mass spectrometry (IC-ICP-MS), we show that loss of the protective axis of APP and H-Ferritin resulted in unchecked accumulation of redox-active ferrous iron (Fe2+) fueling neurotoxic oxidative stress. Enforced APP expression partially attenuated Mn-induced generation of cellular and lipid reactive oxygen species (ROS) and neurotoxicity. Lastly, we could validate the Mn-mediated suppression of APP and H-Ferritin in two rodent in vivo models (C57BL6/N mice and RjHan:SD rats) mimicking acute and chronic Mn exposure. Together, these results suggest that Mn-induced neurotoxicity is partly attributable to the translational inhibition of APP and H-Ferritin resulting in impaired iron metabolism and exacerbated neurotoxic oxidative stress.
Keywords: Manganese (Mn), iron, H-Ferritin, iron responsive element (IRE), amyloid precursor protein (APP), SH-SY5Y neural-like cell line, reactive oxygen species (ROS), neurotoxicity, Manganism, neuroprotection
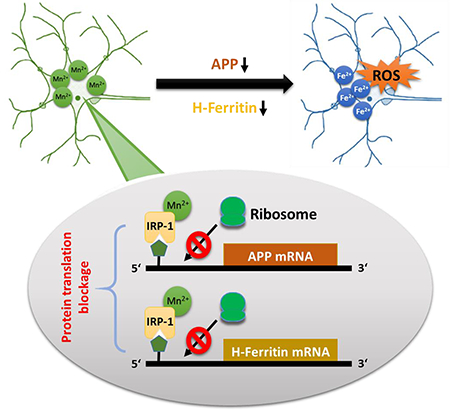
Graphical abstract
For more than 150 years it is known that occupational overexposure of manganese (Mn) causes movement disorders resembling Parkinson’s disease (PD) and PD-like syndromes. Here we demonstrate that Mn exposure results in suppression of amyloid precursor protein (APP) and H-Ferritin in vitro and in vivo. On the molecular level, it could be shown that Mn inhibits the protein translation via repressing the 5’-UTR activity of both proteins. Mn-mediated suppression of both iron-regulating proteins results in an accumulation of redox-active iron (Fe2+) that fuels neurotoxic cellular oxidative stress and lipidperoxidation. APP overexpression significantly attenuate Mn-induced oxidative stress and neurotoxicity. The implications that Mn exposure results in a translational suppression of APP and H-Ferritin links a disturbed iron homeostasis with Mn-induced oxidative neurotoxicity
INTRODUCTION
The essential trace element and transition metal manganese (Mn) plays an important role as vital co-factor in receptors, transporters and many enzymatic reactions, including the anti-oxidant enzyme Mn-superoxide dismutase (MnSOD). At physiological levels, Mn is required for wound-healing, bone and cartilage formation, mitochondrial function and energy production. Thus, a balanced Mn homeostasis is crucial for cell maintenance and viability (Peres et al. 2016, Farina et al. 2013).
However, Mn has also been documented as a potent neurotoxic agent for about 150 years (Dobson et al. 2004, Farina et al. 2013). Excessive or prolonged exposure cause irreversible damage to the nervous system, in particular to the iron-rich basal ganglia resulting in the development of “manganism”, a neurological disorder with symptoms such as bradykinesia and rigidity resembling Parkinson’s disease (PD) and PD-like disturbances (Pal et al. 1999, Chia et al. 1993, Guilarte 2013, Gorell et al. 1997). Furthermore, the PD-linked gene ATP13A2 (also known as PARK9) is strikingly implicated in neuronal detoxification of Mn as well as suppressing α-synuclein toxicity (Gitler et al. 2009, Tan et al. 2011). In addition, newly identified loss-of-function mutations in the Mn efflux transporter gene SLC30A10 are linked to PD-like symptoms, altogether underscoring the biological complexity of these multifactorial neurodegenerative disorders (Quadri et al. 2012, Tuschl et al. 2012).
A body of evidence suggests that Mn-driven neurotoxicity is associated with altered iron metabolism, both systemically and at the cellular level due to similar physiochemical properties and shared absorptive pathways, such as the divalent metal transporter (DMT1) that competitively regulates the uptake Mn and iron (Chua & Morgan 1996, Kwik-Uribe et al. 2003, Gunshin et al. 1997). Despite these similarities there are also some essential differences between both transition metals. Common oxidation states of Mn are 2+, 3+, 4+, 6+ and 7+, with Mn2+ (later referred to as Mn) being the most stable oxidation state (Farina et al. 2013). Within biological systems, iron occurs in one of two oxidation states known as ferrous (Fe2+) and ferric iron (Fe3+). While Fe3+ is redox-inactive, Fe2+ is an intrinsic generator of reactive oxygen species (ROS) by catalyzing the decomposition of H2O2 producing highly toxic hydroxyl radicals and membrane lipidperoxidation via Haber-Weiss and Fenton reactions (Kehrer 2000, Gaschler & Stockwell 2017). Both, increased production of cellular ROS and peroxidized phospholipids corrupt the integrity of proteins, lipids and DNA, which can result in detrimental consequences on core cellular functions (Sies 2015) and even trigger a programmed necrotic cell death, known as “ferroptosis” (Dixon et al. 2012, Stockwell et al. 2017). In contrast, unlike Fe2+, Mn is not capable to generate such hydroxyl radicals via Haber-Weiss or Fenton reaction like (Archibald & Tyree 1987). However, Mn-catalyzed auto-oxidation of dopamine involves redox-cycling of Mn3+ and Mn2+ in a reaction that can result in ROS and dopamine-o-quinone generation, both fueling oxidative stress (Segura-Aguilar & Lind 1989). We and others previously demonstrated that Mn exposure results in a shift of Fe2+/Fe3+ ratio towards redox active Fe2+ accompanied by depleted levels of the antioxidant glutathione and increased oxidative stress markers in vitro and in vivo (Fernsebner et al. 2014, Kwik-Uribe et al. 2003, Neth et al. 2015). However, the molecular basis of the Mn-induced iron-shift and redox-alteration remains to be elucidated.
To avoid cellular accumulation of free toxic Fe2+, iron metabolism requires the tight coordination of a wide variety of genes that are primarily controlled through post-transcriptional regulatory mechanisms, including the iron storage protein ferritin (light-chain (L-Ferritin) and the heavy-chain type (H-Ferritin)), iron importer transferrin receptor 1 (TFR1) and iron exporter ferroportin (FPN) (Bogdan et al. 2016). All such iron homeostasis proteins contain iron-responsive elements (IRE) in their respective mRNAs located within the 5’- or 3’-untranslated regions (UTRs) flanking their coding sequences. Binding of iron regulatory proteins (IRP1 and IRP2) to IRE-sequences on 5’- and 3’-UTRs have opposite effects on target mRNA expression (Anderson et al. 2012, Hentze et al. 2010): While IRP binding to 3’-UTR IREs enhances mRNA stability that results in increased protein expression, IRP binding to 5’-UTR IREs blocks the translation of iron-responsive target genes. In this context, we previously identified a fully functional IRE-like RNA stem loop in the 5’-UTR of the amyloid precursor protein (APP) (Rogers et al. 2002). Consistently, we showed that genetic deletion of IRP1 facilitates translational activation of APP mRNA, ultimately increasing its protein expression (Cho et al. 2010).
APP is a ubiquitously expressed type-I-transmembrane protein that is known to contain copper and zinc-binding domains (Bayer et al. 1999). Pathological APP processing by β- and γ-secretases, generating neurotoxic Aβ-peptides, is believed to be the key event in the pathogenic cascade in Alzheimer’s disease (AD) (Selkoe 2001). However, under physiological conditions, APP is predominantly processed in a non-amyloidogenic manner via α-secretase that precludes Aβ production and releases the large N-terminal fragment sAPPα (Sisodia 1992). Compared to the neurotoxic properties of Aβ peptides (Haass & Selkoe 2007), sAPPα possesses cell protective and growth-promoting features that have been validated both in vitro and in vivo , including neuronal and multiple cancer cell lines as well as several animal models (Venkataramani et al. 2010, Venkataramani et al. 2012, Zheng & Koo 2011, Müller et al. 2017). Intriguingly, we and others recently elucidated that APP and sAPPα indirectly facilitate iron efflux via stabilizing the key Fe2+-exporter FPN (Duce et al. 2010, Wong et al. 2014, McCarthy et al. 2014). Consistent with this, we demonstrated a significant accumulation of total and labile iron pool in APP−/− mice that was accompanied with a marked induction of oxidative stress levels in the brain and other organs compared to wild-type mice (Duce et al. 2010, Ayton et al. 2015).
Given the role and functions of APP and H-Ferritin in orchestrating iron homeostasis and responses, we here investigated if Mn interferes with the translational control of both proteins resulting in blocked iron efflux and depleted iron storage in neuronal-like SH-SY5Y cells and in two different rodent in vivo models.
MATERIALS AND METHODS
Reagents and antibodies:
Manganese-(II)-chloride tetrahydrate (MnCl2·4H2O, cat no.: M3634) and Manganese-(II)-acetate (cat no.: 330825) (both referred as Mn), ferric ammonium citrate (FAC, cat no.: F5879), desferrioxamine mesylate salt (DFO, cat no.: D9533) and 3-Hydroxy-1,2-dimethyl-4(1H)-pyridone (Deferiprone, DEF, cat no.: 379409) were purchased from Sigma-Aldrich (St. Louis, MO). Calcein-AM (calcein-acetoxymethyl ester, cat no.: C3100MP) was purchased from Thermo Fisher Scientific. Stocks of FAC (10 mM), Mn (100 mM), DFO (10 mM) and DEF (100 mM) were prepared in DMEM and purified water, respectively. The following antibodies were used: IRP1 (EPR7225, cat no.: ab126595, abcam), IRP2 (IREB2, cat no.: PA1–16544, Thermo Fisher Scientific), β-actin (C-11, cat no.: A2066, Sigma-Aldrich and AC-15, cat no.: ab6276, abcam), anti-FTH1 (H-Ferritin) antibodies (D1D4, cat no.: #4393, Cell Signaling and cat no.: ab137758, abcam), LC3B (D11, cat no.: #3868) and Beclin-1 (D40C5, cat no.: #3495) (both Cell signaling). For APP detection we used the c-terminal APP antibody (cat no.: A8717, Sigma-Aldrich) and the N-terminal APP antibody (22C11, cat no.: MAB348, Millipore).
Cell culture and transfection:
The human neuroblastoma cell line SH-SY5Y (RRID: CVCL_0019) was initially purchased from ATCC. This cell line is not listed as a commonly misidentified cell line by the International Cell Line Authentication Committee (ICLAC; http://iclac.org/databases/cross-contaminations/). We have confirmed in this cell line the heterozygous ALK p.F1174L mutation by Sanger sequencing. Stably expressing cell lines overexpressing human wildtype APP695 isoform (SH-SY5Y APP695) or empty vector (pCEP4) were previously established (Venkataramani et al. 2010). The stable SH-SY5Y cell line transfected with the APP 5’-UTR luciferase or HIRE_CAT constructs were described previously (Rogers et al. 2016, Thomson et al. 2005).
Immortalized APP−/− MEFs and corresponding wild-type MEFs (APP+/+) were provided by Ulrike Müller (University Heidelberg) and described previously (Li et al. 1996). All cell lines were cultured in DMEM (Dulbecco’s modified Eagle’s medium) supplemented with 10% (v/v) fetal calf serum, 1% L-glutamine and 1% penicillin/streptomycin. Complete medium were changed every 2–3 days.
Protein extracts and Western blot analyses:
Cells at 60-70% confluency were treated with indicated conditions and time points. After subsequent washing in PBS, cells were scraped into modified radioimmunoprecipitation assay (RIPA) lysis buffer (PBS pH 7.4, 0.5% sodium deoxycholate, 1% NP-40) on ice for 30 min with gentle agitation. Cell lysates were centrifuged at 10,000 × g for 10 min. Mice and rat whole brains were collected in cold PBS on ice. For all mice experiments cortex tissue (frontal cortex) were isolated, fully homogenized in RIPA buffer (Solarbio, cat no.: R0020). For all shown rat experiments, whole brain tissues were lysed in ice cold extraction buffer (10 mM Tris-HCl, pH 7.4, previously purged with helium for 3 h) as previously published (Fernsebner et al. 2014). Total protein concentrations were analyzed using DC protein assay (cat no.: 500-0113, Bio-Rad). Unless stated otherwise, cell extracts (15-20 µg/well) were separated by SDS-PAGE at 100V constant using Mini-PROTEAN TGX precast 4-15% gradient gels (cat no.: 456-1085, Bio-Rad) and transferred using the Bio-Rad nitrocellulose and Trans-Blot Turbo System. Unless stated otherwise, western blots from three independent experiments were quantified using ImageJ software (version 1.41o, National Institutes of Health). Images were captures using a CCD camera. To enhance visibility of bands, images were equally adjusted for contrast in Adobe Photoshop. If comparisons are to be made between images, the blots were taken with identical conditions and manipulated equally.
Quantitative Real-Time-PCR analysis:
Total RNA was isolated using TRI-reagent (cat no.: T9424, Sigma-Aldrich) according to the manufacturer’s instructions. Assays were performed using an ABI Prism 7000 system (Applied Biosystems, Foster City). APP primers (forward, 5-GCCCTGCGGAATTGACAAG-3; reverse, 5-CCATCTGCATAGTCTGTGTCTG-3), ferroportin primers (forward, 5-CTACTTGGGGAGATCGGATGT-3; reverse, 5-CTGGGCCACTTTAAGTCTAGC-3), ferritin primers (forward, 5-CCCCCATTTGTGTGACTTCAT-3; reverse, 5-GCCCGAGGCTTAGCTTTCATT-3); transferrin receptor primers (forward, 5-GGCTACTTGGGCTATTGTAAAGG-3; reverse, 5-CAGTTTCTCCGACAACTTTCTCT-3); and β-actin primers (forward, 5-CATGTACGTTGCTATCCAGGC-3; reverse, 5-CTCCTTAATGTCACGCACGAT-3) were purchased from Life Technology.
Quantification of luciferase (luc) and chloramphenicol acetyltransferase (CAT) activity:
Luciferase Assay Kit (cat no.: E1500, Promega) was used according to manufacturer’s directions to measure the luciferase activity. Reporter assays for balanced luciferase assays using the transfectants encoding the APP 5’-UTR luciferase (luc) reporter construct pGAL were as described previously (Rogers et al. 2016). The activity of the Ferritin-H chain specific iron-responsive element (H-Ferritin IRE) was assessed using the plasmid construct, designated as HIRE_CAT, in which the H-Ferritin IRE had been ligated in front of a chloramphenicol acetyltransferase (CAT) reporter gene. CAT enzyme-linked immunosorbent assays were performed according to manufacturer’s instructions (Roche Applied Science) as previously described (Thomson et al. 2005).
Cell Viability and cell number quantification:
Cell viability was measured by a colorimetric assay either by using the MTT (thiazolyl blue tetrazolium, Sigma-Aldrich) viability assay or the MTS-Assay (CellTiter96 AQassay, cat no.: G3582, Promega) according to the protocol of the supplier (Venkataramani et al. 2010). Cell viability data are presented as relative changes in % compared to untreated controls. In parallel, cells were grown in 12-well plates for cell number analysis. Repetitive aliquots were taken and counted using a hemocytometer with trypan blue exclusion assay. For each treatment condition, triplicate wells were counted, and values were averaged. Data were presented as relative values in % compared to untreated controls.
Quantification of the labile iron pool (LIP):
Increasing Mn concentrations were incubated with SH-SY5Y cells or complete DMEM media alone using isoplate 96 well plates (Perkin Elmer). Cells or media alone were loaded with calcein-AM at a final concentration of 0.25 µM. Fluorescence (Excitation/Emission: 485/520 nm) was assessed using the FlexStation3 multi-mode microplate reader (Molecular Devices). Background fluorescence was subtracted and data was expressed as mean ± SEM from 6 replicates.
Fe2+-specific probes Rho-Nox1 and IP-1 were prepared by Allegra Aron, Ho Yu Au-Yeung and Christopher J. Chang (Department of Chemistry, University of California, Berkeley) and freshly dissolved in DMSO at a stock concentration of 2 mM (Niwa et al. 2014, Au-Yeung et al. 2013). Cells were incubated with DMEM media alone or increasing Mn doses for 24 h, washed with PBS and loaded with 5 µM RhoNox-1 dissolved in OptiMEM media for 60 min. After incubation, cells were washed once with PBS. As positive control, cells treated for 24 h with Mn were washed with PBS and incubated with 100 µM DEF for 1 h and washed again with PBS. Fluorescence (Excitation/Emission: 540/575 nm) was analyzed using a TECAN reader. In a similar fashion, cells were incubated with a 20 µM final concentration of IP-1 dissolved in OptiMEM media for 2 h. Cells were washed with PBS and fluorescence (Excitation/Emission: 488/550 nm) was analyzed using a TECAN reader.
Quantification of Fe2+, Fe3+ and Mn2+ using IC-ICP-sf-MS and CE-ICP-qMS analysis:
Speciation and quantification of Fe2+, Fe3+ and Mn2+ was performed by ion chromatography inductively coupled plasma mass spectrometry (IC-ICP-MS) as described previously (Fernsebner et al. 2014, Solovyev et al. 2017) and in addition with capillary electrophoresis inductively coupled plasma mass spectrometry (CE-ICP-MS). For redox speciation of Fe2+ vs. Fe3+ the IC-ICP-MS method used a Thermo-Dionex guard column IonPac™ CG5A column and an IonPac™ CS5A RFIC 4*250 mm analytical column, directly hyphenated to high-resolution sectorfield ICP-sf-MS (Element II, Thermo Scientific). Experimental conditions were analogous to (Solovyev et al. 2017): Redox species were separated isocratically using an eluent consisting of 50 mM ammonium citrate, 7mM dipycollinic acid (PDCA), pH 4.2 at a flow rate of 0.8 ml/min. Detection was performed on 56Fe isotope at the ICP-sf-MS in medium resolution mode. For cross-validation a coupling of capillary electrophoresis (PrinCe 760, Prince Technologies) with ICP-qMS (NexIon 360 M, Perkin Elmer) was employed. The CE-ICP-MS method operated in positive electrophoretic mode at acidic pH (background electrolyte: 20 mM HCl, +25 kV). Monitored isotopes were 55Mn, 56Fe and 57Fe, using DRC cell technology with ammonia as DRC gas in accordance to (Quintana et al. 2006) for removing of interferences at respective isotopes.
Determination of cytoplasmic and lipid reactive oxygen species (ROS):
For detection of cytoplasmic ROS, cells were seeded in 6-well plates at a density of 1×10⁵ cells in full media. After 24 h Mn treatment, cells were washed twice in PBS and subsequently incubated with a 25 µM working solution of H2DCFDA (cat no.: D399, Molecular Probes, Stock 20 mM dissolved in methanol) for 10 min light-protected at 37°C. After brief washing with PBS, fluorescence was analyzed via FACS (FL-1 channel). For detection of lipid peroxidation (Lipid-ROS), cells were incubated with a 10 µM working solution of BODIPY 581/591 C11 (cat no.: D3861, Molecular Probes, Stock 2 mM in DMSO) and incubated for 45 min light-protected at 37°C. Lipid-ROS was analyzed via flow cytometry (excitation at 488 nm and emission at 530 (FL-1)) and (excitation at 488 nm and emission at 585 nm (FL-2)). Data were analyzed by FlowJo software and presented as relative induced ROS compared to untreated controls. For Lipid-ROS the fluorescence ratio FL1/FL2 reflecting the oxidation of the probe were presented either in arbitrary units or as relative induced lipid ROS compared to untreated controls.
Rodent experiments and treatments:
All mice were housed in a specific pathogen-free facility and maintained on a purified AIN-76A diet (Research Diets, New Brunswick, NJ, USA). All mice were maintained under a 12-hour light/dark cycle, controlled temperature (22 ± 2°C) and humidity (65 ± 5%). Eight weeks male mice with C57BL6/N background (C57BL/6NCrl, Charles Rivers) were housed in cages for 5 days before the experiment. The mice (~21.3 – 25.1 g body weight) were randomly divided into four groups by body weight stratification (n=5 for each group): Mice were either fed with standard diet (control group: Mn 10 ppm, diet D08080401) or high Mn diet (Mn group: 2400 ppm, diet D17020702, both from Research Diets, New Brunswick, NJ, USA) for 91 days. Furthermore, mice were intraperitoneally (i.p.) injected with either PBS (calcium and magnesium free PBS, control group) or MnCl2 (MnCl2·4H2O, Mn group: 40 mg/kg body weight/day) for 7 days. No calculations to predetermine sample size of each group was needed. At the end of each experiment, all mice were sacrificed by anesthesia with chloral hydrate to reduce the pain of animals during the process. All mice experiments were approved by the Institutional Animal Care and Use Committee of Zhengzhou University.
All showed rat experiments were previously published by Fernsebner et al. (2014). In brief, 12 male Sprague-Dawley rats (RjHan:SD) were purchased from Janvier (Janvier S.A.S., France). For acclimatization, rats were maintained in standard cages with air filter hoods and free access to food and water. Subsequently, animals were divided in two groups: control group (n=6) received a standard diet with 23 mg/kg fodder without Mn whereas the treated group received Mn-enriched fodder (500 mg/kg body weight, n=6). The whole experiment lasted 53 days, thereafter euthanasia was performed by perforating the aorta abdominals suprarenalis after deep narcotization. The brains were snap frozen immediately in liquid nitrogen until sample preparation and stored at −80°C. Exactly the same animal brains were used for western blot experiments in this current study. All performed rat experiments were in accordance with the institutional Animal Welfare Committee as well as approved by the Bavarian federal state government under the file number 55.2–1-54–2531-180–12. During all animal experiments, operators were skilled and carefully cared for all rodents, giving them plenty of food and water and a good feeding environment. No other drugs were used except for anesthesia before the tissue was taken. No animals were excluded based on the exclusion criteria (abnormal coat color, obvious movement disorders or limb damage).
Statistical analysis:
All statistical analyses were performed using GraphPad Prism Software (GraphPad Software Inc.). Normality of Data was carried out by Shapiro-Wilk test before all statistical tests. Differences between treatment groups were evaluated using unpaired t-test, one- or two-way ANOVA followed by Bonferroni post-hoc analysis. No test for outlier was conducted on the data. Data are presented as mean ± SD. A p-value < 0.05 was considered as significant.
RESULTS
Manganese reduces cell viability in a concentration and time-dependent fashion.
The dopaminergic neuroblastoma cell line SH-SY5Y was exposed to increasing concentrations of Mn for up to 48 h. Cell viability analysis after 24 h incubation revealed an IC50 of ~175 µM, while prolonged treatment after 48 h showed a more pronounced decrease in cellular viability with an IC50 of less than ~10 µM Mn. When administering 100 µM of Mn for 24 h, we detected in SH-SY5Y cells a viability drop of 36.6 ± 3.5% for 24 h, and 82.3 ± 6.8 % for 48 h that even further decreased to 89.0 ± 2.5% for 72 h (data not shown) (Fig. 1a). In a similar fashion, cell counting data via hemocytometer revealed that cells stopped growing, closely reflecting cell viability measurements (Fig. 1b).
Figure 1. Opposing effects of Mn and FAC exposure to cell viability and protein expression of APP and H-Ferritin in human neuroblastoma cells.

Human SH-SY5Y cells were incubated with increasing Mn concentrations for 24 h and 48 h and analyzed for (a) cell viability (n=3) and (b) cell number (24 h, n=6; 48 h, n=4). (c) Cell lysates of control and Mn treated SH-SY5Y cells were separated on 4-12% Bis-Tris gels. Western blot and densitometric quantification of APP (clone A8717) and H-Ferritin (clone D1D4) (n=3). (d) SH-SY5Y cells treated with increasing FAC concentrations for 24 h, immunoblotted for APP (clone A8717) and H-Ferritin (clone D1D4). Densitometric quantification of both proteins were adjusted to loading control β-actin (n=3). Data shown represent mean ± SD. N number indicates number of replicates. Differences were calculated using either one-way ANOVA followed by Bonferroni post hoc analyses (a, b) or unpaired t-test (c, d) (*, p < 0.05; **, p < 0.01; ***, p < 0.001).
Manganese acutely reduces protein levels of neuroprotective iron homeostatic gene products APP and H-Ferritin.
We previously reported that the xenobiotic metal lead caused a translational repression of APP and H-Ferritin in SH-SY5Y cells (Rogers et al. 2016). Based on this, we evaluated Mn-dose responsive effects in the range of 10–100 µM and analyzed protein expression of the iron homeostatic gene products APP and H-Ferritin. Indeed, Mn led to a significant decrease in expression of both proteins after 24 h exposure (Fig. 1c). At 100 µM of Mn, where cell viability was decreased by only ~37%, we observed a marked reduction of H-Ferritin (~92.3 ± 10.9%) and APP levels (~82.6 ± 10.8 %) compared to untreated controls, suggesting that the effects of Mn on these proteins was not an artifact of immediate cell toxicity. In contrast, FAC treatment strongly increased the protein expression of APP and H-Ferritin, underlining the iron-responsive nature of both proteins (Cho et al. 2010, Rogers et al. 2002) (Fig. 1d). In agreement, time course experiment revealed that Mn limited steady-state APP and H-Ferritin protein levels beginning at 6 h after metal exposure in a directly opposing pattern to the inductive response after FAC exposure (Fig. 2a,b).
Figure 2. Acute exposures of Mn and FAC differentially impacts protein and mRNA levels of APP and H-Ferritin.

(a) SH-SY5Y cells treated with 100 µM Mn for indicated time points and immunoblotted for APP (clone 22C11) and H-Ferritin (clone D1D4). All densitometric analyses were standardized to corresponding β-actin levels (n=3). (b) SH-SY5Y cells were incubated with 100 µM FAC for indicated time points and immunoblotted for APP (clone 22C11) and H-Ferritin (clone D1D4). All densitometric analyses were standardized to corresponding β-actin levels (n=3). (c) RT-PCR analysis of indicated iron responsive target genes (APP, H-Ferritin, TFR1 and FPN) from SH-SY5Y cells incubated for 24 h with 100 µM FAC or 100µM Mn. All data are normalized to housekeeping gene β-actin and presented as relative fold-induction compared to untreated controls (n=4). RT-PCR analysis of DFO-treated SH-SY5Y cells were shown in Supplemental Fig 1. Data shown represent mean ± SD. N number indicates number of replicates. Differences were calculated using unpaired t-test (*, p < 0.05; **, p < 0.01; ***, p < 0.001).
Manganese-dependent transcriptional response of APP and H-Ferritin does not reflect protein changes.
To determine if differential regulation of iron homeostasis genes occurs at the transcriptional level, we performed quantitative real-time PCR (qRT-PCR) to measure the mRNA levels of APP, H-Ferritin, transferrin receptor 1 (TFR1) and ferroportin (FPN1). Interestingly, 24 h treatment with Mn resulted in a more than 3-fold increase of APP mRNA, while mRNA levels of H-Ferritin remained nearly unaltered. Moreover, Mn caused a strong induction of TFR1 mRNA without affecting FPN1 mRNA levels. In contrast, FAC administration did not result in marked changes of any mRNA levels tested (Fig. 2c). As a positive control, we treated SH-SY5Y cells with the iron chelator deferoxamine (DFO), resulting in a more than eight-fold increment of TFR1 mRNA levels and a suppression of FPN mRNA levels, underlining a cellular iron-deficient state (Supplemental Fig. 1).
These results demonstrated a clear discrepancy between protein and mRNA after Mn and FAC exposure, suggesting the involvement of post-transcriptional gene regulatory mechanisms of APP and H-Ferritin.
Manganese post-transcriptionally blocks 5’-UTR-mediated translation of APP and H-Ferritin
We first conducted alignments of the equivalent 5’-untranslated regions (5’-UTRs) in the transcripts for the human, mouse and rat APP transcripts, the Ferritin-L and –H chains mRNAs and also the putative 5’-UTR specific iron specific element (IRE) in the human FPN mRNA (Supplemental Fig. 2). We identified a putative IRE stem loop in the 5’-UTR of the APP mRNA, based on its similarity to the canonical IRE loops found in H- and L-chain Ferritin (Rogers et al. 2002, Thomson et al. 2005). Application of NCBI align showed that these 5’-UTR structures align in such a way as to generate characteristic AGA or AGU tri-loops that can mediate binding to the iron regulatory proteins IRP1 and IRP2 (Cho et al. 2010, Goforth et al. 2010, Ke et al. 1998).
Based on this finding, we next used SH-SY5Y cells expressing a luciferase (luc) reporter fused to the 146-nucleotide 5’-UTR sequence of the APP mRNA (APP 5’-UTR-luc) that we previously established to discover APP 5’-UTR-directed compounds (Bandyopadhyay et al. 2006) and iron responsiveness (Rogers et al. 2002). Compared to the control pGL3-luc empty plasmid, 50 µM FAC resulted in a significant increase of APP 5’-UTR-luc activity. By contrast, Mn treatment suppressed APP 5’-UTR specific activity by >50% at 50 µM, while not significantly affecting pGL3-luc activity (Fig. 3a). We next utilized an H-Ferritin IRE-CAT reporter system to monitor the 5’-UTR activity of H-Ferritin mRNA. Similar to the 5’-UTR present in APPmRNA, 24 h FAC treatment significantly induced CAT reporter activity, while Mn exposure resulted in a significant suppression of H-Ferritin 5’-UTR activity (Fig. 3b). IRPs are central post-transcriptional regulators that bind to the 5’-UTR-IRE regions of both proteins blocking their ribosomal protein translation. We observed that Mn promoted the proteolysis of IRP2 while leaving IRP1 protein levels unchanged (Fig. 3c).
Figure 3: The effect of Mn and FAC on IRE/IRP-dependent expression of APP and H-Ferritin.

(a) SH-SY5Y cells transfected with the pGL3 construct expressing the 146-nucleotide APP 5’UTR sequence (APP 5’-UTR) or empty plasmid (pGL3) were left untreated (Ctrl) or exposed to either 50 µM Mn (n=7) or 50 µM FAC (n=4) for 24 h and analyzed for luciferase activity. Data are depicted as relative luciferase activity compared to untreated controls. (b) In a similar fashion, SH-SY5Y cells were transfected with the HIRE-CAT construct (H-Ferritin 5’-UTR) and treated with either 50 µM Mn or 50 µM FAC for 24 h or left untreated (Ctrl) and analyzed for CAT (chloramphenicol acetyltransferase) reporter activity using an enzyme-linked immunosorbent assay (n=4). (c) Immunoblot analysis of Iron-regulatory protein-1 (IRP1) and IRP2 protein expression in response to increasing Mn concentrations. β-actin served as loading control (n=3). Data shown represent mean ± SD. N number indicates number of replicates. Differences were calculated using two-way ANOVA (a) or unpaired t-test (b, c) (*, p < 0.05; **, p < 0.01).
In conclusion, our data show that Mn exposure stabilized IRP1 protein levels that may potentially still be bound to the 5’-UTR-IREs of APP and H-Ferritin, providing an explanation for suppressed 5’-UTR activities of these genes and subsequent inhibition of their endogenous protein translation.
Manganese increases intracellular labile iron pool (LIP) and oxidative stress levels.
APP and H-Ferritin play key roles in export and storage of excess toxic redox active ferrous iron (Fe2+). Therefore, we asked if Mn treatment causes changes in Fe2+ levels that represent the cellular labile iron pool (LIP). We first used the established calcein-AM assay to measure levels of cytosolic redox-active Fe2+ in the labile iron pool (LIP). Calcein is a fluorochrome that chelates free Fe2+ under quenching its green calcein fluorescence (Tenopoulou et al. 2007). Mn exposure to SH-SY5Y cells resulted in a concentration- and time-dependent decrease of calcein fluorescence. However, cell-free analysis using DMEM media with increasing Mn doses resulted even in a stronger concentration-dependent quenching of calcein fluorescence, indicating the limitation of this assay to specifically determine LIP alterations (Supplemental Fig. 3a). We therefore utilized two first-generation activity-based “turn-on” probes that are capable of selectively detecting Fe2+ over other biologically relevant metals including Mn (Aron et al. 2018). RhoNox-1 interacts with Fe2+ resulting in the release of fluorescent rhodamine and was recently reported to selectively detect endogenous changes in LIP of lung carcinoma cells (Adachi et al. 2016, Niwa et al. 2014), while IP-1 relies on an oxygen-dependent, three-component sensing mechanism to detect Fe2+ (Au-Yeung et al. 2013). Indeed, we could detect a significant concentration-dependent increase in RhoNox-1 and IP-1 fluorescence in SH-SY5Y cells (Fig. 4a), while no significant changes could be detected with both dyes in a cell-free environment (Supplemental Fig. 3b). Moreover, subsequent 1-h incubation with 100 µM of the iron chelator deferiprone (DEF) completely rescued RhoNox-1 and IP-1 fluorescence, confirming Mn-mediated intracellular Fe2+ accumulation in SH-SY5Y cells (Fig. 4a). We further validated the Mn-induced shift in Fe2+/Fe3+ ratio using IC-ICP-MS and CE-ICP-MS, two methods that enable the clear distinction and quantification of iron in both redox-states (Fig. 4b and Supplemental Fig. 3c).
Figure 4. Mn treatment increases labile iron pool (LIP), cytoplasmic and lipid ROS levels in a concentration and time-dependent manner.

(a) SH-SY5Y cells were incubated for 24 h with indicated Mn concentrations and incubated with either 5 µM RhoNox-1 dye for 1 h (left panel) or 20 µM IP-1dye for 2h (right panel). As additional control Mn treated wells were incubated with 100 µM of the iron chelator Deferiprone (DEF) for 1 h and incubated with both dyes. Fluorescence was presented as absolute fluorescence units (F.U.) (n=6). Cell-free fluorescence intensities of both Fe2+-selective dyes ± 100 µM Mn in OpiMEM were shown in Supplemental Fig. 3b. (b) IC-ICP-MS and CE-ICP-MS analysis were performed to determine Fe3+ and Fe2+ levels in RIPA lysates from SH-SY5Y incubated with DMEM media alone or 100 µM Mn for 24 h. Data are presented as Fe3+ and Fe2+ to total iron (Fe3+ and Fe2+) ratio (n=3). Absolute Fe3+ and Fe2+ values are presented in Supplemental Fig. 3c. (c) SH-SY5Y cells treated with increasing Mn concentrations for 24 h and analyzed for cellular oxidative stress levels via DCF fluorescence using flow cytometry. Mean relative fluorescence intensity (RFI) was presented as % increase to untreated controls (n=3). (d) SH-SY5Y cells treated with 100 µM Mn for indicated time points and analyzed for DCF fluorescence (n=3). (e) In a similar fashion lipid ROS was determined using the fluorescence dye BODIPY-C11 and flow cytometry after Mn treatment with increasing concentrations for 24 h (f) or 100 µM Mn for indicated time points. Mean relative fluorescence intensity of DCF and FL1/FL2 ratio of BODIPY-C11 were presented as % increase to untreated controls (n=3). Data shown represent mean ± SD. N number indicates number of replicates. Differences were calculated using unpaired t-test (*, p < 0.05; **, p < 0.01).
Based on this finding, we next examined the induction of oxidative stress using DCF and BODIPY 581/591 C11 fluorescence to assess cellular and lipid ROS, respectively. In support of a model of disturbed cellular redox homeostasis, Mn significantly increased cellular and lipid-ROS levels in a concentration and time-dependent fashion (Fig. 4c-f).
Our results supported previous observations by demonstrating that Mn exposure alters the Fe3+/Fe2+ towards redox-active Fe2+, leading to cytoplasmic and lipid ROS generation (Fernsebner et al. 2014, Neth et al. 2015, Kwik-Uribe et al. 2003).
Forced expression of APP confers cellular resistance to Mn-induced toxicity.
Since Mn represses endogenous APP translation, we next asked if forced expression of APP driven by a CMV (cytomegalovirus) promoter can modify Mn-induced neurotoxicity. We therefore utilized SH-SY5Y cells stably overexpressing the neuronal APP695-isoform (Venkataramani et al. 2010). In line with the iron-exporting function of APP via FPN stabilization (Duce et al. 2010, Wong et al. 2014, McCarthy et al. 2014), SH-SY5Y APP695 cells had markedly suppressed basal levels of H-Ferritin as well as lowered levels of cellular and lipid ROS compared to controls (Fig. 5a,c). Mn reduced endogenous APP level in mock-transfected cells while not affecting APP expression level in constitutively overexpressing APP695 cells, in support of our previous data. Furthermore, while 50 µM Mn treatment caused a complete depletion of H-Ferritin levels in mock-transfected controls, similar treatment resulted in only a slight decrease of H-Ferritin levels in APP695 cells (Fig. 5a). Consistently, Mn-induced generation of cytoplasmic and lipid ROS was significantly suppressed in APP695 overexpressing cells compared to control cells (Fig. 5b). Moreover, forced expression of APP695 in SH-SY5Y cells partially promoted cell survival against dose-responsive Mn-toxicity relative to mock-transfected counterparts (Fig. 5d). Similarly, APP-wild type (APP+/+) mouse embryonic fibroblasts (MEFs) exhibited a greater resistance to Mn toxicity compared to APP−/− MEFs. Notably, FAC pre-treatment resulted in a significant protection from Mn toxicity in APP+/+ MEFs, while in Mn-sensitive APP−/− MFEs FAC presented no protective effect (Supplemental Fig. 4).
Figure 5: APP over-expression protects against Mn-induced toxicity via attenuating oxidative stress.

(a) Representative histogram of cellular ROS (left panel) and lipid ROS (right panel) levels of SH-SY5Y cells, either stably overexpressing the APP695-isoform (APP695) or with the empty vector pCEP4 (Mock). (b) SH-SY5Y Mock and APP695 cells were exposed to Mn for 24 h and analyzed for cellular oxidative cells via DCF dye (left panel) or lipid-ROS using BODIPY-C11 (right panel). DCF fluorescence is presented as arbitrary fluorescence units (F.U) (n=3). Lipid-ROS data are presented as FL1/FL2 ratio (n=3). (c) Mock and APP695-transfected SH-SY5Y cells were incubated with increasing Mn concentrations for 24 h and analyzed for APP (clone 22C11) and H-Ferritin (clone D1D4) protein expression. (d) Cell viability was analyzed in Mock and APP695-expressing SH-SY5Y cells after Mn exposure for 24 h (n=3). All other data are presented as mean ± SD. N number indicates number of replicates. Differences were calculated using two-way ANOVA (*, p < 0.05; **, p < 0.01; ***,p < 0.001).
In conclusion, these data support a model that suggests that APP expression abrogates Mn-induced oxidative stress and cell toxicity and, that FAC pre-treatment in MEFs could partially reverse Mn toxicity in an APP-dependent manner.
Mn treatment reduces brain cortex APP and H-Ferritin levels in two in vivo models.
To examine the in vivo relevance of Mn-mediated APP and H-Ferritin suppression we fed male C57BL/6N mice with either a normal (10 p.p.m Mn) or high Mn diet (2400 p.p.m Mn), doses that do not induce toxicity in mice (Sato et al. 1996). After 91 days of chronic Mn exposure we observed a significant reduction of APP and H-Ferritin expression in brain tissue lysates of high Mn fed mice compared to standard dietary fed controls (Fig. 6a,b). To evaluate the effects of acute Mn exposure, we intraperitoneally (i.p.) administered male C57BL/6N mice with either Mn (40 mg/kg body weight/day) or PBS (control) for 7 days. Consistently, we observed suppressed levels of APP and H-Ferritin protein expression in Mn-treated mice compared to controls (Fig. 6 c,d). We validated these in vivo findings in brain lysates that we obtained from a previous published Mn study from Fernsebner et al. (2014) in which male Sprague-Dawley rats were either orally challenged with Mn (500mg/kg body weight) or standard diet (control) for 53 days. Re-evaluation of these total brain extracts clearly demonstrated that Mn treatment resulted in a marked suppression of APP and H-Ferritin protein levels compared to control-treated rats (Fig. 6e,f). In agreement with our in vitro findings, we observed in Mn-treated rat brains reduced protein levels of IRP2, while IRP1 expression levels were unaltered (Supplemental Fig. 5 a,b).
Figure 6: Dietary Mn suppresses APP and H-Ferritin protein expression in vivo and inversely correlates with redox-active Fe2+ levels.

(a) Mice were orally treated with standard diet (control group: 10 p.p.m Mn) or high Mn diet (Mn group: 2400 p.p.m Mn) for 91 days. (b) Explanted cortices were analyzed for APP (clone A8717) and H-Ferritin (ab137758). β-actin (clone AC-15) served as loading control. (c) Relative protein levels were measured by densitometry and normalized to β-actin (each group: n=5). (d) Mice were either i.p. injected with PBS (control group) or with MnCl2 (40 mg/kg/day) for 7 days. (e) Cortices were blotted for APP (clone A8717) and H-Ferritin (ab137758). β-actin served as loading control. (f) Relative protein levels were measured by densitometry and normalized to β-actin (each group: n=5). (g) Sprague-Dawley rats were orally treatment with Mn (500 mg/kg) or with standard diet for 53 days. (h) Harvested whole brain lysates were blotted for rat APP (clone 22C11) and H-Ferritin (clone D1D4). β-actin served as loading control. (i) Densitometric quantification of APP and H-Ferritin were normalized to β-actin (each group: n=6). Representative western blots of IRP1, IRP2, Beclin-1 and LC3 are shown in Supplemental Fig. 5. Data are presented as mean ± SD. N number indicates number of individual animals. Differences were calculated by unpaired t-test (*, p<0.05; **, p<0.01).
In conclusion, we validated our in vitro data in two independent in vivo rodent models. Chronic and acute administration of Mn clearly resulted in suppressed protein expression of APP and H-Ferritin compared to respective controls.
DISCUSSION
Chronic environmental exposure to Mn results in its excessive accumulation in iron-rich brain regions such as the basal ganglia resulting in dystonic neurodegenerative movement disorders that resemble features of PD and PD-like syndromes (Pal et al. 1999, Chia et al. 1993, Guilarte 2013, Gorell et al. 1997). However, the primary mechanism(s) that drives and propagates Mn-induced neurotoxicity remains to be established.
Our study demonstrates for the first time that Mn simultaneously suppresses protein expression of APP and H-Ferritin in vitro and two independent in vivo settings. Mechanistically, the repression of APP and H-Ferritin is in part mediated post-transcriptionally via blocking the conserved 5’-UTR-dependent regions of their mRNA transcripts. We propose that this Mn-induced translational block is achieved by increased binding of IRP1 to the IRE sequences within the 5’-UTR of APP and H-Ferritin (see schematic model in Figure 7). Indeed, under iron-depleted conditions when aconitase loses its labile Fe2+ and thus converts to IRP1, the coordination chemistry of Mn closely resembles that of Fe2+, possibly allowing Mn to interact with Fe2+ in aconitase/IRP1 and altering its function (Zheng et al. 1998). Recently, comparative analysis of kinetic and thermodynamic properties of IRP1 showed that Mn results in a 12-fold increase of IRE-mRNA/IRP1 binding, while Fe2+ decreases the interaction between IRP1 and IRE sequences (Khan et al. 2017). As part of a physiological reaction, iron treatment (in the form of FAC) is tightly regulated to avoid free generation of toxic Fe2+. Iron exposure results in the release of IRPs from IRE-containing mRNAs, enhancing the coordinated translation of iron-related genes (Bogdan et al. 2016). Consistently, we observed that FAC treatment in neuronal cells resulted in a concentration- and time-dependent induction of the iron storage protein H-Ferritin and APP that facilitates the stability of membrane-bound FPN, each capable in reducing the amount of intracellular toxic redox-active Fe2+ (Duce et al. 2010, Wong et al. 2014, McCarthy et al. 2014). Conversely, we could demonstrate that Mn-mediated suppression of APP and H-Ferritin resulted in an increase of free Fe2+, accelerating toxic cytoplasmic and lipid ROS accumulation (Figure 7). Recently, Tai et al. demonstrated that low millimolar doses of Mn resulted in increased autophagic ferritin degradation also known as ferritinophagy (Tai et al. 2016). In this regard, we tested alteration of autophagy markers LC3B and Beclin-1 and observed no marked induction of both autophagy markers in Mn-treated rat brains compared to controls, thus suggesting that autophagic ferritin degradation is unlikely to explain our findings in our in vivo setting (Supplemental Fig. 5 b,c).
Figure 7: Proposed model for Mn-induced neurotoxicity.

(a) Under physiological conditions, free ferrous iron (Fe2+) causes IRP1 release from iron responsive elements (IRE) that are located within the 5’-untranslated regions (5’-UTRs) of APP and H-Ferritin mRNA inducing enhanced ribosomal protein translation. To counteract toxic redox-active Fe2+ levels, APP facilitates the stabilization of membrane-bound Fe2+-exporter ferroportin (FPN) while H-Ferritin safely sequesters Fe2+ via conversion to redox-inactive Fe3+. (b) Manganese (Mn) decreases APP and H-Ferritin protein translation by increasing the binding of IRP1 to the IRE on the 5’-UTR of APP and H-Ferritin mRNA. Translational blockage of APP and H-Ferritin results in accumulation of toxic Fe2+ that fuels the generation of reactive oxygen species (ROS), ultimately resulting in neurotoxicity.
We furthermore demonstrated that forced expression of APP suppressed Mn-mediated toxic cytoplasmic ROS and lipidperoxidation generation and even partially rescued cellular toxicity. Moreover, FAC pretreatment could partially rescue increased Mn toxicity in wildtype APP+/+ MEFs, while a similar FAC pretreatment presented no such significant protective effects in APP−/− cells, altogether underlining the integral involvement of APP as a neuroprotective and iron homeostatic gene product capable in attenuating Mn toxicity.
In summary, Mn-altered IRP1/IRE-binding affinity coordinates the translational suppression of neuroprotective APP and H-Ferritin that in turn leads to a profound increase of redox-active iron, providing a more complete explanation of the Mn-induced shift in the Fe2+/Fe3+ ratio and neurotoxic oxidative stress accumulation that we and others previously observed in vitro and in vivo (Fernsebner et al. 2014, Kwik-Uribe et al. 2003, Neth et al. 2015).
Supplementary Material
Acknowledgments and conflict of interest disclosure
The authors would gratefully thank Katharina Fernsebner (Helmholtz Zentrum München) for providing rat brains and IC-ICP-OES data, Sabrina Becker (FACS core facility, University Medical Center Göttingen), Wong Fongying and Rachit Bakshi (Massachusetts General Hospital and Harvard Medical School) for excellent technical assistance, Susann Diegmann (Department of Neuropediatrics, University Medical Center Göttingen) for ALK Sanger sequencing of SH-SY5Y cells, Ulrike Müller (University Heidelberg) for providing APP+/+ and APP−/− MEFs and Christopher J. Chang (University of California, Berkeley) for critical discussion and data analysis of IP-1 and Rho-Nox1 experiments, and Jens C. Hamann (Weil Cornell Medicine) for critical reading and editing of the manuscript. VV was supported by the intramural research grant (Forschungsförderung) of the University Medical Center Göttingen and the Else-Kröner-Fresenius Foundation. XH and JTR are partially supported by a NIH grant (R01AG056614 to XH). DKL is supported by a NIHR01 grant (AG051086 and P30AG010133). FW is supported by the National Natural Science Foundation of China (31530034, and 31330036). The authors have no conflict of interest to declare.
Abbreviations used
- (APP)
amyloid precursor protein
- (ATCC)
American Type Culture Collection
- (DFO)
Deferoxamine mesylate salt
- (H-Ferritin)
Ferritin heavy-chain
- (IRP)
Iron responsive protein
- (IRE)
Iron responsive element
- (FAC)
Ferric ammonium citrate
- (Mn)
Manganese
- (MnSOD)
Mn superoxide dismutase
- (ppm)
Part per million
- (ROS)
Reactive oxygen species
- (RRIDs)
Research Resource Identifiers
- (UTR)
Untranslated region
Footnotes
Conflict of interest statement: The authors declare no conflict of interest whatsoever
Open Science Badges
This article has received a badge for *Open Materials* because it provided all relevant information to reproduce the study in the manuscript. The complete Open Science Disclosure form for this article can be found at the end of the article. More information about the Open Practices badges can be found at https://cos.io/our-services/open-science-badges/.
REFERENCES
- Adachi T, Nonomura S, Horiba M, Hirayama T, Kamiya T, Nagasawa H and Hara H (2016) Iron stimulates plasma-activated medium-induced A549 cell injury. Sci Rep, 6, 20928. [DOI] [PMC free article] [PubMed] [Google Scholar]
- Anderson CP, Shen M, Eisenstein RS and Leibold EA (2012) Mammalian iron metabolism and its control by iron regulatory proteins. Biochim Biophys Acta, 1823, 1468–1483. [DOI] [PMC free article] [PubMed] [Google Scholar]
- Archibald FS and Tyree C (1987) Manganese poisoning and the attack of trivalent manganese upon catecholamines. Archives of Biochemistry and Biophysics, 256, 638–650. [DOI] [PubMed] [Google Scholar]
- Aron AT, Reeves AG and Chang CJ (2018) Activity-based sensing fluorescent probes for iron in biological systems. Current opinion in chemical biology, 43, 113–118. [DOI] [PMC free article] [PubMed] [Google Scholar]
- Au-Yeung HY, Chan J, Chantarojsiri T and Chang CJ (2013) Molecular Imaging of Labile Iron(II) Pools in Living Cells with a Turn-On Fluorescent Probe. Journal of the American Chemical Society, 135, 15165–15173. [DOI] [PMC free article] [PubMed] [Google Scholar]
- Ayton S, Lei P, Hare DJ et al. (2015) Parkinson’s disease iron deposition caused by nitric oxide-induced loss of beta-amyloid precursor protein. J Neurosci, 35, 3591–3597. [DOI] [PMC free article] [PubMed] [Google Scholar]
- Bandyopadhyay S, Ni J, Ruggiero A, Walshe K, Rogers MS, Chattopadhyay N, Glicksman MA and Rogers JT (2006) A high-throughput drug screen targeted to the 5’untranslated region of Alzheimer amyloid precursor protein mRNA. Journal of biomolecular screening, 11, 469–480. [DOI] [PubMed] [Google Scholar]
- Bayer TA, Cappai R, Masters CL, Beyreuther K and Multhaup G (1999) It all sticks together--the APP-related family of proteins and Alzheimer’s disease. Mol Psychiatry, 4, 524–528. [DOI] [PubMed] [Google Scholar]
- Bogdan AR, Miyazawa M, Hashimoto K and Tsuji Y (2016) Regulators of Iron Homeostasis: New Players in Metabolism, Cell Death, and Disease. Trends Biochem Sci, 41, 274–286. [DOI] [PMC free article] [PubMed] [Google Scholar]
- Chia SE, Foo SC, Gan SL, Jeyaratnam J and Tian CS (1993) Neurobehavioral functions among workers exposed to manganese ore. Scandinavian journal of work, environment & health, 19, 264–270. [DOI] [PubMed] [Google Scholar]
- Cho HH, Cahill CM, Vanderburg CR, Scherzer CR, Wang B, Huang X and Rogers JT (2010) Selective translational control of the Alzheimer amyloid precursor protein transcript by iron regulatory protein-1. J Biol Chem, 285, 31217–31232. [DOI] [PMC free article] [PubMed] [Google Scholar]
- Chua AC and Morgan EH (1996) Effects of iron deficiency and iron overload on manganese uptake and deposition in the brain and other organs of the rat. Biological trace element research, 55, 39–54. [DOI] [PubMed] [Google Scholar]
- Dixon SJ, Lemberg KM, Lamprecht MR et al. (2012) Ferroptosis: an iron-dependent form of nonapoptotic cell death. Cell, 149, 1060–1072. [DOI] [PMC free article] [PubMed] [Google Scholar]
- Dobson AW, Erikson KM and Aschner M (2004) Manganese neurotoxicity. Ann N Y Acad Sci, 1012, 115–128. [DOI] [PubMed] [Google Scholar]
- Duce JA, Tsatsanis A, Cater MA et al. (2010) Iron-export ferroxidase activity of beta-amyloid precursor protein is inhibited by zinc in Alzheimer’s disease. Cell, 142, 857–867. [DOI] [PMC free article] [PubMed] [Google Scholar]
- Farina M, Avila DS, da Rocha JB and Aschner M (2013) Metals, oxidative stress and neurodegeneration: a focus on iron, manganese and mercury. Neurochem Int, 62, 575–594. [DOI] [PMC free article] [PubMed] [Google Scholar]
- Fernsebner K, Zorn J, Kanawati B, Walker A and Michalke B (2014) Manganese leads to an increase in markers of oxidative stress as well as to a shift in the ratio of Fe(II)/(III) in rat brain tissue. Metallomics : integrated biometal science, 6, 921–931. [DOI] [PubMed] [Google Scholar]
- Gaschler MM and Stockwell BR (2017) Lipid peroxidation in cell death. Biochemical and Biophysical Research Communications, 482, 419–425. [DOI] [PMC free article] [PubMed] [Google Scholar]
- Gitler AD, Chesi A, Geddie ML et al. (2009) Alpha-synuclein is part of a diverse and highly conserved interaction network that includes PARK9 and manganese toxicity. Nat Genet, 41, 308–315. [DOI] [PMC free article] [PubMed] [Google Scholar]
- Goforth JB, Anderson SA, Nizzi CP and Eisenstein RS (2010) Multiple determinants within iron-responsive elements dictate iron regulatory protein binding and regulatory hierarchy. RNA, 16, 154–169. [DOI] [PMC free article] [PubMed] [Google Scholar]
- Gorell JM, Johnson CC, Rybicki BA, Peterson EL, Kortsha GX, Brown GG and Richardson RJ (1997) Occupational exposures to metals as risk factors for Parkinson’s disease. Neurology, 48, 650–658. [DOI] [PubMed] [Google Scholar]
- Guilarte TR (2013) Manganese and Parkinson’s disease: a critical review and new findings. Environ Health Perspect, 118, 1071–1080. [DOI] [PMC free article] [PubMed] [Google Scholar]
- Gunshin H, Mackenzie B, Berger UV, Gunshin Y, Romero MF, Boron WF, Nussberger S, Gollan JL and Hediger MA (1997) Cloning and characterization of a mammalian proton-coupled metal-ion transporter. Nature, 388, 482. [DOI] [PubMed] [Google Scholar]
- Haass C and Selkoe DJ (2007) Soluble protein oligomers in neurodegeneration: lessons from the Alzheimer’s amyloid beta-peptide. Nat Rev Mol Cell Biol, 8, 101–112. [DOI] [PubMed] [Google Scholar]
- Hentze MW, Muckenthaler MU, Galy B and Camaschella C (2010) Two to tango: regulation of Mammalian iron metabolism. Cell, 142, 24–38. [DOI] [PubMed] [Google Scholar]
- Ke Y, Wu J, Leibold EA, Walden WE and Theil EC (1998) Loops and bulge/loops in iron-responsive element isoforms influence iron regulatory protein binding. Fine-tuning of mRNA regulation? J Biol Chem, 273, 23637–23640. [DOI] [PubMed] [Google Scholar]
- Kehrer JP (2000) The Haber-Weiss reaction and mechanisms of toxicity. Toxicology, 149, 43–50. [DOI] [PubMed] [Google Scholar]
- Khan MA, Walden WE, Theil EC and Goss DJ (2017) Thermodynamic and Kinetic Analyses of Iron Response Element (IRE)-mRNA Binding to Iron Regulatory Protein, IRP1. Scientific Reports, 7, 8532. [DOI] [PMC free article] [PubMed] [Google Scholar]
- Kwik-Uribe CL, Reaney S, Zhu Z and Smith D (2003) Alterations in cellular IRP-dependent iron regulation by in vitro manganese exposure in undifferentiated PC12 cells. Brain Res, 973, 1–15. [DOI] [PubMed] [Google Scholar]
- Li ZW, Stark G, Gotz J, Rulicke T, Gschwind M, Huber G, Muller U and Weissmann C (1996) Generation of mice with a 200-kb amyloid precursor protein gene deletion by Cre recombinase-mediated site-specific recombination in embryonic stem cells. Proc Natl Acad Sci U S A, 93, 6158–6162. [DOI] [PMC free article] [PubMed] [Google Scholar]
- McCarthy RC, Park YH and Kosman DJ (2014) sAPP modulates iron efflux from brain microvascular endothelial cells by stabilizing the ferrous iron exporter ferroportin. EMBO Rep, 15, 809–815. [DOI] [PMC free article] [PubMed] [Google Scholar]
- Müller UC, Deller T and Korte M (2017) Not just amyloid: physiological functions of the amyloid precursor protein family. Nature Reviews Neuroscience, 18, 281. [DOI] [PubMed] [Google Scholar]
- Neth K, Lucio M, Walker A, Zorn J, Schmitt-Kopplin P and Michalke B (2015) Changes in Brain Metallome/Metabolome Pattern due to a Single i.v. Injection of Manganese in Rats. PLOS ONE, 10, e0138270. [DOI] [PMC free article] [PubMed] [Google Scholar]
- Niwa M, Hirayama T, Okuda K and Nagasawa H (2014) A new class of high-contrast Fe(II) selective fluorescent probes based on spirocyclized scaffolds for visualization of intracellular labile iron delivered by transferrin. Organic & biomolecular chemistry, 12, 6590–6597. [DOI] [PubMed] [Google Scholar]
- Pal PK, Samii A and Calne DB (1999) Manganese neurotoxicity: a review of clinical features, imaging and pathology. Neurotoxicology, 20, 227–238. [PubMed] [Google Scholar]
- Peres TV, Schettinger MR, Chen P, Carvalho F, Avila DS, Bowman AB and Aschner M (2016) “Manganese-induced neurotoxicity: a review of its behavioral consequences and neuroprotective strategies”. BMC Pharmacol Toxicol, 17, 57. [DOI] [PMC free article] [PubMed] [Google Scholar]
- Quadri M, Federico A, Zhao T et al. (2012) Mutations in SLC30A10 Cause Parkinsonism and Dystonia with Hypermanganesemia, Polycythemia, and Chronic Liver Disease. American Journal of Human Genetics, 90, 467–477. [DOI] [PMC free article] [PubMed] [Google Scholar]
- Quintana M, Klouda AD, Gondikas A, Ochsenkuhn-Petropoulou M and Michalke B (2006) Analysis of size characterized manganese species from liver extracts using capillary zone electrophoresis coupled to inductively coupled plasma mass spectrometry (CZE-ICP-MS). Analytica chimica acta, 573–574, 172–180. [DOI] [PubMed] [Google Scholar]
- Rogers JT, Randall JD, Cahill CM et al. (2002) An iron-responsive element type II in the 5’-untranslated region of the Alzheimer’s amyloid precursor protein transcript. J Biol Chem, 277, 45518–45528. [DOI] [PubMed] [Google Scholar]
- Rogers JT, Venkataramani V, Washburn C, Liu Y, Tummala V, Jiang H, Smith A and Cahill CM (2016) A Role for Amyloid Precursor Protein Translation to Restore Iron Homeostasis and Ameliorate Lead (Pb) Neurotoxicity. J Neurochem. [DOI] [PubMed] [Google Scholar]
- Sato I, Matsusaka N, Kobayashi H and Nishimura Y (1996) Effects of dietary manganese contents on 54Mn metabolism in mice. Journal of radiation research, 37, 125–132. [DOI] [PubMed] [Google Scholar]
- Segura-Aguilar J and Lind C (1989) On the mechanism of the Mn3+-induced neurotoxicity of dopamine: Prevention of quinone-derived oxygen toxicity by DT diaphorase and superoxide dismutase. Chemico-Biological Interactions, 72, 309–324. [DOI] [PubMed] [Google Scholar]
- Selkoe DJ (2001) Alzheimer’s disease: genes, proteins, and therapy. Physiol Rev, 81, 741–766. [DOI] [PubMed] [Google Scholar]
- Sies H (2015) Oxidative stress: a concept in redox biology and medicine. Redox Biology, 4, 180–183. [DOI] [PMC free article] [PubMed] [Google Scholar]
- Sisodia SS (1992) Beta-amyloid precursor protein cleavage by a membrane-bound protease. Proc Natl Acad Sci U S A, 89, 6075–6079. [DOI] [PMC free article] [PubMed] [Google Scholar]
- Solovyev N, Vinceti M, Grill P, Mandrioli J and Michalke B (2017) Redox speciation of iron, manganese, and copper in cerebrospinal fluid by strong cation exchange chromatography - sector field inductively coupled plasma mass spectrometry. Analytica chimica acta, 973, 25–33. [DOI] [PubMed] [Google Scholar]
- Stockwell BR, Friedmann Angeli JP, Bayir H et al. (2017) Ferroptosis: A Regulated Cell Death Nexus Linking Metabolism, Redox Biology, and Disease. Cell, 171, 273–285. [DOI] [PMC free article] [PubMed] [Google Scholar]
- Tai YK, Chew KCM, Tan BWQ, Lim K-L and Soong TW (2016) Iron mitigates DMT1-mediated manganese cytotoxicity via the ASK1-JNK signaling axis: Implications of iron supplementation for manganese toxicity. Scientific Reports, 6, 21113. [DOI] [PMC free article] [PubMed] [Google Scholar]
- Tan J, Zhang T, Jiang L, Chi J, Hu D, Pan Q, Wang D and Zhang Z (2011) Regulation of intracellular manganese homeostasis by Kufor-Rakeb syndrome-associated ATP13A2 protein. J Biol Chem, 286, 29654–29662. [DOI] [PMC free article] [PubMed] [Google Scholar]
- Tenopoulou M, Kurz T, Doulias PT, Galaris D and Brunk UT (2007) Does the calcein-AM method assay the total cellular ‘labile iron pool’ or only a fraction of it? Biochem J, 403, 261–266. [DOI] [PMC free article] [PubMed] [Google Scholar]
- Thomson AM, Cahill CM, Cho HH, Kassachau KD, Epis MR, Bridges KR, Leedman PJ and Rogers JT (2005) The acute box cis-element in human heavy ferritin mRNA 5’-untranslated region is a unique translation enhancer that binds poly(C)-binding proteins. J Biol Chem, 280, 30032–30045. [DOI] [PubMed] [Google Scholar]
- Tuschl K, Clayton PT, Gospe SM Jr. et al. (2012) Syndrome of hepatic cirrhosis, dystonia, polycythemia, and hypermanganesemia caused by mutations in SLC30A10, a manganese transporter in man. Am J Hum Genet, 90, 457–466. [DOI] [PMC free article] [PubMed] [Google Scholar]
- Venkataramani V, Rossner C, Iffland L, Schweyer S, Tamboli IY, Walter J, Wirths O and Bayer TA (2010) Histone deacetylase inhibitor valproic acid inhibits cancer cell proliferation via down-regulation of the alzheimer amyloid precursor protein. J Biol Chem, 285, 10678–10689. [DOI] [PMC free article] [PubMed] [Google Scholar]
- Venkataramani V, Thiele K, Behnes CL et al. (2012) Amyloid Precursor Protein Is a Biomarker for Transformed Human Pluripotent Stem Cells. Am J Pathol. [DOI] [PubMed] [Google Scholar]
- Wong BX, Tsatsanis A, Lim LQ, Adlard PA, Bush AI and Duce JA (2014) beta-Amyloid precursor protein does not possess ferroxidase activity but does stabilize the cell surface ferrous iron exporter ferroportin. PLoS One, 9, e114174. [DOI] [PMC free article] [PubMed] [Google Scholar]
- Zheng H and Koo EH (2011) Biology and Pathophysiology of the Amyloid Precursor Protein. Mol Neurodegener, 6, 27. [DOI] [PMC free article] [PubMed] [Google Scholar]
- Zheng W, Ren S and Graziano JH (1998) Manganese inhibits mitochondrial aconitase: a mechanism of manganese neurotoxicity1Published on the World Wide Web on 3 June 1998.1. Brain Research, 799, 334–342. [DOI] [PMC free article] [PubMed] [Google Scholar]
Associated Data
This section collects any data citations, data availability statements, or supplementary materials included in this article.