Abstract
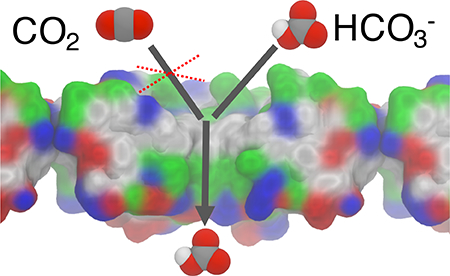
Carboxysomes are closed polyhedral cellular microcompartments that increase the efficiency of carbon fixation in autotrophic bacteria. Carboxysome shells consist of small proteins that form hexameric units with semi-permeable central pores containing binding sites for anions. This feature is thought to selectively allow access to RuBisCO enzymes inside the carboxysome by (the dominant form of CO2 in the aqueous solution at pH 7.4) but not O2, which leads to a non-productive reaction. To test this hypothesis, here we use molecular dynamics simulations to characterize the energetics and permeability of CO2, O2, and through the central pores of two different shell proteins, namely, CsoS1A of α-carboxysome and CcmK4 of β-carboxysome shells. We find that the central pores are in fact selectively permeable to anions such as , as predicted by the model.
Abstract Graphic
Introduction
All life depends on the ability of cells to fix atmospheric carbon into organic matter. The key enzyme in this process is ribulose-1,5-bisphosphate carboxylase/oxygenase (RuBisCO), which catalyzes the fixation reaction of CO2 and ribulose-1,5-bisphosphate (RuBP) molecules to produce two molecules of 3-phosphoglycerate (3PGA), a precursor molecule for sugar and amino acid biosynthesis. Besides fixing CO2 and RuBP, the enzyme fixes O2 and RuBP, producing one molecule of 3PGA and one molecule of 2-phosphoglycolate, a wasteful compound.1–5 RuBisCO is notoriously inefficient with Km of >150μM for CO2 and kcat of the reaction in the order of 10s−1.6–8 It is important to note that the concentration of O2 in the atmosphere is ∼21% whereas that of CO2 is only ∼0.04%, which is lower than the Km of CO2 for the RuBisCO enzymes.3,5
To increase the efficiency of RuBisCO, cyanobacteria and carbon-fixing chemoautotrophic bacteria encapsulate RuBisCO and carbonic anhydrase in specialized protein-enclosed cytoplasmic microcompartments called carboxysome.9–12 To mitigate the occurrence of the O2 fixation reaction, the carboxysome needs to minimize the penetration of O2 into its lumen by mechanisms that would also impact effective entry of CO2 due to its chemical resemblance to O2. CO2 is envisioned to enter the carboxysomal lumen in the form of , 10,11,13 its predominant form at physiological pH. Carbonic anhydrase then converts the to CO2, 14 providing a mechanism for concentrating CO2 in the immediate vicinity of the RuBisCO enzymes.
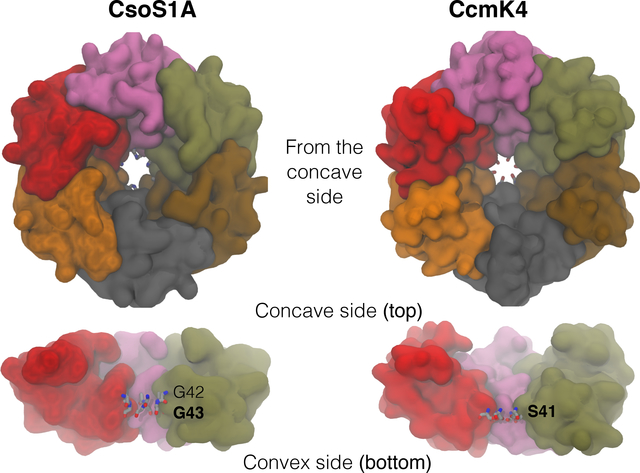
Carboxysomes are classified into α and β types, based on their composition and evolutionary history.3 In their native forms, both types resemble icosahedral capsids with a diameter of ∼1,000 Å.9,15–18 The outer shell of the carboxysome is formed by the assembly of thousands of copies of a few proteins,2 which has been computationally examined at molecular19 and cellular20 levels. α carboxysomes are found in Prochlorococcus and Synechococcus species such as Halothiobacillus neapolitanus, and in some other chemoautotrophic bacteria. 2,3,11,13,21 Their main shell protein is CsoS1A, of which the structure was determined from H. neapolitanus.22 β carboxysomes are found in freshwater species such as Synechococcus elongates PCC 7942 and Synechocytis sp. PCC 6803,3,11,13,21 and their main shell proteins are CcmK1–4. These main shell proteins form hexamers and are arranged in a hexagonal lattice with aqueous-exposed surfaces on either side22–25 (Fig. 1). Along the 6-fold symmetry axis of each hexamer is a pore, termed “the central pore”, with the bottleneck radius of ∼2 Å,2 potentially permitting small molecular species, such as , CO2 and/or O2 molecules to pass through.
Figure 1:
Arrangement of carboxysome shell proteins CsoS1A and CcmK4. Top view from the concave side (upper panel) and side view (lower panel). Individual colored molecular surfaces represent individual subunits of the homohexamers. Each hexamer forms a central pore. The narrowest section (bottleneck) of the pore is formed by six G43 residues for CsoS1A and six S41 residues for CcmK4.
Here, we examine the permeability of , CO2, and O2 molecules through the central pores of CsoS1A and CcmK4 complexes in full atomic details using molecular dynamics simulations and free energy calculations. The umbrella sampling (US) technique is employed to calculate the free energy profiles for , CO2, and O2 insertion. We find that the central pore of carboxysome shells are preferentially selective for , over CO2 and O2.
Materials and Methods
Simulation systems
The simulations were prepared using the crystal structures of CsoS1A from H. neapolitanus (PDB entry 2EWH) resolved at 1.4 Å22 and CcmK4 from Synechocytis sp. PCC 6803 (PDB entry 2A18) resolved at 2.28 Å.23 CsoS1A is missing its first five amino acids. CcmK4 is missing its first three amino acids and its last thirteen amino acids. Since these amino acids are located neither near the central pore or at the interface of individual monomeric subunits, they were not modeled. The asymmetric unit of CsoS1A structure is provided by PDB as a monomer while that of CcmK4 structure is provided as a trimer. The biologically relevant hexameric complexes were constructed by VMD26 using the transformation matrices provided in the PDB files. Each modeled hexamer was centered at the origin so that the 6-fold symmetry axis (and the central pore) coincided with the z-axis. A hexameric periodic box was constructed according to the crystallographic dimensions given in the PDB files. Internal water molecules were added to each complex with DOWSER.27 The complex was then solvated with TIP3P waters28 and ionized with 150mM NaCl. The resulting hydrated hexameric CsoS1A and CcmK4 systems comprised 28,115 and 27,619 atoms, respectively.
Simulation protocols
The simulations were performed using NAMD229 with a time step of 2fs and the CHARMM36 force field.30,31 The periodic boundary condition (PBC) was used throughout the simulations. All covalent bonds involving hydrogen atoms were kept rigid using the SHAKE algorithm. 32 To evaluate long-range electrostatic interactions in PBC without truncation, the particle mesh Ewald method33 with a grid density of 1/Å3 was used. The cutoff for van der Waals interactions was set at 12 Å with the switching distance of 10 Å. The simulations were performed under NPT ensemble. The temperature was maintained at 300K by Langevin dynamics34 with a damping coefficient γ of 1/ps. The modified Nosé-Hoover method,34,35 in which Langevin dynamics is used to control fluctuations in the barostat, was used to maintain the pressure at 1atm with a piston period of 200fs.
Equilibration and steered molecular dynamics
The equilibrations of the hydrated complexes of CsoS1A and CcmK4 began with 5,000 steps of energy minimization using the conjugated gradient algorithm, followed by 0.5-ns protein heavy-atom restrained, 0.5-ns protein backbone-atom restrained and 1-ns protein Cα-atom restrained simulations with k =1kcal/mol/Å2, and finally 10–20ns unrestrained simulations. In the CsoS1A system, one of the simulated Cl− ions entered the central pore and bound to residues G43 (of the hexamer) located at the center of the pore during the unrestrained simulation. The binding of a Cl− ion was also observed in the equivalent section of CcmK4, corresponding to the backbones of residues S41. To simulate , CO2 or O2 molecule, the bound Cl− molecule was replaced by , CO2 or O2 molecules. The force field parameters of these substrate molecules are available in the CHARMM general force field.36 For the simulation systems with a CO2 or O2 molecule, one Na+ ion was removed for neutralization. 5,000 steps of energy minimization and 100ps of equilibration were performed on these three systems. Steered molecular dynamics simulations37 were performed to generate starting structures for the US simulations, described in the following section. The backbone nitrogen atoms of residues G42 of CsoS1A or residues S41 of CcmK4 were used to mark the center of the pore, and these were considered to be at z=0. Using the center of the pore as the starting point, the localized substrate molecule was pulled out of the pore at a velocity of 10 Å/ns using a force constant k =10kcal/mol/Å2. The simulation consisted of two sets. In one set, the molecule was pulled from z=0 to z=20 Å (towards the concave surface). In the other set, it was pulled from z=0 to z=−15 Å (towards the convex surface). To prevent protein translation artificially induced by the force applied on the pulling of the substrate molecule, the positions of Cα atoms of residue G6 of CsoS1A and those of residues E11 of CcmK4, located away from the pore, were restrained with k =10kcal/mol/Å2.
Umbrella sampling and free energy calculations
The free energy (ΔG) profiles of , CO2 and O2 translocation along the central pores were calculated using the US technique.38–40 The starting frames for the US simulations were taken from the steered molecular dynamics trajectories described above. US simulations spanned from z=−15 Å to z=20 Å, comprising 71 0.5-Å windows, and each simulation lasted 2.5ns. This 35-Å length is about the thickness of the carboxysome shell determined from cryo-electron tomography and atomic force microscopy.15,16,41 A harmonic potential with k =10kcal/mol/Å2 was applied to confine the substrate molecule to the center of each window. To construct the ΔG profiles, the last 2-ns trajectories of all of the simulations of a substrate were combined and analyzed using the weighted histogram analysis method (WHAM),42 with a 0.25- Å histogram bin. Insertion ΔG values of the substrate in individual bins (ΔGi) were subtracted by ΔG in the bulk solution (ΔGbulk), yielding relative insertion free energies (ΔGi,bulk). The WHAM code was implemented by Professor Alan Grossfield at the University of Rochester Medical Center (http://membrane.urmc.rochester.edu/sites/default/files/wham/doc.html).43 The tolerance value used was 0.000001, which is small enough indicated by no further changes in the free energy curve.
Analysis
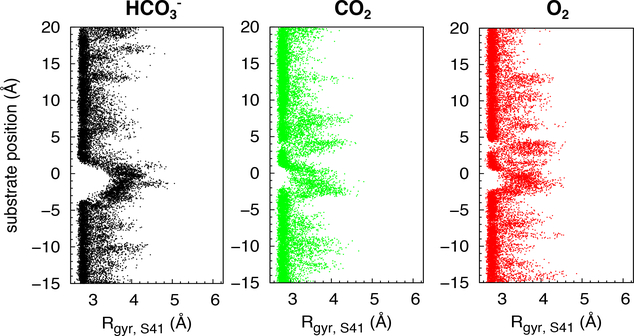
Local protein conformational changes upon the migration of substrate molecules through the pore were determined by calculating pore radii with the bottleck region (z∼0 Å) using the HOLE program44 and radius of gyration (Rgyr) of its encompassing amino acid residues. For CsoS1A, Rgyr were calculated using the backbone nitrogen atoms of the six G43 residues. For CcmK4, the bottleneck is encompassed by residues S41. Because in the crystal structure, the hydroxyl groups of S41 appear constricting the pore, Rgyr were calculated using the oxygen atoms of the hydroxyl groups.
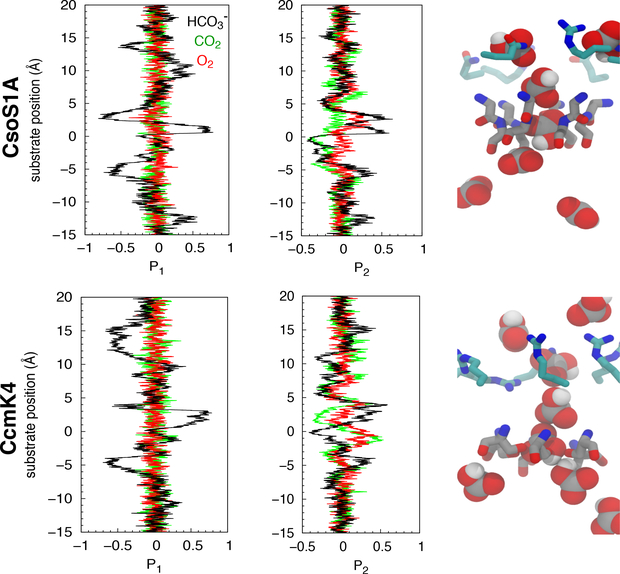
The orientations of migrating substrate molecules were determined by calculating P1 and P2 order parameters. P1 =<cosθ> and P2 =<(3cos2θ−1)/2>. P1 is ∼±1 when the molecule is oriented parallel to the pore axis and ∼0 when it is oriented either isotropically or perpendicularly with respect to the pore axis. P2 differentiates between isotropic average orientation (P2 =0) and orthogonality (P2 =−0.5), in which the molecule is in a perpendicular orientation. θ corresponds to the tilt angle with respect to the pore. For is the angle between the C-OH bond vector and the pore axis. For linear CO2 and O2 molecules, θ is the angle between the main axis of the substrate and the pore axis.
The diffusion coefficients of substrate molecules were calculated using the data obtained from US simulations. Lateral diffusion coefficients (Dxy) along individual z positions of the pore were calculated from the mean square displacement of a substrate molecule along the x and y axes, defined as < (Δx)2 + (Δy)2 > / 4Δt. The x and y coordinates were taken in every 10ps. Since no restraints were imposed along the x and y axes, we did not do any reweighting.
Because substrate translocation is related to the diffusivity of the substrate molecule along the z axis and its z-positions were restrained during the umbrella sampling simulations, the translational diffusion coefficients along the z axis of the pore (Dz) were calculated from the integral over the autocorrelation function of the applied restrained forces45,46 according to the fluctuation-dissipation theorem.47 Using the calculated ΔG and Dz profiles, the diffusive permeability coefficients (Pd) of substrates through the central pores were approximated using the solubility-diffusion model, expressed as
where dz is the bin size which is 0.25 Å. The pores spanned from z=−15 Å to z=20 Å, so the length used in the calculations was 35 Å, which is about the thickness of the carboxysome shell determined from cryo-electron tomography and atomic force microscopy.15,16,41
Results and Discussion
Hydration along the central pores
The hydrated complexes of CsoS1A and CcmK4 were simulated for 20 ns without RuBisCO substrates (i.e., , CO2, and O2) in order to relax the proteins and prepare initial structures used for the US simulations.
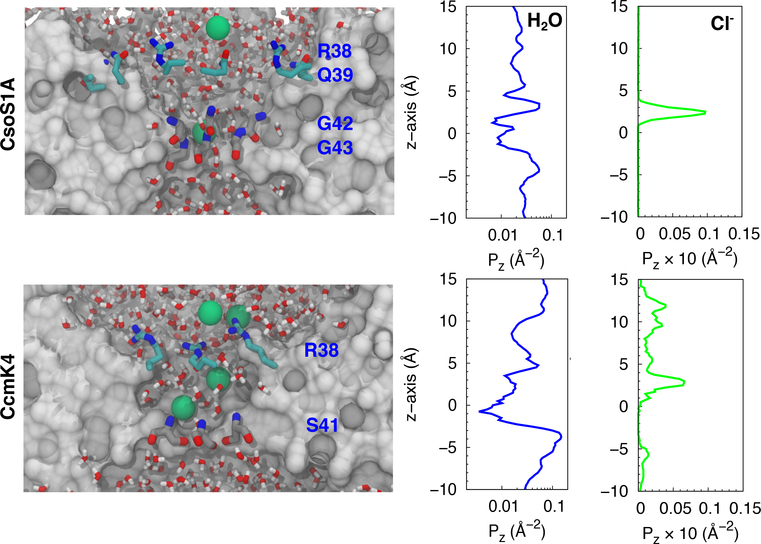
Although the central pores were initially dehydrated, they became hydrated in less than 1ns (Fig. 2). To determine the degree of hydration along each of the pores, a 14-Å radius cylinder covering the entire pore, including its concave and convex funnels, was defined. The z-coordinates of the oxygen atoms of water molecules localized within the cylinder during the last 10ns of the simulations were recorded and clustered into a histogram with 0.5-Å bins, yielding a distribution profile of the water. The pore radius profiles were calculated using the HOLE program44 to determine the degree of accessibility of the pores, and the water profiles were normalized with respect to cross-sectional areas along the sections within the pores. The normalized profiles shown in the middle panels of Fig. 2 represent the lowest occupancy site for water molecules at z=0, which corresponds to the narrowest section, or the bottleneck, of the pore (Fig. 3, right panels). For CsoS1A, this bottleneck is formed by residues G42 and G43. For CcmK4, the equivalent section is formed by residues S41.
Figure 2:
Hydration and Cl− partitioning along the central pores. Left panels, taken from the equilibrium simulations, delineate the localizations of water and Cl− (green spheres) within the central pores. Middle and right panels show the distribution profiles of water molecules and Cl− ions normalized using cross-sectional areas along the sections within the proes. The backbone nitrogen atoms of residues G43 of CsoS1A and S41 of CcmK4 mark the center of the pore and are considered z=0.
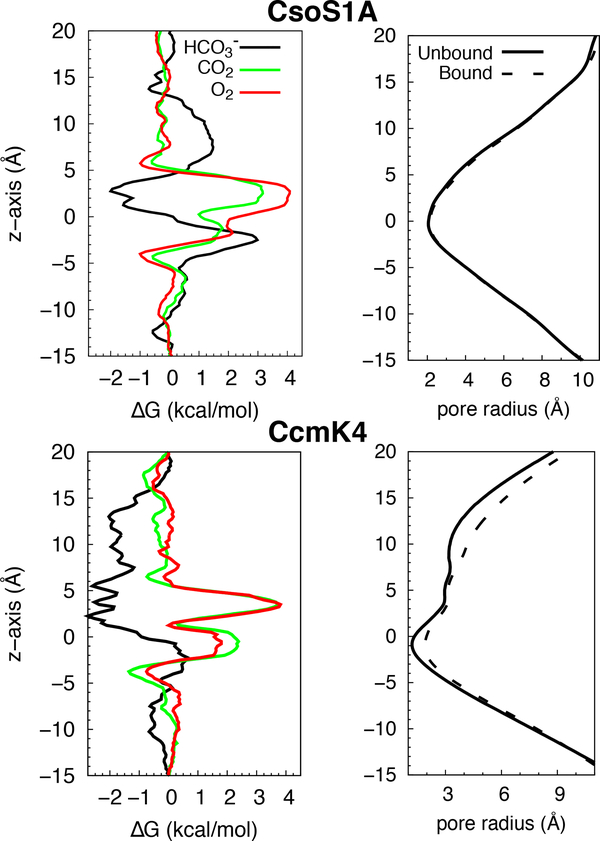
Figure 3:
Partitioning of the substrates along the central pores. Left, free energy (ΔG) profiles for inserting substrates of the RuBisCO enzymes along the pores. Right, pore radius profiles of the central pores in the presence and absence of the substrate. was used to represent the substrate as the other substrates similar profiles showed similar profiles.
These simulations along with previous structural studies suggest favorable anion binding along the central pores. During the 20-ns period of each of the simulations, spontaneous binding of Cl− ions was observed. The Cl− ions bound the amine groups of residues G43 of CsoS1A and those of residues S41 of CcmK4. As shown in the left panels of Fig. 2, the highest Cl− occupancy site was located at z=3 Å. For CcmK4, apparent accumulation of Cl− ions was also found near residues R38, which lie between z=8 Å and z=14 Å. The binding of other ions such as SO2− has also been reported by X-ray crystallography.22,48 The crystal structure of CsoS1A, which was used in the simulations, contains one SO2− molecule bound to the amine groups of G43.22 The same binding is also found in the crystal structures of CcmK1 and CcmK2, which are homologues of CcmK4.48 For CcmK1 and CcmK2, the serine residues equivalent to S41 of CcmK4 bind a SO42− molecule. These results all point to the presence of a positive electrostatic potential within the pore attracting negatively charged molecules.
Selectivity of anionic substrates
Free energy (ΔG) profiles of , CO2, and O2 insertion (Fig. 3, left panels) were calculated in order to determine the selectivity of the central pores for these substrates. In agreement with the results of our equilibrium simulations, the resulting free energy profiles demonstrate favorable binding of anionic species (i.e., ) to the central pores, in both CsoS1A and CcmK4. For insertion in CsoS1A, a free energy well was found in the region between z=1 Å and z=5 Å. The lowest ΔG was located at z=3 Å and is ∼−2kcal/mol. For CcmK4, favorable binding regions (relative to bulk water) spanned from z=1 Å to z=15 Å, with the global ΔG minimum of ∼−2.5kcal/mol occurring between z=2 Å and z=5 Å. Another binding region with a weaker insertion free energy (∼−2kcal/mol) is discernible between z=8 Å and z=14 Å, and corresponds to the position of a second Cl− binding site observed in one of our equilibrium simulations (Fig. 2, bottom panels).
While the binding of in the central pore is generally favorable, in both CsoS1A and CcmK4 central pores, this substrate has to overcome uphill free energy changes during its translocation from one side of the shell proteins to the other. Both CsoS1A and CcmK4 exhibited high free energy values at z=−2.5 Å, forming a barrier (Fig. 3, left panels). For CcmK4, this barrier against is significantly smaller compared to CO2 and O2. For CsoS1A, although the barrier height is about the same as that of CO2, the presence of a long attractive region (at 0 < z < 5 Å) may provide a higher probability for substrate presence right next to the barrier region.
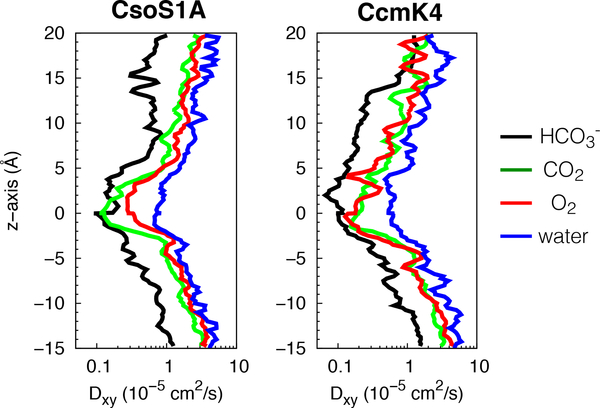
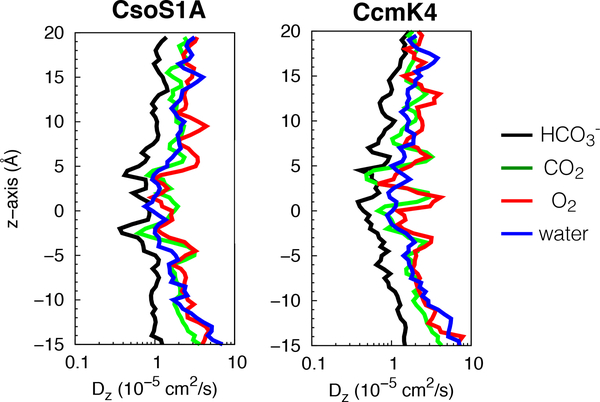
In contrast to , the permeation of CO2 and O2 through these central pores was more unfavorable with insertion ΔG of 2–4kcal/mol, extending from z=5 Å to z=−5 Å. The highest ΔG for CO2 and O2 insertion, ∼4kcal/mol, was located at z=∼3 Å, corresponding to the global ΔG minima for insertion (Fig. 3, left panels). The same section was found to have a high density of water molecules and Cl− ions (Fig. 2). In CsoS1A too, this highest barrier coincides with the region where the mobility of water molecules (as well as other molecular species) was found to be minimum (Fig. 4, left panel).
Figure 4:
Lateral diffusion coefficient (Dxy) profiles of , CO2, O2, and water molecules along the central pores of CsoS1A and CcmK4 hexamers.
Because compacted water molecules can hinder the passage of relatively nonpolar CO2 and O2, we analyzed the mobility of , CO2 and O2 along the central pores by calculating diffusion coefficients of these molecules. The diffusion profiles showed that the diffusivity of any of these molecules diminished as they approached the bottleneck (Fig. 4 and 5), consistent with a decrease in pore size (Fig. 3, right panels).
Figure 5:
Translational diffusion coefficient (Dz) profiles of , CO2, O2, and water molecules along the z axis of the central pores of CsoS1A and CcmK4 hexamers calculated from the integral over the autocorrelation function of the restrained force45,46 according to the fluctuation-dissipation theorem.47
We calculated the diffusive permeability coefficients (Pd) of the substrate molecules through the central pore. For CcmK4, the calculated Pd of was ∼47cm/s, significantly higher than those of CO2 (0.77cm/s) and O2 (0.75cm/s). For CsoS1A, the calculated Pd of was only ∼1.4cm/s, while those of CO2 and O2 were 1cm/s and 0.35cm/s, respectively. Lower permeability of in CsoS1A than in CcmK4 is most likely due to the presence of high free energy barrier at z=−2.5 Å (Fig. 3, left panels). Nevertheless, molecules passively migrate through the central pores faster than CO2 and O2 molecules. Stronger selectivty for over CO2 and O2, according to the free energy profiles (Fig. 3, left panels), provides a compensation for its slower mobility (Fig. 4 and 5).
Dynamics of protein and substrates
The movement of a molecule through a protein may involve not only structural perturbations of the protein, from breathing motions of lining amino acids49–52 to largescale conformational changes,53–57 but also the dynamics of the passing molecule (substrate or ligand).58 Although the pores of CsoS1A and CcmK4 are relatively wide to accommodate a free passage of small molecules, such as , CO2 and O2, the calculated ΔG profiles indicated that such molecules cannot pass through easily.
Pore radii along the central pores were re-calculated upon the localization of a substrate molecule within the bottleneck. For CsoS1A, the bottleneck pore radius remained ∼2 Å (Fig. 3, upper right panel). For CcmK4, it increased from 1.5 to 2 Å (Fig. 3, lower right panel). This change indicates a slight opening of the pathway, consistent with an increase in the radius of gyration between the six hydroxyl groups of S41 from 3 to 4 Å (Fig. 6). In this configuration, the hydroxyl groups of S41 are oriented away from the pathway. Nevertheless, the bottleneck pore radii of both CsoS1A and CcmK4 are ∼2 Å, suggesting that the permeating molecules have to orient themselves just right to transit through the bottleneck.
Figure 6:
Conformational changes of bottleneck residues in CcmK4 upon substrate binding along the pore determined by calculating the radius of gyration (Rgyr) of the hydroxyl groups of residues S41. This Rgyr was calculated because in the crystal structure, the hydroxyl groups of these bottleneck amino acids appear to constrict the permeation pathway.
Conformational selectivity of the substrates was determined by calculating P1 and P2 order parameters, shown in Fig. 7, delineating the binding orientation of the substrate molecules upon migrating along the pore. As shown in Fig. 7, the orientation of the substrates was isotropic near the protein surface or in the bulk solution (z<−10 Å or z>15 Å). became conformationally restricted when approaching or being within the bottleneck of the central pores. Upon positioning towards the concave surface, its negatively charged carboxylate faced the bottleneck when located at the ΔG minimum or z=3 Å, as indicated by P1 ∼−1. The molecule flipped by 180˚ during the transition between the ΔG minimum and the bottleneck, as indicated by P1 ∼1. Between the bottleneck and z=−5 Å (convex funnel), it became perpendicularly oriented with respect to the pore, indicated by P2 ∼−0.5.
Figure 7:
Binding orientation of substrates along the central pores determined by P1 and P2 order parameters with respect to substrate’s positions along the z-axis. The right panels show several snapshots of taken from the US simulations.
Charge distributions along the central pores
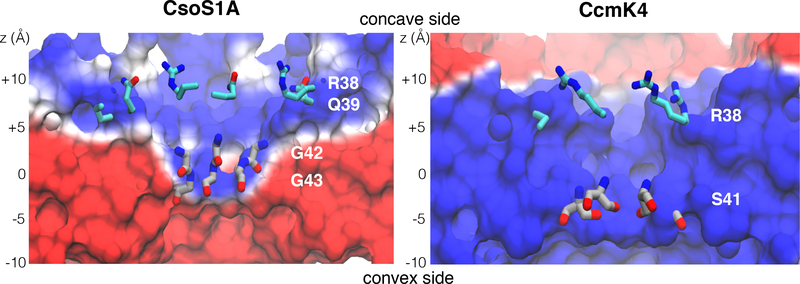
Electrostatic potential surface calculations support the preferential selectivity of the central pores of CsoS1A and CcmK4 for anions over nonpolar molecules. Time-averaged electrostatic potentials of the protein complexes were calculated using the structures of the protein hexamers generated from the last 10 ns of the equilibrium simulations (Fig. 8). The calculated electrostatic potential surfaces are consistent with ones previously calculated using the crystal structures,22,23 supporting the idea that the pores are highly charged.
Figure 8:
Electrostatic potential maps of the shell proteins. The maps were calculated using PMEpot plugin of VMD,26,59 which uses the particle mesh Ewald method.60 The ensemble of protein conformations collected in every 10ps was used in each calculation. Electrostatic potentials shown in this figure are with threshold ranging from −20 (red) to +20 (blue) kT/e. “positive” z is towards the concave surface, while “negative” z is towards the convex surface.
These calculations also rationalize the features observed in the calculated ΔG profiles (Fig. 3, left panels). For CcmK4, the central pore is positive, which provides attraction for HCO3– molecules. For CsoS1A, on the other hand, electrostatic potentials along the pore were asymmetrically distributed. The funnel from the concave surface to the bottleneck was positively charged, whereas the one from its convex surface was negatively charged (Fig. 8). This charge separation provides an explanation for the nature of the permeation ΔG barrier for at the bottleneck. Because the convex surface is negatively charged, it is unfavorable for negatively charged molecules, such as , to spontaneously transit through the bottleneck (z=−2.5 Å) from the concave surface to the convex surface. This is in agreement with the ΔG calculations, which showed a 2kcal/mol higher barrier for a molecule to enter the pore from the concave surface than from the convex surface.
Conclusion
The results of the simulations and free energy calculations presented in this study show that the central pores of carboxysome shell protein complexes favor over either CO2 or O2. Once within the carboxysomal lumen, is converted to CO2 by carbonic anhydrase. The poor permeability of the carboxysome shell to CO2 and O2 can improve the productivity of RuBisCO in two ways; not only can it minimize outward leakage of CO2 from carboxysomal lumen upon production by carbonic anhydrase, but it will also prevent unwanted entry of O2 into the lumen. These results substantiate, at a molecular level, how carboxysomes maintain the high local CO2 concentrations around the RuBisCO enzymes necessary for adequate performance of these otherwise inefficient enzymes. Consistent with the idea that the carboxysome shell acts as a barrier against the permeation of CO2, and that of O2, the experimental study by Dou et al61 on H. neapolitanus suggests that the CO2 supply into the carboxysome is provided mainly thorugh the entry of molecules. The activity of freely soluble RuBisCO enzymes was compared to the activity of the enzymes contained inside the intact carboxysome. The intact carboxysome devoid of carbonic anhydrase showed a 3-fold increase in Km of CO2 with no change in Vmax, while the ruptured carboxysome and carboxysome-free RuBisCO enzymes showed similar Km and Vmax to the wild type. As a consequence, they found that H. neapolitanus mutants lacking carbonic anhydrase required elevated CO2 to grow.
The observed substrate selectivity appears to originate from electrostatic properties of the central pores. Positive electrostatic potentials along the central pores establish strong binding affinities for negatively charged molecules, such as and Cl− ions. This notion is supported by the calculated favorable insertion free energies of from the umbrella sampling simulations and the captures of spontaneous Cl− binding during the equilibrium simulations. Favorable binding of facilitates its passage through the pore.
Supplementary Material
Acknowledgements
We thank Dr. Catherine Oikonomou for help revising the manuscript. This work was supported in part by the National Institutes of Health (NIH P41-GM104601, U01-GM111251 and U54-GM087519 to E.T.), the Office of Naval Research (ONR N00014-16-1-2535 to E.T.), and the Howard Hughes Medical Institute (to G.J.J.). P.M. gratefully acknowledges a previous support as a trainee of the Molecular Biophysics Training Program by the NIH (T32GM008276) during his graduate study.
Footnotes
Supporting Information Available
Included in the Supporting Information are diffusion coefficients of solutes molecules in bulk calculated using equilibrium (Fig. S1) and umbrella sampling MD trajectories (Tables S1 and S2).
References
- (1).Bauwe H; Hagemann M; Fernie AR Photorespiration: players, partners and origin. Trends in Plant Science 2010, 15, 330–336. [DOI] [PubMed] [Google Scholar]
- (2).Kinney JN; Axen SD; Kerfeld CA Comparative analysis of carboxysome shell proteins. Photosyn. Res 2011, 109, 21–32. [DOI] [PMC free article] [PubMed] [Google Scholar]
- (3).Rae BD; Long BM; Badger MR; Price GD Functions, compositions, and evolution of the two types of carboxysomes: Polyhedral microcompartments that facilitate CO2 fixation in cyanobacteria and some proteobacteria. Microbiol. Mol. Biol. Rev 2013, 77, 357–379. [DOI] [PMC free article] [PubMed] [Google Scholar]
- (4).van Lun M; Hub JS; van der Spoel D; Andersson I CO2 and O2 distribution in Rubisco suggests the small subunit functions as a CO2 reservoir. J. Am. Chem. Soc 2014, 136, 3165–3171. [DOI] [PubMed] [Google Scholar]
- (5).Bloom AJ Photorespiration and nitrate assimilation: A major intersection between plant carbon and nitrogen. Photosyn. Res 2015, 123, 117–128. [DOI] [PubMed] [Google Scholar]
- (6).Badger MR; Andrews TJ; Whitney SM; Ludwig M; Yellowlees DC; Leggat W; Price GD The diversity and coevolution of Rubisco plastids, pyrenoids, and chloroplast-based CO2-concentrating mechanisms in algae. Can. J. Biochem 1998, 76, 1052–1071. [Google Scholar]
- (7).Tcherkez GGB; Farquhar GD; Andrews TJ Despite slow catalysis and confused substrate specificity, all ribulose bisphosphate carboxylases may be nearly perfectly optimized. Proc. Natl. Acad. Sci. USA 2006, 19, 7246–7251. [DOI] [PMC free article] [PubMed] [Google Scholar]
- (8).Whitehead L; Long BM; Price GD; Badgers MR Comparing the in vivo function of α-carboxysomes and β-carboxysomes in two model cyanobacteria. Plant Physiol. 2014, 165, 398–411. [DOI] [PMC free article] [PubMed] [Google Scholar]
- (9).Shively JM; Ball F; Brown DH; Saunders RE Functional organelles in prokaryotes: Polyhedral inclusions (carboxysomes) of Thiobacillus neapolitanus. Science 1973, 182, 584–586. [DOI] [PubMed] [Google Scholar]
- (10).Kaplan A; Reinhold L CO2 concentrating mechanism in photosynthetic microorganisms. Annu. Rev. Plant Physiol. Plant Mol. Biol 1999, 50, 537–570. [DOI] [PubMed] [Google Scholar]
- (11).Badger MR; Price GD CO2 concentrating mechanisms in cyanobacteria: Molecular components, their diversity and evolution. J. Exp. Bot 2003, 54, 609–622. [DOI] [PubMed] [Google Scholar]
- (12).Cameron JC; Wilson SC; Bernstein SL; Kerfeld CA Biogenesis of a bacterial organelle: The carboxysome assembly pathway. Cell 2013, 155, 1131–1140. [DOI] [PubMed] [Google Scholar]
- (13).Price GD Inorganic carbon transporters of the cyanobacteria CO2 concentrating mechanism. Photosyn. Res 2011, 109, 47–57. [DOI] [PubMed] [Google Scholar]
- (14).Cannon GC; Heinhorst S; Kerfeld CA Carboxysomal carbonic anhydrases: Structure and role in microbial CO2 fixation. Biochim. Biophys. Acta, Proteins Proteomics 2010, 1804, 382–392. [DOI] [PubMed] [Google Scholar]
- (15).Schmid MF; Paredes AM; Khant HA; Soyer F; Aldrich HC; Chiu W; Shively JM Structure of Halothiobacillus neapolitanus carboxysomes by cryo-electron tomography. J. Mol. Biol 2006, 364, 526–535. [DOI] [PMC free article] [PubMed] [Google Scholar]
- (16).Iancu CV; Ding HJ; Morris DM; Dias DP; Gonzales AD; Martino A; Jensen GJ The structure of isolated Synechococcus strain WH8102 carboxysomes as revealed by electron cryotomography. J. Mol. Biol 2007, 372, 764–773. [DOI] [PMC free article] [PubMed] [Google Scholar]
- (17).Tanaka S; Kerfeld CA; Sawaya MR; Cai F; Heinhorst S; Cannon GC; Yeates TO Atomic-level models of the bacterial carboxysome shell. Science 2008, 319, 1083–1086. [DOI] [PubMed] [Google Scholar]
- (18).Bonacci W; Teng PK; Afonso B; Niederrholtmeyer H; Grob P; Silver PA; Savage DF Modularity of a carbon-fixing protein organelle. Proc. Natl. Acad. Sci. USA 2012, 109, 478–483. [DOI] [PMC free article] [PubMed] [Google Scholar]
- (19).Mahalik JP; Brown KA; Cheng X; Fuentes-Cabrera M Theoretical study of the initial stages of self-assembly of a carboxysome’s facet. 2016, 10, 5751–5758. [DOI] [PubMed] [Google Scholar]
- (20).Perlmutter JD; Mohajerani F; Hagan MF Many-molecule encapsulation by an icosahedral shell. eLife 2016, 5, e14078. [DOI] [PMC free article] [PubMed] [Google Scholar]
- (21).Yeates TO; Kerfeld C; Heinhorst S; Cannon GC; Shively JM Protein-based organelles in bacteria: Carboxysomes and related microcompartments. Nat. Rev. Microbiol 2008, 6, 681–691. [DOI] [PubMed] [Google Scholar]
- (22).Tsai Y; Sawaya MR; Cannon GC; Cai F; Williams EB; Heinhorst S; Kerfeld CA; Yeates TO Structural analysis of CsoS1A and the protein shell of the Halothiobacillus neapolitanus carboxysome. PLoS Biol. 2007, 5, e144. [DOI] [PMC free article] [PubMed] [Google Scholar]
- (23).Kerfeld CA; Sawaya MR; Tanaka S; Nguyen CV; Phillips M; Beeby M; Yeates TO Protein structures forming the shell of primitive bacterial organelles. Science 2005, 309, 936–938. [DOI] [PubMed] [Google Scholar]
- (24).Rae BD; Long BM; Badger MR; Price GD Structural determinants of the outer shell of β-carboxysomes in Synechococcus elongatus PCC 7942: roles for CcmK2, K3-K4, CcmO and CcmL. PLoS One 2012, 7, e43871. [DOI] [PMC free article] [PubMed] [Google Scholar]
- (25).Cai F; Sutter M; Bernstein SL; Kinney JN; Kerfeld CA Engineering bacterial microcompartment shells: Chimeric shell proteins and chimeric carboxysome shells. ACS Synt. Biol 2014, 4, 444–453. [DOI] [PubMed] [Google Scholar]
- (26).Humphrey W; Dalke A; Schulten K VMD – Visual Molecular Dynamics. J. Mol. Graphics 1996, 14, 33–38. [DOI] [PubMed] [Google Scholar]
- (27).Zhang L; Hermans J Hydrophilicity of cavities in proteins. Proteins: Struct., Func., Gen 1996, 24, 433–438. [DOI] [PubMed] [Google Scholar]
- (28).Jorgensen WL; Chandrasekhar J; Madura JD; Impey RW; Klein ML Comparison of simple potential functions for simulating liquid water. J. Chem. Phys 1983, 79, 926–935. [Google Scholar]
- (29).Phillips JC; Braun R; Wang W; Gumbart J; Tajkhorshid E; Villa E; Chipot C; Skeel RD; Kale L; Schulten K Scalable molecular dynamics with NAMD. J. Comp. Chem 2005, 26, 1781–1802. [DOI] [PMC free article] [PubMed] [Google Scholar]
- (30).MacKerell., Bashford AD, Bellott D, Dunbrack M, Evanseck RL, Field JD, Fischer MJ, Gao S, Guo J, Ha, S H et al. All-atom empirical potential for molecular modeling and dynamics studies of proteins. J. Phys. Chem. B 1998, 102, 3586–3616. [DOI] [PubMed] [Google Scholar]
- (31).Best RB; Zhu X; Shim J; Lopes PEM; Mittal J; Feig M; MacKerell AD Optimization of the additive CHARMM all-atom protein force field targeting improved sampling of the backbone ϕ, ψ and side-chain χ1 and χ2 dihedral angles. J. Chem. Theory Comput 2012, 8, 3257–3273. [DOI] [PMC free article] [PubMed] [Google Scholar]
- (32).Ryckaert J-P; Ciccotti G; Berendsen HJC Numerical integration of the Cartesian equations of motion of a system with constraints: Molecular dynamics of n-alkanes. J. Comp. Phys 1977, 23, 327–341. [Google Scholar]
- (33).Darden T; York D; Pedersen LG Particle mesh Ewald: An N·log(N) method for Ewald sums in large systems. J. Chem. Phys 1993, 98, 10089–10092. [Google Scholar]
- (34).Martyna GJ; Tobias DJ; Klein ML Constant pressure molecular dynamics algorithms. J. Chem. Phys 1994, 101, 4177–4189. [Google Scholar]
- (35).Feller SE; Zhang Y; Pastor RW; Brooks BR Constant pressure molecular dynamics simulation: The Langevin piston method. J. Chem. Phys 1995, 103, 4613–4621. [Google Scholar]
- (36).Vanommeslaeghe K; Hatcher E; Acharya C; Kundu S; Zhong S; Shim J; Darian E; Guvench O; Lopes P; Vorobyov I et al. CHARMM General Force Field: a force field for drug-like molecules compatible with the CHARMM all-atom additive biological force fields. J. Comp. Chem 2010, 31, 671–690. [DOI] [PMC free article] [PubMed] [Google Scholar]
- (37).Izrailev S; Stepaniants S; Isralewitz B; Kosztin D; Lu H; Molnar F; Wriggers W; Schulten K In Computational Molecular Dynamics: Challenges, Methods, Ideas; Deuflhard P, Hermans J, Leimkuhler B, Mark AE, Reich S, Skeel RD, Eds.; Lecture Notes in Computational Science and Engineering; Springer-Verlag: Berlin, 1998; Vol. 4; pp 39–65. [Google Scholar]
- (38).Torrie GM; Valleau JP Nonphysical sampling distributions in Monte Carlo freeenergy estimation: Umbrella sampling. J. Comp. Phys 1977, 23, 187–199. [Google Scholar]
- (39).Roux B The calculation of the potential of mean force using computer simulations. Comput. Phys. Commun 1995, 91, 275–282. [Google Scholar]
- (40).Frenkel D; Smit B Understanding Molecular Simulation From Algorithms to Applications; Academic Press: California, 2002. [Google Scholar]
- (41).Faulkner M; Rodriguez-Ramos J; Dykes GF; Owen SV; Casella S; Simpson DM; Beynon RJ; Liu L-N Direct characterization of the native structure and mechanics of cyanobacterial carboxysomes. Nanoscale 2017, 9, 10662–10673. [DOI] [PMC free article] [PubMed] [Google Scholar]
- (42).Kumar S; Bouzida D; Swendsen RH; Kollman PA; Rosenberg JM The weighted histogram analysis method for free-energy calculations on biomolecules. I. The method. J. Comp. Chem 1992, 13, 1011–1021. [Google Scholar]
- (43).Grossfield A WHAM: the weighted histogram analysis method. http://membrane.urmc.rochester.edu/content/wham.
- (44).Smart OS; Neduvelil JG; Wang X; Wallace BA; Sansom MSP HOLE: A program for the analysis of the pore dimensions of ion channel structural models. J. Mol. Graphics 1996, 14, 354–360. [DOI] [PubMed] [Google Scholar]
- (45).Marrink SJ; Berendsen HJC Simulation of water transport through a lipid membrane. J. Phys. Chem. 1994, 98, 4155–68. [Google Scholar]
- (46).Zocher F; van der Spoel D; Pohl P; Hub JS Local partition coefficients govern solute permeability of cholesterol-containing membranes. Biophys. J 2013, 105, 2760–2770. [DOI] [PMC free article] [PubMed] [Google Scholar]
- (47).Kubo R The fluctuation-dissipation theorem. Rep. Progr. Phys 1966, 29, 255–284. [Google Scholar]
- (48).Tanaka S; Sawaya MR; Phillips M; Yeates TO Insights from multiple structures of the shell protein from the β-carboxysome. Prot. Sci. 2009, 18, 108–120. [DOI] [PMC free article] [PubMed] [Google Scholar]
- (49).Frauenfelder H; Sligar SG; Wolynes PG The energy landscapes and motions of proteins. Science 1991, 254, 1598–1603. [DOI] [PubMed] [Google Scholar]
- (50).Ostermann A; Waschipky R; Parak FG; Nienhaus GU Ligand binding and conformational motions in myoglobin. Nature 2000, 404, 205–208. [DOI] [PubMed] [Google Scholar]
- (51).Saam J; Ivanov I; Walther M; Holzhutter H; Kuhn H Molecular dioxygen enters the active site of 12/15 lipoxygenase via dynamic oxygen access channels. Proc. Natl. Acad. Sci. USA 2007, 104, 13319–13324. [DOI] [PMC free article] [PubMed] [Google Scholar]
- (52).Mahinthichaichan P; Gennis RB; Tajkhorshid E Bacterial denitrifying nitric oxide reductases and aerobic respiratory terminal oxidases use similar delivery pathways for their molecular substrates. Biochim. Biophys. Acta, Bioener 2018, 1859, 712–724. [DOI] [PMC free article] [PubMed] [Google Scholar]
- (53).Zhou H-X; McCammon JA The gates of ion channels and enzymes. Trends Biochem. Sci 2010, 35, 179–185. [DOI] [PMC free article] [PubMed] [Google Scholar]
- (54).Gora A; Brezovsky J; Damborsky J Gates of enzymes. Chem. Rev 2013, 113, 5871–5923. [DOI] [PMC free article] [PubMed] [Google Scholar]
- (55).Henzler-Wildman K; Kern D Dynamic personalities of proteins. Nature 2007, 450, 964–972. [DOI] [PubMed] [Google Scholar]
- (56).Focke PJ; Wang X; Larsson HP Neutrotransmitter transporters: Structure meets function. Structure 2013, 21, 694–705. [DOI] [PMC free article] [PubMed] [Google Scholar]
- (57).Moradi M; Enkavi G; Tajkhorshid E Atomic-level characterization of transport cycle thermodynamics in the glycerol-3-phosphate:phosphate transporter. Nat. Commun 2015, 6, 8393. [DOI] [PMC free article] [PubMed] [Google Scholar]
- (58).Henin J; Tajkhorshid E; Schulten K; Chipot C Diffusion of glycerol through Escherichia coli aquaglyceroporin GlpF. Biophys. J 2007, 94, 832–839. [DOI] [PMC free article] [PubMed] [Google Scholar]
- (59).Aksimentiev A; Schulten K Imaging alpha-hemolysin with molecular dynamics: Ionic conductance, osmotic permeability and the electrostatic potential map. Biophys. J 2005, 88, 3745–3761. [DOI] [PMC free article] [PubMed] [Google Scholar]
- (60).Essmann U; Perera L; Berkowitz ML; Darden T; Lee H; Pedersen LG A smooth particle mesh Ewald method. J. Chem. Phys 1995, 103, 8577–8593. [Google Scholar]
- (61).Dou Z; Heinhorst S; Williams EB; Murin CD; Shively JM; Cannon GC CO2 fixation kinetics of Halothiobacillus neapolitanus mutant carboxysomes lacking carbonic anhydrase suggest the shell acts as a diffusion barrier for CO2. J. Biol. Chem 2008, 283, 10377–10384. [DOI] [PubMed] [Google Scholar]
Associated Data
This section collects any data citations, data availability statements, or supplementary materials included in this article.


