

SUMMARY
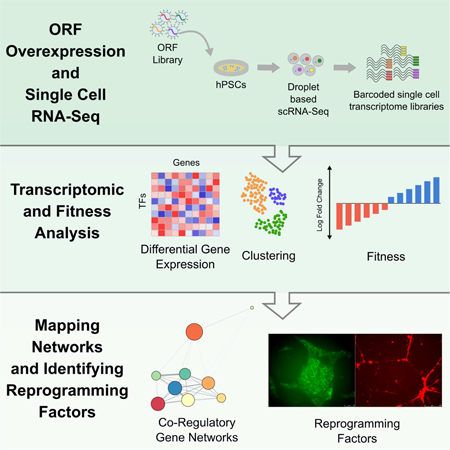
Understanding the effects of genetic perturbations on the cellular state has been challenging using traditional pooled screens, which typically rely on the delivery of a single perturbation per cell and unidimensional phenotypic readouts. Here, we use barcoded open reading frame overexpression libraries coupled with single-cell RNA sequencing to assay cell state and fitness, a technique we call SEUSS (ScalablE fUnctional Screening by Sequencing). Using SEUSS, we perturbed hPSCs with a library of developmentally critical transcription factors (TFs) and assayed the impact of TF overexpression on fitness and transcriptomic states. We further leveraged the versatility of the ORF library approach to assay mutant genes and whole gene families. From the transcriptomic responses, we built genetic co-regulatory networks to identify altered gene modules and found that KLF4 and SNAI2 drive opposing effects along the epithelial-mesenchymal transition axis. From fitness responses, we identified ETV2 as a driver of reprogramming towards an endothelial-like state.
eTOC Blurb
Discovering reprogramming factors for cell fate conversion is a challenging process. Here, we demonstrate a high-throughput, high-content overexpression screening method, employing a coupled single cell RNA-seq and fitness readout, to screen transcription factor overexpression effects on pluripotent stem cells under multiple growth conditions. From the screens, we can dissect transcriptomic responses, construct genetic co-regulatory networks and identify reprogramming factors. We also demonstrate application of the method to systematically screen mutant forms of proteins and whole gene families.
Graphical Abstract
INTRODUCTION
Cellular reprogramming via the overexpression of transcription factors (TF), has widely impacted biological research, from the direct conversion of adult somatic cells (Davis et al., 1987; Xu et al., 2015) and the induction of pluripotent stem cells (Takahashi and Yamanaka, 2006; Maherali et al., 2007; Takahashi et al., 2007; Wernig et al., 2007; Yu et al., 2007; Park et al., 2008), to the differentiation of human pluripotent stem cells (hPSCs) (Pang et al., 2011; Y. Zhang, Changhui Pak, et al., 2013; Abujarour et al., 2014; Chanda et al., 2014; Sugimura et al., 2017; Yang et al., 2017). The discovery of TFs that drive reprogramming has previously involved both prior knowledge of their role in development and cellular transformation, and systematic trial-and-error. A scalable screening method to assess the effects of TF overexpression would advance fundamental understanding of reprogramming and enable the rapid discovery of novel reprogramming factors.
Recently, screens combining genetic perturbations with single cell RNA-seq (scRNA-seq) (Kolodziejczyk et al., 2015) readouts have emerged as promising alternatives to traditional screens (Mohr et al., 2010; Shalem et al., 2015), enabling high-throughput, high-content screening by simultaneously profiling the transcriptomic response of tens of thousands of individual cells to genetic perturbations. These scRNA-seq screens are scalable and enable direct readout of transcriptomic changes, providing a powerful tool in unraveling transcriptional networks and cascades. While other groups have demonstrated CRISPR-Cas9 based knock out and knock-down scRNA-seq screens (Adamson et al., 2016; Dixit et al., 2016; Jaitin et al., 2016; Datlinger et al., 2017; Xie et al., 2017), to our knowledge, scRNA-seq based gene overexpression screens have yet to be demonstrated.
Here, we use barcoded open-reading frame (ORF) overexpression libraries with a coupled scRNA-seq and fitness screen, a technique we call SEUSS, to systematically overexpress a pooled library of TFs and assay both the transcriptomic and fitness effects on hPSCs. While CRISPRa offers some advantages, including easier scale-up, and the ability to mimic endogenous activation (La Russa and Qi, 2015; Dominguez et al., 2016), we chose ORF constructs for several reasons. ORF overexpression yields strong, stable expression of the gene of interest, and enables the expression of specific isoforms as well as engineered or mutant forms of genes, aspects not accessible through endogenous activation.
We harnessed the SEUSS approach to assay the effects of TF overexpression on the pluripotent cell state, like the opposing effects of KLF4 and SNAI2 overexpression along the epithelial-mesenchymal transition (EMT) axis, and to find reprogramming factors like ETV2, whose overexpression yields rapid differentiation towards the endothelial lineage. Notably, we also systematically assayed mutant gene libraries (MYC) and whole gene families (KLF).
RESULTS
TF overexpression screens in hPSCs with barcoded ORF libraries
We designed an ORF overexpression vector (TF-Hygro, Figure 1A) such that each TF was paired with a unique 20 bp barcode sequence located 200 bp upstream of the lentiviral 3’-long terminal repeat (LTR) region. This yields a polyadenylated transcript bearing the barcode proximal to the 3’ end, facilitating efficient detection in scRNA-seq (Figure 1A). To construct the ORF library, TFs were amplified out of a multi-tissue human cDNA pool or synthesized as double-stranded DNA fragments, and individually cloned into a backbone vector (Figure S1a, STAR Methods). The final library consisted of 61 developmentally critical or pioneer TFs (Table S1). Overexpression was confirmed for select TFs by qRT-PCR (Figure S1b).
Figure 1:
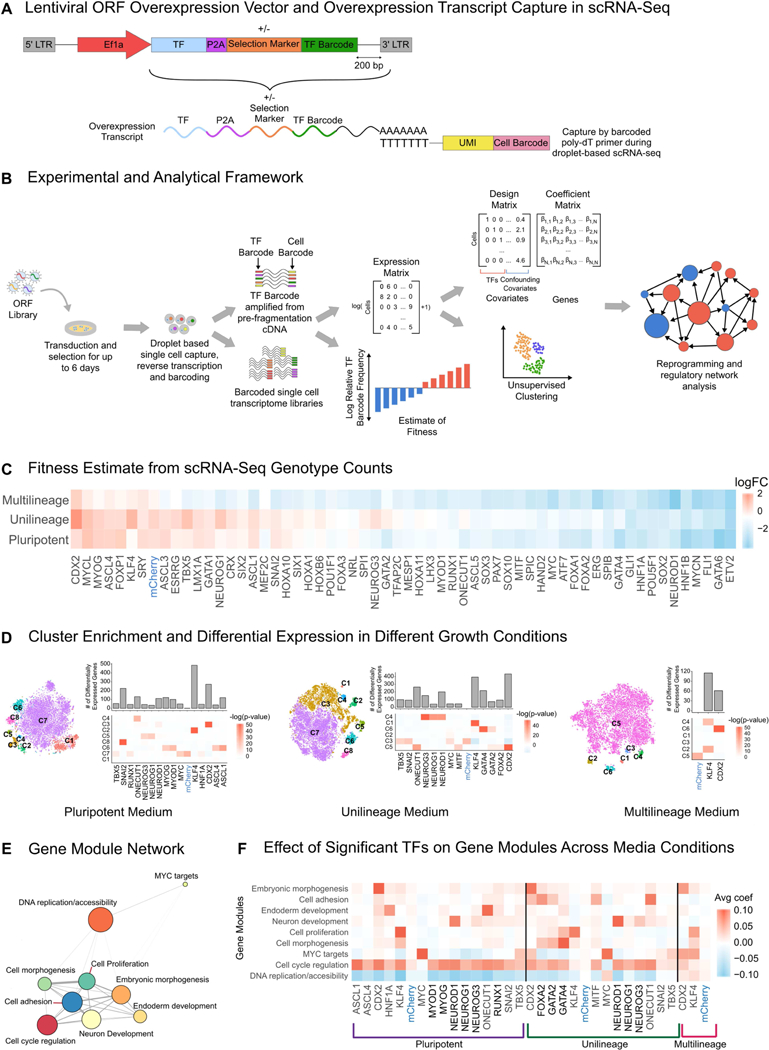
Schematic of SEUSS workflow, estimates of fitness and transcriptomic effects of TF overexpression, and building co-regulatory gene module networks. (A) Schematic of lentiviral overexpression vector and capture of overexpression transcript during scRNA-seq. While the vector used in the screens contained a hygromycin resistance selection marker, it may also be designed without a selection marker. (B) Schematic of experimental and analytical framework for evaluation of effects of transcription factor (TF) overexpression in hPSCs: Individual TFs are cloned into the barcoded ORF overexpression vector, pooled and packaged into lentiviral libraries for transduction of hPSCs. Transduced cells are harvested at a fixed time point to be assayed as single cells using droplet based scRNA-seq to evaluate transcriptomic changes. Cells are genotyped by amplifying the overexpression transcript from scRNA-seq cDNA prior to fragmentation and library construction and identifying the overexpressed TF barcode for each cell. The cell count for each genotype is used to estimate fitness. Gene expression matrices from scRNA-seq are used to obtain differential gene expression and clustering signatures, which in turn are used for evaluation of cell state reprogramming and gene regulatory network analysis. (C) Fitness effect of TFs: log fold change of individual TFs, calculated as cell counts normalized against plasmid library read counts. (D) t-SNE projection (left panels), and differential gene expression and cluster enrichment of significant TFs (right panels) from screens in different growth medium conditions: pluripotent stem cell medium, unilineage medium and multilineage medium. The TFs were chosen as significant with the following criteria: cluster enrichment with a p-value of less than 10−12, or if the TF drove differential expression of more than 50 genes. (E) Gene module network: Node size indicates the number of genes in the module; Edge size indicates distance between modules. (F) Effect of TF overexpression on gene modules in different medium conditions, effect size was calculated as the average of the linear model coefficients for a given TF perturbation across all genes within a module.
We conducted the overexpression screens by transducing lentiviral ORF libraries into human embryonic stem cells (hESCs), maintaining them under antibiotic selection after transduction for 5 days for screens in hPSC medium, and 6 days for screens in unilineage and multilineage medium. We then performed scRNA-seq on the transduced and selected cells. TF barcodes were recovered and associated with scRNA-seq cell barcodes by targeted PCR amplification from the unfragmented cDNA, allowing genotyping of each cell for downstream analysis (Figure 1B). Genotyped cell counts, while limited in sample size, also allowed us to estimate fitness (Figure 1A-C).
We then used the Seurat computational pipeline to cluster cells based on their gene expression profiles, and identified over-enrichment of TFs in specific clusters using Fisher’s exact test (STAR Methods, Figure 1D) (Macosko et al., 2015). We used a linear model to identify genes whose expression levels are appreciably changed by the perturbation (Dixit et al.,2016) (STAR Methods). For downstream analysis, we focused on TFs that were either significantly enriched for at least one cluster (p-value < 10−12) or had at least 50 significant differentially expressed genes (STAR Methods, Figure 1D).
Since barcode shuffling has been identified as a key factor limiting the power and sensitivity of single-cell based screening (Adamson et al., 2016, 2018; Sack et al., 2016; Hill et al., 2018; Xie et al., 2018), we also explored an alternate version of the overexpression vector (TF-NoHygro, Figure S1c) to minimize template-switching events during lentiviral packaging. The rate at which the association between the ORF and barcode is lost due to template switching is proportional to the length of the constant region between the ORF and barcode, which in this case is the selection marker. In the TF-NoHygro vector, the selection marker was excised and the ORF was placed immediately adjacent to the barcode sequence, with only a 25 bp priming sequence between them (Figure S1c). The absence of a selection marker does not impact analysis of results from the screens since we could exactly determine which perturbation was delivered to each cell.
We then assessed barcode shuffling rates for pooled virus production for the TF-Hygro and TF-NoHygro designs, compared to a control where each library element in the TF-Hygro format was packaged individually and then pooled (Figure S1d, STAR Methods). We used a 14-element subset of the full library (Figure S1e, Table S1) to quantify these shuffling rates. While the TF-Hygro design yielded a ∼36% barcode shuffling rate, the TF-NoHygro design had a negligible shuffling rate (Figure S1f).
Given the degree of barcode shuffling in the TF-Hygro format, we also assessed the reproducibility of the assay results obtained using the TF-Hygro format versus the TF-NoHygro format for the 14 TF sub-library (Figure S1e, Table S1). Virus for both vector formats was produced in a pooled manner, so that the TF-Hygro format would suffer from barcode shuffling, while the TF-NoHygro format would not. We conducted scRNA-seq screens in both vector formats and found that regression coefficients for cells overexpressing a single TF were well correlated between the vector formats (Figure S1g). Hence, results obtained from pooled screens with TF-Hygro are still valid, albeit with a reduction in power.
Screening growth condition-specific effects of TF overexpression
We used the SEUSS framework to assess the pluripotent cell state response to TF overexpression, and to study the interplay of TF overexpression and growth conditions. We conducted two replicate screens with the 61 element TF-Hygro library in each of three different medium conditions: hPSC medium, a unilineage medium, specifically endothelial growth medium (EGM), and a multilineage (ML) differentiation medium, specifically a high serum growth medium (STAR Methods). We aggregated 7,728 cells across the hPSC medium screens, 10,137 cells across the unilineage medium screens, and 6,807 cells across the ML medium screens (Table S2). The experimental replicates for each medium condition were well correlated (STAR Methods, Figure S2a-c), implying overall reproducibility.
We found that transcriptomic changes do not necessarily correlate with changes in fitness (Figure S2d-f), demonstrating that profiling both fitness and the transcriptome is necessary for understanding cell state changes. We also found that fitness estimates from cell counts were well correlated between replicates (Figure S3g-i) and correlated with bulk fitness from genomic DNA despite the limited sampling of cell counts via scRNA-seq (Figure S3j-l). Among the most significantly depleted TFs across medium conditions, was the haematoendothelial master regulator ETV2, (Figure 1C, Fig. S3).
Mapping TF overexpression effects to gene module networks
To interpret the effects of significant TFs, we used the regression coefficients of the linear model to build a weighted gene-to-gene co-regulatory network, where genes with a highly weighted edge between them respond to TF overexpression in a similar manner (STAR Methods, Figure S3). Applying this approach to the screens, we identified 9 altered gene modules via a graph clustering algorithm(Blondel et al., 2008). Many of these gene modules showed a strong enrichment for Gene Ontology (GO) terms, and gene module identity was assigned using GO enrichment paired with manual inspection of genes in each module (Figure 1E, Table S4).
We next calculated the effect of each significant TF on the gene modules (Figure 1F). While certain TFs (CDX2, KLF4) show strong cluster enrichment (Figure 1D, Fig S4a-c) and consistent gene module effects across media conditions, some TFs have growth medium-specific effects. For instance, some HNF1A effects were specific to hPSC medium and some GATA4 effects were specific to EGM (Figure 1F). We found that the annotated neural specifier NEUROD1 (Gao et al., 2009; Y. Zhang, ChangHui Pak, et al., 2013; Busskamp et al., 2014; Pataskar et al., 2016) shows strong effects on the neuron differentiation module and upregulates genes known to play a role in neuronal development (Figure S4d-e). In the pluripotent medium condition, we also find that HNF1A and ONECUT1, strongly upregulate the endoderm development module, reflecting their known roles in endoderm development (Jacquemin et al., 2000, 2003; Clotman et al., 2005; Pierreux et al., 2006; Maestro et al., 2007; Servitja et al., 2009; D’Angelo et al., 2010; Si-Tayeb, K.; Lemaigre, F. P.; Duncan, 2010) (Figure 1F). Across medium conditions, CDX2 upregulates the embryonic morphogenesis module and genes known to play a role in extra-embryonic patterning (Figure S4d-f), potentially reflecting its role in trophectoderm development (Niwa et al., 2005; Strumpf et al., 2005). To benchmark our results, we compared the effects for significant TFs in hPSC medium with a previously reported bulk microarray screen of TF overexpression in mESCs (Nishiyama et al., 2009). We used GSEA to assess the overlap between the overexpression effects in our screens and the annotated TF targets in the bulk microarray screen. We found significant enrichment between the TFs present in both screens (Figure S4g).
Biological Effects of Significant TFs
We then sought to investigate the effects of two TFs, SNAI2 and KLF4, which significantly perturb the hPSC transcriptome (Figure 1D, Figure 1F). Since KLF4 and SNAI2 are known to play critical and opposing roles in EMT (Barrallo-Gimeno et al., 2005; Li et al., 2010; Liu et al., 2012) we assessed whether they cause changes along an EMT-like axis in hPSCs as well. A PCA analysis using 200 genes from a consensus EMT geneset from MSigDB (Subramanian et al., 2005) demonstrated a stratification of KLF4-transduced cells towards an epithelial-like state and SNAI2-transduced cells towards a mesenchymal-like state (Figure 2A). The scRNA-seq data also demonstrated expression level changes in signature genes consistent with EMT (Figure 2B), which we confirmed with qRT-PCR (Figure S5a-c). We also confirmed protein expression changes with immunofluorescence staining of EPCAM and VIM (Figure 2C).
Figure 2:
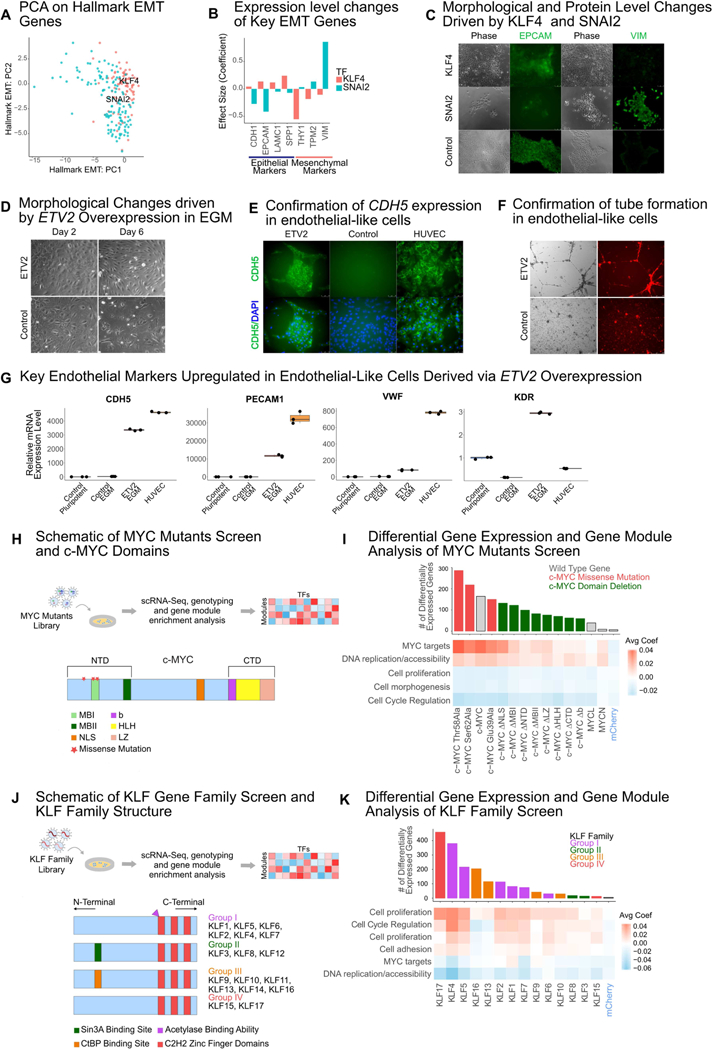
Biological effects of TF overexpression: KLF4 and SNAI2 as opposing drivers in EMT, ETV2 as a driver of reprogramming to an endothelial-like state; and application of SEUSS to screen mutant proteins and gene families (A) PC plot of performing PCA on 200 genes from the Hallmark Epithelial Mesenchymal Transition geneset from MSigDB(Subramanian et al., 2005). (B) Effect of KLF4 and SNAI2 on selected epithelial and mesenchymal markers. (C) Transmission and immunofluorescence micrographs of EPCAM- and VIM-labelled day 5 KLF4-, SNAI2- or mCherry-transduced cells. (D) Morphology change for cells transduced with either ETV2 or mCherry in EGM. (E) Immunofluorescence micrograph of CDH5 labelled day 6 ETV2-or mCherry-transduced cells and HUVECs. (F) Tube formation assay for day 6 ETV2- or mCherry-transduced cells. (G) qRT-PCR analysis of signature endothelial genes CDH5, PECAM1, VWF and KDR, at day 6 post-transduction. Data were normalized to GAPDH and expressed relative to control cells in pluripotent stem cell medium. (H) Schematic of workflow for c-MYC mutant library screen and schematic of functional domains of c-MYC: MYC Box I (MBI) and MYC Box II (II) which are essential for transactivation of target genes are housed in the amino-terminal domain (NTD); the basic (b) helix-loop-helix (HLH) leucine zipper (LZ) motif, which is required for heterodimerization with the MAX protein is housed in the carboxy-terminal domain (CTD); the nuclear localization signal domain (NLS) is located in the central region of the protein. (I) Effect of MYC mutant overexpression on number of differentially expressed genes and on gene modules. (J) Schematic of workflow for KLF gene family screen and schematic of KLF gene family protein structure grouped by common structural and functional features (K) Effect of KLF family overexpression on number of differentially expressed genes and on gene modules. For heatmaps in (I), (K) effect size was calculated as the average of the linear model coefficients for a given TF perturbation across all genes within a module.
To demonstrate the power of fitness effects in discovering TFs with significant impact on reprogramming, we focused on ETV2, which has the greatest average fitness loss across medium conditions (Figure 1C). Since ETV2 is known to drive reprogramming from fibroblasts (Morita et al., 2015) and promote differentiation of endothelial cells from hPSCs (Lindgren et al., 2015; Tsang et al., 2017), we hypothesized that the reduced fitness could be due to a proliferation disadvantage if ETV2-transduced cells are undergoing reprogramming without division. Focused experiments revealed that while ETV2-transduced cells undergo extensive cell death in pluripotent medium, there is a morphology change indicative of an endothelial phenotype in EGM (Figure 2D). Immunofluorescence revealed a distinct distribution of CDH5, with localization at cell-cell junctions similar to human umbilical vein endothelial cells (HUVECs) (Figure 2E). Functional testing confirmed tube formation (Figure 2F), while qRT-PCR assays demonstrated strong upregulation of the key endothelial markers CDH5, PECAM1 and VWF (Figure 2G), thus suggesting that a single TF, ETV2, may be able to drive differentiation from a pluripotent to an endothelial-like state.
Screening Mutant Gene Libraries and Gene Families
Since MYC was found to drive significant transcriptomic changes in hPSC medium (Figure 1D), we chose to assay MYC mutants to demonstrate the ability of SEUSS to systematically screen mutant forms of proteins. We constructed a library of mutant MYC proteins, with both functional domain deletions and (Figure 2H), and hotspot mutations (Pelengaris et al., 2002). Screening this Myc-Hygro library in hPSC medium, we found that hotspot mutations, and deletion of the nuclear localization signal (NLS) sequence maintain an effect similar to the wild type MYC, suggesting that these mutations have minimal effect. A majority of the domain deletions show a marked reduction in both the number of differentially expressed genes, and the activation of MYC target module genes, suggesting that deleting entire functional domains is deleterious for function of MYC in hPSCs, as one might expect (Figure 2I).
The consistent and strong effects of KLF4 overexpression motivated the investigation of the KLF zinc finger transcription factor family (McConnell and Yang, 2010) (Figure 2J) as a demonstration of SEUSS’ utility in studying perturbation patterns across gene families. A KLF-Hygro screen including all 17 members of this protein family was conducted in hPSC medium. Gene module analysis showed that Group I KLF family members, including KLF4 and KLF5, have similar effects, as does KLF17 (Figure 2K), which may reflect their similar role in promoting epithelial cell states (Gumireddy et al., 2009; B. Zhang et al., 2013; Tiwari et al., 2013). We benchmarked the results obtained in the KLF gene family screen via SEUSS, against bulk RNA-seq for KLF4, KLF5 and KLF17, the 3 KLF family members with the highest number of differentially expressed genes and found the results to be correlated (Figure S5d).
DISCUSSION
In our study, we have demonstrated a high-throughput gene over-expression screening approach that simultaneously assays both fitness and transcriptomic effects. Our use of ORF overexpression drove strong phenotypic effects, allowing us to capture subtle transcriptomic signals with fewer cells per perturbation than some of the CRISPR-based screens, while the versatility of SEUSS was demonstrated by mapping context dependent effects of TFs, assaying mutant forms of a TF, as well as TFs in a gene family.
Our studies also revealed important considerations in the execution and interpretation of such screens. Consistent with recent studies (Sack et al., 2016; Hill et al., 2018), we observed shuffling of distally located barcodes due to recombination during pooled lentiviral packaging. While viral particles may be produced without risk of recombination by individually packaging each vector, this hinders screen scalability. We also noted that there are limitations on the maximum infectivity for stem cells with lentiviral vectors (Santoni de Sio et al., 2008; Geis et al.,2017), reducing the probability of observing combinatorial overexpression effects. Further engineering of the overexpression vector is necessary to enable large-scale and combinatorial overexpression screens. We also observed that overexpression levels will vary with the gene being expressed, which could affect screens sensitive to such variations. Further, in our assays, since hPSCs were transduced with pooled libraries, transcriptomic changes driven by cell-cell interactions could increase variability. We also aggregated replicates to increase our power after demonstrating that the replicate experiments showed similar effects. This may not always be possible, as screens in specific cell types or culture conditions may result in more variability amongst replicates. Furthermore, in these experiments, we chose a compact library size to ensure that within a single scRNA-seq run of up to 10,000 cells, each perturbation was represented by a statistically significant number of cells. However, given the development of combinatorial indexing methods (Cao et al., 2017; Rosenberg et al., 2018) that can profile hundreds of thousands of cells simultaneously, we anticipate SEUSS to be scalable to all known TFs.
Taken together, SEUSS has broad applicability to study the effects of overexpression in diverse cell types and contexts; it may be extended to novel applications such as screening of protein mutagenesis or screening the effects of synthetic proteins. In combination with other methods of genetic and epigenetic perturbation it may allow us to generate a comprehensive understanding of the pluripotent and differentiation landscape.
CONTACT FOR REAGENT AND RESOURCE SHARING
Further information and requests for resources and reagents should be directed to and will be fulfilled by the Lead Contact, Prashant Mali (pmali@ucsd.edu).
EXPERIMENTAL MODEL AND SUBJECT DETAILS
Cell Culture
H1 hESC (male) cell line was maintained under feeder-free conditions in mTeSRI medium (Stem Cell Technologies). Prior to passaging, tissue-culture plates were coated with growth factor-reduced Matrigel (Corning) diluted in DMEM/F-12 medium (Thermo Fisher Scientific) and incubated for 30 minutes at 37 °C, 5% CO2. Cells were dissociated and passaged using the dissociation reagent Versene (Thermo Fisher Scientific).
HEK 293T cells were maintained in high glucose DMEM supplemented with 10% fetal bovine serum (FBS).
HUVECs were maintained in endothelial growth medium (EGM-2, Lonza) and were not used beyond passage 10.
METHOD DETAILS
Library Preparation
The lentiviral backbone plasmid for the TF-Hygro vector format was constructed containing the EF1a promoter, mCherry transgene flanked by BamHI restriction sites, followed by a P2A peptide and hygromycin resistance enzyme gene immediately downstream. Each transcription factor in the library was individually inserted in place of the mCherry transgene. Since the ectopically expressed transcription factor would lack a poly-adenylation tail due to the presence of the 2A peptide immediately downstream of it, the transcript will not be captured during single cell transcriptome sequencing which relies on binding the poly-adenylation tail of mRNA. Thus, a barcode sequence was introduced to allow for identification of the ectopically expressed transcription factor. The backbone was digested with Hpal, and a pool of 20 bp long barcodes with flanking sequences compatible with the Hpal site, was inserted immediately downstream of the hygromycin resistance gene by Gibson assembly. The vector was constructed such that the barcodes were located only 200 bp upstream of the 3’-LTR region. This design enabled the barcodes to be transcribed near the poly-adenylation tail of the transcripts and a high fraction of barcodes to be captured during sample processing for scRNA-seq.
To create the transcription factor library, individual transcription factors were PCR amplified out of a human cDNA pool (Promega Corporation) or obtained as synthesized double-stranded DNA fragments (gBIocks, IDT Inc) with flanking sequences compatible with the BamHI restriction sites. MYC mutants were obtained as gBIocks with a 6-amino acid GSGSGS linker substituted in place of deleted domains (Table S1). The lentiviral backbone was digested with BamHI HF (New England Biolabs) at 37 °C for 3 hours in a reaction consisting of: lentiviral backbone, 4 μg, CutSmart buffer, 5 μl, BamHI, 0.625 μl, H20 up to 50 μl. After digestion, the vector was purified using a QIAquick PCR Purification Kit (Qiagen). Each transcription factor vector was then individually assembled via Gibson assembly. The Gibson assembly reactions were set up as follows: 100 ng digested lentiviral backbone, 3:10 molar ratio of transcription factor insert, 2X Gibson assembly master mix (New England Biolabs), H20 up to 20 μl. After incubation at 50 ˚C for 1 h, the product was transformed into One Shot Stbl3 chemically competent Escherichia coli (Invitrogen). A fraction (150 μL) of cultures was spread on carbenicillin (50 μg/ml) LB plates and incubated overnight at 37 °C. Individual colonies were picked, introduced into 5 ml of carbenicillin (50 μg/ml) LB medium and incubated overnight in a shaker at 37 °C. The plasmid DNA was then extracted with a QIAprep Spin Miniprep Kit (Qiagen), and Sanger sequenced to verify correct assembly of the vector and to extract barcode sequences. One overexpression vector was created for each TF, thus a single unique barcode was associated with each TF.
To assemble the library, individual transcription factor vectors were pooled together in an equal mass ratio along with a control vector containing the mCherry transgene which constituted 10% of the final pool.
To create the neural transcription factor library without a hygromycin resistance transgene, in the TF-NoHygro format, individual transcription factor coding sequences were PCR amplified from plasmids containing them, with flanking sequences compatible with the upstream BamHI restriction site and downstream Hpal restriction site. 20 bp barcode sequences were added after the transcription factor stop codon via the primers compatible with the Hpal restriction site. Swapping the locations of the ORF and selection marker was avoided so that residues from 2A peptide cleavage were not added to the N-terminal of the overexpressed TF. The lentiviral backbone was digested with BamHI HF and Hpal (New England Biolabs) at 37 °C for 3 hours in a reaction consisting of: lentiviral backbone, 3 μg, CutSmart buffer, 5 μl, BamHI, 0.625 μl, Hpal, 2 μl, H20 up to 50 μl. After digestion, the vector was purified using a QIAquick PCR Purification Kit (Qiagen). Each transcription factor vector was then individually assembled via Gibson assembly. The Gibson assembly reactions were set up as follows: 100 ng digested lentiviral backbone, 3:10 molar ratio of transcription factor insert, 2X Gibson assembly master mix (New England Biolabs), H20 up to 20 μl. After incubation at 50 ˚C for 1 h, the product w as transformed into One Shot Stbl3 chemically competent Escherichia coli (Invitrogen). A fraction (150 μL) of cultures was spread on carbenicillin (50 μg/ml) LB plates and incubated overnight at 37 °C. Individual colonies were picked, introduced into 5 ml of carbenicillin (50 μg/ml) LB medium and incubated overnight in a shaker at 37 °C. The plasmid DNA was then extracted with a QIAprep Spin Miniprep Kit (Qiagen), and Sanger sequenced to verify correct assembly of the vector and to extract barcode sequences. One overexpression vector was created for each TF, thus a single unique barcode was associated with each TF.
To assemble the library, individual transcription factor vectors were pooled together in an equal mass ratio along with a control vector containing the mCherry transgene which constituted 10% of the final pool.
Viral Production
HEK 293T cells were maintained in high glucose DMEM supplemented with 10% fetal bovine serum (FBS). In order to produce lentivirus particles, cells were seeded in a 15 cm dish 1 day prior to transfection, such that they were 60–70% confluent at the time of transfection. For each 15 cm dish 36 μl of Lipofectamine 2000 (Life Technologies) was added to 1.5 ml of Opti-MEM (Life Technologies). Separately 3 μg of pMD2.G (Addgene no. 12259), 12 μg of pCMV delta R8.2 (Addgene no. 12263) and 9 μg of an individual vector or pooled vector library was added to 1.5 ml of Opti-MEM. After 5 minutes of incubation at room temperature, the Lipofectamine 2000 and DNA solutions were mixed and incubated at room temperature for 30 minutes. During the incubation period, medium in each 15 cm dish was replaced with 25 ml of fresh, pre-warmed medium. After the incubation period, the mixture was added dropwise to each dish of HEK 293T cells. Supernatant containing the viral particles was harvested after 48 and 72 hours, filtered with 0.45 pm filters (Steriflip, Millipore), and further concentrated using Amicon Ultra-15 centrifugal ultrafilters with a 100,000 NMWL cutoff (Millipore) to a final volume of 600–800 μl, divided into aliquots and frozen at −80 °C.
For high MOI transduction of the neural transcription factor library, the lentivirus was further concentrated using Amicon Ultra-0.5 centrifugal ultrafilters with a 100,000 NMWL cutoff (Millipore) such that the final volume used for transduction was less than 20% of the total volume per well of a 6 well plate.
For analysis of barcode shuffling, lentivirus particles were produced by seeding HEK293T cells in 6-well plates such that they were 60–70% confluent at the time of transfection. For each well, μl of Lipofectamine 2000 was added to 125 ul of Opti-MEM. Separately, 625 ng of pMD2.G, 2.5 μl of pCMV delta R8.2 and 1.875 μg of an individual or pooled neural transcription factor library was added to 125 μl of Opti-MEM. After 5 minutes of incubation at room temperature, the Lipofectamine 2000 and DNA solutions were mixed and incubated at room temperature for 30 minutes. During the incubation period, medium in each well was replaced with 2 ml of fresh, prewarmed medium. After the incubation period, the mixture was added dropwise to each well of HEK 293T cells. For the Arrayed Neural TF library, viral particles of each individual transcription factor were produced in separate wells of 6-well plates. For the Pooled Neural TF library, the plasmids were pooled along with a mCherry vector constituting 10% of the final pool and lentiviral particles produced in an equal number of wells as the Unpooled production. Supernatant containing the viral particles was harvested after 48 and 72 hours, pooled and filtered with 0.45 μm filters (Steriflip, Millipore), and further concentrated using Amicon Ultra-15 centrifugal ultrafilters with a 100,000 NMWL cutoff (Millipore) to a final volume of 600–800 μl, divided into aliquots and frozen at −80 °C. The lentivirus was further concentrated using Amicon Ultra-0.5 centrifugal ultrafilters with a 100,000 NMWL cutoff (Millipore) such that the final volume used for transduction was less than 20% of the total volume per well of a 6 well plate.
Viral Transduction
For viral transduction, on day −1, H1 cells were dissociated to a single cell suspension using Accutase (Innovative Cell Technologies) and seeded into Matrigel-coated plates in mTeSR containing ROCK inhibitor, Y-27632 (10 μM, Sigma-Aldrich). For transduction with the TF library, cells were seeded into 10 cm dishes at a density of 6×10⁶ cells for screens conducted in mTeSR or 4.5×10⁶ cells for screens conducted in endothelial growth medium (EGM) or multilineage (ML) medium (DMEM + 20% FBS.) For transduction with the neural TF library, KLF gene family library and c-MYC mutants library, cells were seeded at a density of 1×10⁶ cells per well of a 6-well plate. For transduction with the neural TF library not containing a hygromycin resistance transgene, cells were seeded at a density of 0.5×10⁶ cells per well of a 6-well plate. For transduction with the neural TF library, with or without the hygromycin resistance transgene, multiple wells were transduced at varying titers, along with companion wells transduced with equal titer of control mCherry virus only, to control for effects of viral toxicity and high serum content. The highest transduction titer for which no toxicity or differentiation was seen in the control wells was used for scRNA-seq experiments. For transduction with individual transcription factors cells were seeded at a density of 4×10⁵ cells per well of a 12 well plate or 2×10⁵ cells per well of a 24 well plate for experiments conducted in mTeSR, while for experiments conducted in the alternate media cells were seeded at a density of 3×10⁵ cells per well of a 12 well plate or 1.5×10⁵ cells per well of a 24 well plate.
On day 0, medium was replaced with fresh mTeSR to allow cells to recover for 6–8 hours. Recovered cells were then transduced with lentivirus added to fresh mTeSR containing polybrene (5 μg/ml, Millipore). On day 1, medium was replaced with the appropriate fresh medium: mTeSR, endothelial growth medium (EGM-2, Lonza) or high glucose DMEM + 20% FBS. For all vectors and libraries containing a hygromycin resistance transgene, hygromycin (Thermo Fisher Scientific) selection was started from day 2 onward at a selection dose of 50 μg/ml, medium containing hygromycin was replaced daily.
Single Cell Library Preparation
For screens conducted in mTeSR cells were harvested 5 days after transduction while for alternate media, EGM or ML, cells were harvested 6 days after transduction with the TF library. Cells were dissociated to single cell suspensions using Accutase (Innovative Cell Technologies). For samples sorted with magnetically assisted cell sorting (MACS), cells were labelled with anti-TRA-1–60 antibodies or with dead cell removal microbeads and sorted as per manufacturer’s instructions (Miltenyi Biotec). Samples were then resuspended in 1XPBS with 0.04% BSA at a concentration between 600–2000 per μl. Samples were loaded on the 10X Chromium system and processed as per manufacturer’s instructions (10X Genomics). Unused cells were centrifuged at 300 ref for 5 minutes and stored as pellets at −80 °C until extraction of genomic DNA.
Single cell libraries were prepared as per the manufacturer’s instructions using the Single Cell 3’ Reagent Kit v2 (10X Genomics). Prior to fragmentation, a fraction of the sample post-cDNA amplification was used to amplify the transcripts containing both the TF barcode and cell barcode. Single cell RNA-seq libraries and barcode amplicons were sequenced on an Illumina HiSeq platform.
Quantification of Barcode Shuffling
To quantify the extent of barcode shuffling, lentivirus particles of the Neural TF library were produced in an arrayed or pooled manner in 6-well plates as described previously. Multiple wells were transduced at varying titers, the highest transduction titer for which no toxicity or differentiation was seen in the control wells was used for downstream processing. Hygromycin (Thermo Fisher Scientific) selection was started from day 2 onward at a selection dose of 50 μg/ml, medium containing hygromycin was replaced daily. Cells were harvested 5 days after transduction, spun at 300 rcf for 5 min to obtain cell pellets and genomic DNA extracted.
Barcode Amplification
Barcodes were amplified from cDNA generated by the single cell system as well as from genomic DNA from cells not used for single cell sequencing. Barcodes were amplified from both types of samples and prepared for deep sequencing through a two-step PCR process.
For amplification of barcodes from cDNA, the first step was performed as three separate 50 μl reactions for each sample. 2 μl of the cDNA was input per reaction with Kapa Hifi Hotstart ReadyMix (Kapa Biosystems). The PCR primers used were, Nexterai7_TF_Barcode_F: GTCTCGTGGGCTCGGAGATGTGTATAAGAGACAGAGAACTATTTCCTGGCTGTTACGCG and NEBNext Universal PCR Primer for Illumina (New England Biolabs). The thermocycling parameters were 95 ˚C for 3 min; 24–26 cycles of (9 8 ˚C for 20 s; 65 ˚C for 15 s; and 72 ˚C for 30 s); and a final extension of 72 ˚C for 5 min. Th e numbers of cycles were tested to ensure that they fell within the linear phase of amplification. Amplicons (∼500 bp) of 3 reactions for each sample were pooled, size-selected and purified with Agencourt AMPure XP beads at a 0.8 ratio. The second step of PCR was performed with two separate 50 μl reactions with 50 ng of first step purified PCR product per reaction. Nextera XT Index primers were used to attach Illumina adapters and indices to the samples. The thermocycling parameters were: 95 ˚C for 3 min; 6–8 cycles of (98 ˚C for 20 s; 65 ˚C for 15 s; 72 ˚C fo r 30 s); and 72 ˚C for 5 min. The amplicons from these two reactions for each sample were pooled, size-selected and purified with Agencourt AMPure XP beads at an 0.8 ratio. The purified second-step PCR library was quantified by Qubit dsDNA HS assay (Thermo Fisher Scientific) and used for downstream sequencing on an Illumina HiSeq platform.
For amplification of barcodes from genomic DNA, genomic DNA was extracted from stored cell pellets with a DNeasy Blood and Tissue Kit (Qiagen). The first step PCR was performed as three separate 50 μl reactions for each sample. 2 μg of genomic DNA was input per reaction with Kapa Hifi Hotstart ReadyMix. The PCR primers used were, NGS_TF-Barcode_F: ACACT CTTT CCCTACACGACGCT CTT CCGAT CT AGAACTATTT CCT GGCTGTTACGCG and NGS_TF-Barcode_R:GACTGGAGTTCAGACGTGTGCTCTTCCGATCTTGTCTTCGTTGGGAGTGAATTAGC. The thermocycling parameters were: 95 °C for 3 min; 26– 28 cycles of (98 °C for 20 s; 55 °C for 15 s; and 72 °C for 30 s); and a final extension of 72 °C for 5 min. The numbers of cycles were tested to ensure that they fell within the linear phase of amplification. Amplicons (200 bp) of 3 reactions for each sample were pooled, size-selected with Agencourt AMPure XP beads (Beckman Coulter, Inc.) at a ratio of 0.8, and the supernatant from this was further size-selected and purified at a ratio of 1.6. The second step of PCR was performed as two separate 50 μl reactions with 50 ng of first step purified PCR product per reaction. Next Multiplex Oligos for Illumina (New England Biolabs) Index primers were used to attach Illumina adapters and indices to the samples. The thermocycling parameters were: 95 °C for 3 min; 6 cycles of (98 °C for 20 s; 65 °C for 20 s; 72 °C for 30 s); and 72 °C for 2 mi n. The amplicons from these two reactions for each sample were pooled, size-selected with Agencourt AMPure XP beads at a ratio of 0.8, and the supernatant from this was further size-selected and purified at a ratio of 1.6. The purified second-step PCR library was quantified by Qubit dsDNA HS assay (Thermo Fisher Scientific) and used for downstream sequencing on an Illumina MiSeq platform.
For amplification of barcodes from genomic DNA for barcode shuffling analysis, genomic DNA was extracted from stored cell pellets with a DNeasy Blood and Tissue Kit (Qiagen). The barcode for the mCherry control only was amplified for next generation sequencing in three steps. The first step PCR was performed as three separate 50 μl reactions for each sample. 2 μg of genomic DNA was input per reaction with Kapa Hifi Hotstart ReadyMix. The PCR primers used were, mCh_BC_Shuffling_F: CACCATCGTGGAACAGTACGAAC and TF_BC_Shuffling_R:GACTGGAGTTCAGACGTGTGCTCTTCCGATCTCACTGTTTAACAAGCCCGTCAGTAG. The thermocycling parameters were: 95 °C for 3 min; 24– 26 cycles of (98 °C for 20 s; 65 °C for 15 s; and 72 °C for 90 s); and a final extension of 72 °C for 5 min. The numbers of cycles were tested to ensure that they fell within the linear phase of amplification. Amplicons of 3 reactions for each sample were pooled, and dimers removed by size-selecting with Agencourt AMPure XP beads (Beckman Coulter, Inc.) at a ratio of 1.6. The second step of PCR was performed as two separate 50 μl reactions with 50 ng of first step purified PCR product per reaction with Kapa Hifi Hotstart ReadyMix. The PCR primers used were, TF_BC_Shuffling_Step2_F: ACACTCTTTCCCTACACGACGCTCTTCCGATCTTGGTTGACGGCAATTTCGATG and TF_BC_Shuffling_R: GACTGGAGTTCAGACGTGTGCTCTTCCGATCTCACTGTTTAACAAGCCCGTCAGTAG. The thermocycling parameters were: 95 ˚C for 3 min; 6–8 cycles of (98 ˚C for 20 s; 65 ˚C for 15 s; and 72 ˚C for 30 s); and a final extension of 72 ˚C for 5 min. The numbers of cycles were tested to ensure that they fell within the linear phase of amplification. The amplicons from these two reactions for each sample were pooled, size-selected with Agencourt AMPure XP beads at a ratio of 0.8, and the supernatant from this was further size-selected and purified at a ratio of 1.6. The third step of PCR was performed as two separate 50 μl reactions with 50 ng of second step purified PCR product per reaction with Kapa Hifi Hotstart ReadyMix. Next Multiplex Oligos for Illumina (New England Biolabs) Index primers were used to attach Illumina adapters and indices to the samples. The thermocycling parameters were: 95 ˚C for 3 min; 6–8 cycles of (98 ˚C for 20 s; 65 ˚C for 20 s; 72 ˚C for 30 s); and 72 ˚C for 2 min. The amplicons from these two reactions for each sample were pooled, size-selected with Agencourt AMPure XP beads at a ratio of 0.8, and the supernatant from this was further size-selected and purified at a ratio of 1.6. The purified second-step PCR library was quantified by Qubit dsDNA HS assay (Thermo Fisher Scientific) and used for downstream sequencing on an Illumina HiSeq platform.
For amplification of barcodes from genomic DNA from cells transduced with the neural TF library in the TF-NoHygro format, genomic DNA was extracted from stored cell pellets with a DNeasy Blood and Tissue Kit (Qiagen). The barcode for the mCherry control only was amplified for next generation sequencing in two steps. The first step PCR was performed as three separate 50 μl reactions for each sample. 2 μg of genomic DNA was input per reaction with Kapa Hifi Hotstart ReadyMix. The PCR primers used were, No-Hygro_gDNA_mCh_Barcode_F: ACACTCTTTCCCTACACGACGCTCTTCCGATCCACCATCGTGGAACAGTACGAAC and No- Hygro_gDNA_Barcode_R: GACTGGAGTTCAGACGTGTGCTCTTCCGATCTTTCGATGCATGGGGTCGTGC. The thermocycling parameters were: 95 ˚C for 3 min; 28– 30 cycles of (98 ˚C for 20 s; 65 ˚C for 15 s; and 72 ˚C for 30 s); and a final extension of 72 ˚C for 5 min. The numbers of cycles were tested to ensure that they fell within the linear phase of amplification. Amplicons of 3 reactions for each sample were pooled, size-selected with Agencourt AMPure XP beads at a ratio of 0.8, and the supernatant from this was further size-selected and purified at a ratio of 1.6. The second step of PCR was performed as two separate 50 μl reactions with 50 ng of first step purified PCR product per reaction. Next Multiplex Oligos for Illumina (New England Biolabs) Index primers were used to attach Illumina adapters and indices to the samples. The thermocycling parameters were: 95 ˚C for 3 min; 6–8 cycles of (98 ˚C for 20 s; 65 ˚C for 20 s; 72 ˚C for 30 s); and 72 ˚C for 2 min. The amplicons from these two reactions for each sample were pooled, size-selected with Agencourt AMPure XP beads at a ratio of 0.8, and the supernatant from this was further size-selected and purified at a ratio of 1.6. The purified second-step PCR library was quantified by Qubit dsDNA HS assay (Thermo Fisher Scientific) and used for downstream sequencing on an Illumina MiSeq platform.
Single cell RNA-seq Processing and Genotype Deconvolution
Using the 10X genomics CellRanger pipeline, we aligned Fastq files to hg38, counted UMIs to generate counts matrices, and aggregated samples across 10X runs with cellranger aggr. All cellranger commands were run using default settings.
To assign one or more transcription factor genotypes to each cell, we aligned the plasmid barcode reads to hg38 using BWA, and then labeled each read with its corresponding cell and UMI tags. To remove potential chimeric reads, we used a two-step filtering process. First, we only kept UMIs that made up at least 0.5% of the total amount of reads for each cell. We then counted the number of UMIs and reads for each plasmid barcode within each cell, and only assigned that cell any barcode that contained at least 10% of the cell’s read and UMI counts. Barcodes were mapped to transcription factors within one edit distance of the expected barcode. The code for assigning genotypes to each cell can be found on GitHub at: https://github.com/yanwu2014/genotyping-matrices
To quantify barcode shuffling, we simply extracted the plasmid barcode from each read and counted the number of reads corresponding to each genotype.
Clustering and Cluster Enrichment
Clustering was performed on the aggregated counts matrices using the Seurat pipeline(Macosko et al., 2015). We first filtered the counts matrix for genes that are expressed in at least 1% of cells, and cells that express at least 200 genes. We then normalized the counts matrix, found overdispersed genes, and used a negative binomial linear model to regress away library depth, batch effects, and mitochondrial gene fraction. We performed PCA on the overdispersed genes, keeping the first 20 principal components. We then used the PCs to generate a K Nearest Neighbors graph, with K = 30, used the KNN graph to calculate a shared nearest neighbors graph, and used a modularity optimization algorithm on the SNN graph to find clusters. Clusters were recursively merged until all clusters could be distinguished from every other cluster with an out of the box error (oobe) of less than 5% using a random forest classifier trained on the top 15 genes by loading magnitude for the first 20 PCs. We used tSNE on the first 30 PCs to visualize the results.
Cluster enrichment was performed using Fisher’s exact test, testing each genotype for both over-enrichment and under-enrichment in each cluster.
Differential Expression and Identification of Significant Genotypes
We used a modified version of the MIMOSCA linear model(Dixit et al., 2016) to analyze the differentially expressed genes for each genotype (Table S4). In our model, we used the R glmnet package with the multigaussian family, with alpha (the lasso vs ridge parameter) set to 0.5. Lambda (the coefficient magnitude regularization parameter) was set using 5-fold cross validation. We also used mCherry as a control genotype, computing gene expression changes for each genotype against the mCherry control. Our method outputs a genes by genotypes matrix of regression coefficients, where each coefficient corresponds to the effect of each genotype on each gene relative to the mCherry control. P-values were calculated empirically by randomly permuting the genotype assignments, and then false discovery rates were calculated using the Benjamini-Hochberg procedure.
TFs were chosen as significant for downstream analysis if they were enriched for at least one cluster with a p-value of less than 10−12, or if the TF drove statistically significant differential expression of greater than 50 genes. Our threshold for calling a differentially expressed gene is that the false discovery rate was less than 0.05, and the absolute coefficient magnitude was greater than 0.025.
Gene Co-perturbation Network and Module Detection
We took the genes by genotypes coefficients matrix from the regression analysis with trimmed genotypes and used it to calculate the Euclidean distance between genes, using the significant genotypes as features. We then built a k-nearest neighbors graph from the Euclidean distances between genes, with k = 30. From this kNN graph, we calculated the fraction of shared nearest neighbors (SNN) for each pair of genes to build and SNN graph. For example, if two genes share 23/30 neighbors, we create an edge between them in the SNN graph with a weight of 23/30 = 0.767.
To identify gene modules, we used the Louvain modularity optimization algorithm(Blondel et al., 2008). For each gene module, we identified enriched Gene Ontology terms using Fisher’s exact test (Table S4). We also ranked genes in each gene module by the number of enriched Gene Ontology terms the gene is part of, to identify the most biologically significant genes in each module (Table S4). Gene module identities were assigned based on manual inspection of enriched GO terms and the genes within each module. The effect of each genotype on a gene module was calculated by taking the average of the regression coefficients for the genotype and the genes within the module. Gene modules where no genotype had an average absolute coefficient of at least 0.05 were dropped from further analysis in order to exclude gene modules that did not show variation across our dataset.
Replicate Correlation
For each of the medium conditions, we had two replicate screens. To establish the reproducibility of our screens, we correlated the regression coefficients of the replicates, where each coefficient represents the effect of a single TF on a single gene using a Pearson correlation. Because the vast majority of coefficients were either zero or very close to zero, we only correlated coefficients that were nonzero with an false discovery rate of less than 0.5 in at least one replicate (not both). This essentially filters out the coefficients that are zero or close to zero in both replicates.
To compare the results of our screen vs the bulk microarray overexpression screen, we used GSEA to assess the enrichment in the TF-gene effects (in the form of regression coefficients) with the downstream targets for that same TF as determined by the bulk microarray screen.
Fitness Effect Analysis
To calculate fitness effects from genomic DNA reads, we first used MagECK(Li et al., 2014) to align reads to genotype barcodes and count the number of reads for each genotype in each sample, resulting in a genotypes by samples read counts matrix. We normalized the read counts matrix by dividing each column by the sum of that column, and then calculated log fold-change by dividing each sample by the normalized plasmid library counts, and then taking a log2 transform. For the stem cell media, we averaged the log fold change across the non MACS sorted samples.
To calculate fitness effects from genotype counts identified from single cell RNA-seq, we used a cell counts matrix instead of a read counts matrix, and repeated the above protocol. To correlate the fitness replicates, used a Pearson correlation of the log fold-changes.
Epithelial mesenchymal transition analysis
We took genes from the Hallmark Epithelial Mesenchymal Transition geneset from MSigDB(Subramanian et al., 2005) and ran PCA on those genes with the stem cell medium dataset, visualizing the first two principal components. The two principal components resulted in an EMT-like signature, and we used the gene loadings from those principal components, along with literature research to identify a relevant panel of EMT related genes to display.
RNA Extraction, qRT-PCR and bulk RNA-seq library preparation
RNA was extracted from cells using the RNeasy Mini Kit (Qiagen) as per the manufacturer’s instructions. The quality and concentration of the RNA samples was measured using a spectrophotometer (Nanodrop 2000, Thermo Fisher Scientific). cDNA was prepared using the Protoscript II First Strand cDNA synthesis kit (New England Biolabs) in a 20 μl reaction and diluted up to 1:5 with nuclease-free water.
qRT-PCR reactions were setup as: 2 μl cDNA, 400 nM of each primer, 2X Kapa SYBR Fast Master Mix (Kapa Biosystems), H2O up to 20 μl. qRT-PCR was performed using a CFX Connect Real Time PCR Detection System (Bio-Rad) with the thermocycling parameters: 95 ˚C for 3 min; 95 ˚C for 3 s; 60 ˚C for 20 s, for 40 cycles. All experiments were performed in triplicate and results were normalized against a housekeeping gene, GAPDH. Relative mRNA expression levels, compared with GAPDH, were determined by the comparative cycle threshold (ΔΔCT) method. Primers used for qRT-PCR are listed in Table S5. For confirmation of overexpression by qRT-PCR, primers were chosen such that they amplified a portion of the transcript in the hygromycin resistance region. This was done to avoid amplification of any endogenous transcripts, and since the overexpression is driven by a single promoter the TF, P2A peptide and the hygromycin resistance are on a single transcript.
Bulk RNA-seq libraries were prepared from 150 ng of RNA using the NEBNext Ultra RNA Library Prep kit for Illumina (New England Bioloabs) as per the manufacturer’s instructions. Libraries were sequenced on an Illumina HiSeq platform.
Bulk RNA-Seq Analysis and Correlation
We mapped the bulk RNA-Seq fastq files to GRCh38 and quantified read counts mapping to each gene’s exon using Gencode v28 and STAR aligner(Dobin et al., 2013). We used total counts normalization to adjust for library size effects, and then took a log-transform to adjust for heteroscedasticity. To quantify the effect of each TF versus mCherry, we took the log fold- change (logFC) of each TF’s normalized expression versus the mCherry normalized expression. We compared this bulk logFC to the single cell RNA-seq regression coefficients using Pearson correlation.
Immunofluorescence
Cells were fixed with 4% (wt/vol) paraformaldehyde in PBS at room temperature for 30 minutes. Cells were then incubated with a blocking buffer: 5% donkey serum, 0.2% Triton X-100 in PBS for 1 hour at room temperature followed by incubation with primary antibodies diluted in the blocking buffer at 4 ˚C overnight. Primary antibodies used were: VE-Cadherin (D87F2, RRID: AB_2077969, Cell Signaling Technology; 1:400), EPCAM (VU1D9, RRID: AB_558797, Thermo Fisher, 1:200), Vimentin (AF2105, RRID: AB_355153, R&D Systms, 1:50). Secondary antibodies used were: DyLight 488 labelled donkey anti-rabbit IgG (ab96891, Abcam; 1:250), DyLight 488 labelled donkey anti-goat IgG (ab96931, Abcam, 1:250), AlexaFluor 488 labelled goat anti-mouse IgG (A-11001, Thermo Fisher, 1:500).
After overnight incubation with primary antibodies, cells were labelled with secondary antibodies diluted in 1% BSA in PBS for 1 hour at 37 °C. Nuclear staining was done by incubating cells with DAPI for 5 minutes at room temperature. All imaging was conducted on a Leica DMi8 inverted microscope equipped with an Andor Zyla sCMOS camera and a Lumencor Spectra X multi-wavelength fluorescence light source.
Endothelial Tube Formation Assay
A mCherry expressing H1 cell line was created by transducing H1 cells with a lentivirus containing the EF1α promoter driving expression of the mCherry transgene, internal ribosome entry site (IRES) and a puromycin resistance gene. Cells were then maintained under constant puromycin selection at a dose of 0.75 μg/ml. mCherry labelled H1 cells were transduced with either ETV2 lentivirus or control mCherry lentivirus, hygromycin selection was started on day 2 and cells were used for tube formation assay on day 6.
Growth-factor reduced Matrigel (Corning) was thawed on ice and 250 μl was deposited cold per well of a 24-well plate. The deposited Matrigel was incubated for 60 minutes at 37 °C, 5% CO2, to allow for complete gelation and the ETV2-transduced or control cells were then seeded on it at a density of 3.2×10⁵ cells per well in a volume of 500 μl EGM. Imaging was conducted 24 hours after deposition of the cells.
QUANTIFICATION AND STATISTICAL ANALYSIS
P-values for the regression coefficients were calculated by permutation testing, and p-values for the cluster enrichment were calculated from Fisher’s exact test. All P-values were adjusted using the Benjamini-Hochberg method.
Supplementary Material
Summary of transcription factor, gene family and mutant gene libraries, related to Figure 1, Figure 2 and STAR Methods
Summary of QC metrics of each scRNA-seq dataset, related to Figure 1, Figure 2, STAR Methods
Genotyping summary for each scRNA-seq dataset, related to Figure 1, Figure 2, STAR Methods
Summary of gene module analysis: biological function and gene membership, related to Figure 1
Highlights.
Transcription factor overexpression in hPSCs screened by scRNA-seq based method
Transcriptomic responses enable construction of genetic co-regulatory networks
Fitness readout identifies ETV2 as reprogramming factor to endothelial-like state
Screening method is also applied to mutant proteins and whole gene families
ACKNOWLEDGEMENTS
We acknowledge Dr Tse Nga Ng for her support of U.P., members of the Mali and Zhang lab for helpful discussions, and the UCSD Institute for Genomic Medicine sequencing core for their support on scRNA-seq sample preparation and sequencing. This work was generously supported by the following sources: UCSD Institutional Funds, the Burroughs Wellcome Fund (1013926), the March of Dimes Foundation (5-FY15–450), the Kimmel Foundation (SKF-16–150), and NIH grants (R01HG009285, RO1CA222826, RO1GM123313).
Footnotes
DECLARATION OF INTERESTS
K.Z. is a co-founder, equity holder, and paid consultant of Singlera Genomics, which has no commercial interests related to this study. The terms of these arrangements are being managed by the University of California, San Diego in accordance with its conflict of interest policies. P.M. is a scientific co-founder and scientific advisory board member of Navega Therapeutics, Pretzel Therapeutics, Engine Biosciences, and Shape Therapeutics, which have no commercial interests related to this study. The terms of these arrangements have been reviewed and approved by the University of California, San Diego in accordance with its conflict of interest policies. P.M., K.Z., U.P., Y.W., and D.Z. have filed a patent based on this work.
DATA AND SOFTWARE AVAILABILITY
Analysis was performed with previously reported software pipelines (CellRanger 2.1.1, Seurat, MAGeCK) as well as custom software pipelines developed for this paper constructed in R (https://github.com/yanwu2014/SEUSS-Analysis; https://github.com/yanwu2014/genotyping-matrices; https://github.com/yanwu2014/perturbLM). All analysis code can be found at https://github.com/yanwu2014/SEUSS-Analysis.
Information on metrics for the screens is available in Table S2. Summary of data on differential gene expression is available in Table S3. Geneset enrichment, top genes in genesets and gene module annotation information is available in Table S4. The accession number for scRNA-seq data as well as fitness data for all screens is GEO: GSE107185.
Publisher's Disclaimer: This is a PDF file of an unedited manuscript that has been accepted for publication. As a service to our customers we are providing this early version of the manuscript. The manuscript will undergo copyediting, typesetting, and review of the resulting proof before it is published in its final citable form. Please note that during the production process errors may be discovered which could affect the content, and all legal disclaimers that apply to the journal pertain.
REFERENCES
- Abujarour R, Bennett M, Valamehr B, Lee TT, Robinson M, Robbins D, Le T, Lai K and Flynn P (2014). Myogenic differentiation of muscular dystrophy-specific induced pluripotent stem cells for use in drug discovery. Stem Cells Translational Medicine, 3(2), 149–60. [DOI] [PMC free article] [PubMed] [Google Scholar]
- Adamson B, Norman TM, Jost M, Cho MY, Nuñez JK, Chen Y, Villalta JE, Gilbert LA, Horlbeck MA, Hein MY, et al. (2016). A Multiplexed Single-Cell CRISPR Screening Platform Enables Systematic Dissection of the Unfolded Protein Response. Cell, 167(7), 1867–1882.e21. [DOI] [PMC free article] [PubMed] [Google Scholar]
- Adamson B, Norman TM, Jost M and Weissman JS (2018). Approaches to maximize sgRNA-barcode coupling in Perturb-seq screens. bioRxiv, 298349. [Google Scholar]
- Barrallo-Gimeno A, Nieto MA and Ip YT (2005). The Snail genes as inducers of cell movement and survival: implications in development and cancer. Development, 132(14), 3151–61. [DOI] [PubMed] [Google Scholar]
- Blondel VD, Guillaume J-L, Lambiotte R and Lefebvre E (2008). Fast unfolding of communities in large networks. arXiv, 1–12. [Google Scholar]
- Busskamp V, Lewis NE, Guye P, Ng AHM, Shipman SL, Byrne SM, Sanjana NE, Murn J, Li Y, Li S, et al. (2014). Rapid neurogenesis through transcriptional activation in human stem cells. Molecular Systems Biology, 10(11), 760. [DOI] [PMC free article] [PubMed] [Google Scholar]
- Cao J, Packer JS, Ramani V, Cusanovich DA, Huynh C, Daza R, Qiu X, Lee C, Furlan SN, Steemers FJ, et al. (2017). Comprehensive single-cell transcriptional profiling of a multicellular organism. Science, 357(6352), 661–667. [DOI] [PMC free article] [PubMed] [Google Scholar]
- Chanda S, Ang CE, Davila J, Pak C, Mall M, Lee QY, Ahlenius H, Jung SW, Sudhof TC and Wernig M (2014). Generation of induced neuronal cells by the single reprogramming factor ASCL1. Stem Cell Reports, 3(2), 282–96. [DOI] [PMC free article] [PubMed] [Google Scholar]
- Clotman F, Jacquemin P, Plumb-Rudewiez N, Pierreux CE, Van der Smissen P, Dietz HC, Courtoy PJ, Rousseau GG and Lemaigre FP (2005). Control of liver cell fate decision by a gradient of TGF beta signaling modulated by Onecut transcription factors. Genes & Development, 19(16), 1849–54. [DOI] [PMC free article] [PubMed] [Google Scholar]
- D’Angelo A, Bluteau O, Garcia-Gonzalez MA, Gresh L, Doyen A, Garbay S, Robine S, Pontoglio M and Barra J (2010). Hepatocyte nuclear factor lalpha and beta control terminal differentiation and cell fate commitment in the gut epithelium. Development, 137(9), 1573–82. [DOI] [PubMed] [Google Scholar]
- Datlinger P, Rendeiro AF, Schmidl C, Krausgruber T, Traxler P, Klughammer J, Schuster LC, Kuchler A, Alpar D and Bock C (2017). Pooled CRISPR screening with single-cell transcriptome readout. Nature Methods, 14(3), 297–301. [DOI] [PMC free article] [PubMed] [Google Scholar]
- Davis RL, Weintraub H and Lassar AB (1987). Expression of a single transfected cDNA converts fibroblasts to myoblasts. Cell, 51(6), 987–1000. [DOI] [PubMed] [Google Scholar]
- Dixit A, Parnas O, Li B, Chen J, Fulco CP, Jerby-Arnon L, Marjanovic ND, Dionne D, Burks T, Raychowdhury R, et al. (2016). Perturb-Seq: Dissecting Molecular Circuits with Scalable Single-Cell RNA Profiling of Pooled Genetic Screens. Cell, 167(7), 1853–1866.e17. [DOI] [PMC free article] [PubMed] [Google Scholar]
- Dobin A, Davis CA, Schlesinger F, Drenkow J, Zaleski C, Jha S, Batut P, Chaisson M and Gingeras TR (2013). STAR: Ultrafast universal RNA-seq aligner. Bioinformatics, 29(1), 15–21. [DOI] [PMC free article] [PubMed] [Google Scholar]
- Dominguez AA, Lim WA and Qi LS (2016). Beyond editing: repurposing CRISPR-Cas9 for precision genome regulation and interrogation. Nature Reviews Molecular Cell Biology, 17(1), 5–15. [DOI] [PMC free article] [PubMed] [Google Scholar]
- Gao Z, Ure K, Ables JL, Lagace DC, Nave K-A, Goebbels S, Eisch AJ and Hsieh J (2009). Neurod1 is essential for the survival and maturation of adult-born neurons. Nature Neuroscience, 12(9), 1090–2. [DOI] [PMC free article] [PubMed] [Google Scholar]
- Geis FK, Galla M, Hoffmann D, Kuehle J, Zychlinski D, Maetzig T, Schott JW, Schwarzer A, Goffinet C, Goff SP, et al. (2017). Potent and reversible lentiviral vector restriction in murine induced pluripotent stem cells. Retrovirology, 14(1), 34. [DOI] [PMC free article] [PubMed] [Google Scholar]
- Gumireddy K, Li A, Gimotty PA, Klein-Szanto AJ, Showe LC, Katsaros D, Coukos G, Zhang L and Huang Q (2009). KLF17 is a negative regulator of epithelial-mesenchymal transition and metastasis in breast cancer. Nature Cell Biology, 11(11), 1297–304. [DOI] [PMC free article] [PubMed] [Google Scholar]
- Hill AJ, McFaline-Figueroa JL, Starita LM, Gasperini MJ, Matreyek KA, Packer J, Jackson D, Shendure J and Trapnell C (2018). On the design of CRISPR-based single-cell molecular screens. Nature Methods, 15(4), 271–274. [DOI] [PMC free article] [PubMed] [Google Scholar]
- Jacquemin P, Durviaux SM, Jensen J, Godfraind C, Gradwohl G, Guillemot F, Madsen OD, Carmeliet P, Dewerchin M, Collen D, et al. (2000). Transcription factor hepatocyte nuclear factor 6 regulates pancreatic endocrine cell differentiation and controls expression of the proendocrine gene ngn3. Molecular and Cellular Biology, 20(12), 4445–54. [DOI] [PMC free article] [PubMed] [Google Scholar]
- Jacquemin P, Lemaigre FP and Rousseau GG (2003). The Onecut transcription factor HNF-6 (OC-1) is required for timely specification of the pancreas and acts upstream of Pdx-1 in the specification cascade. Developmental Biology, 258(1), 105–116. [DOI] [PubMed] [Google Scholar]
- Jaitin DA, Weiner A, Yofe I, Lara-Astiaso D, Keren-Shaul H, David E, Salame TM, Tanay A, van Oudenaarden A and Amit I (2016). Dissecting Immune Circuits by Linking CRISPR-Pooled Screens with Single-Cell RNA-Seq. Cell, 167(7), 1883–1896.e15. [DOI] [PubMed] [Google Scholar]
- Kolodziejczyk AA, Kim JK, Svensson V, Marioni JC and Teichmann SA (2015). The technology and biology of single-cell RNA sequencing. Molecular Cell, 58(4), 610–20. [DOI] [PubMed] [Google Scholar]
- Li R, Liang J, Ni S, Zhou T, Qing X, Li H, He W, Chen J, Li F, Zhuang Q, et al. (2010). A Mesenchymal-to-Epithelial Transition Initiates and Is Required for the Nuclear Reprogramming of Mouse Fibroblasts. Cell Stem Cell, 7(1), 51–63. [DOI] [PubMed] [Google Scholar]
- Li W, Xu H, Xiao T, Cong L, Love MI, Zhang F, Irizarry RA, Liu JS, Brown M and Liu XS (2014). MAGeCK enables robust identification of essential genes from genome-scale CRISPR/Cas9 knockout screens. Genome Biology, 15(12), 554. [DOI] [PMC free article] [PubMed] [Google Scholar]
- Lindgren AG, Veldman MB and Lin S (2015). ETV2 expression increases the efficiency of primitive endothelial cell derivation from human embryonic stem cells. Cell Regeneration, 4(1), 4:1. [DOI] [PMC free article] [PubMed] [Google Scholar]
- Liu Y-N, Abou-Kheir W, Yin JJ, Fang L, Hynes P, Casey O, Hu D, Wan Y, Seng V, Sheppard-Tillman H, et al. (2012). Critical and reciprocal regulation of KLF4 and SLUG in transforming growth factor β-initiated prostate cancer epithelial-mesenchymal transition. Molecular and Cellular Biology, 32(5), 941–53. [DOI] [PMC free article] [PubMed] [Google Scholar]
- Macosko EZ, Basu A, Satija R, Nemesh J, Shekhar K, Goldman M, Tirosh I, Bialas AR, Kamitaki N, Martersteck EM, et al. (2015). Highly Parallel Genome-wide Expression Profiling of Individual Cells Using Nanoliter Droplets. Cell, 161(5), 1202–1214. [DOI] [PMC free article] [PubMed] [Google Scholar]
- Maestro MA, Cardalda C, Boj SF, Luco RF, Servitja JM and Ferrer J (2007). Distinct roles of HNF1beta, HNF1alpha, and HNF4alpha in regulating pancreas development, beta-cell function and growth. Endocrine Development, 12, 33–45. [DOI] [PubMed] [Google Scholar]
- Maherali N, Sridharan R, Xie W, Utikal J, Eminli S, Arnold K, Stadtfeld M, Yachechko R, Tchieu J, Jaenisch R, et al. (2007). Directly Reprogrammed Fibroblasts Show Global Epigenetic Remodeling and Widespread Tissue Contribution. Cell Stem Cell, 1(1), 55–70. [DOI] [PubMed] [Google Scholar]
- McConnell BB and Yang VW (2010). Mammalian Kruppel-like factors in health and diseases. Physiological Reviews, 90(4), 1337–81. [DOI] [PMC free article] [PubMed] [Google Scholar]
- Mohr S, Bakal C and Perrimon N (2010). Genomic screening with RNAi: results and challenges. Annual Review of Biochemistry, 79, 37–64. [DOI] [PMC free article] [PubMed] [Google Scholar]
- Morita R, Suzuki M, Kasahara H, Shimizu N, Shichita T, Sekiya T, Kimura A, Sasaki K, Yasukawa H and Yoshimura A (2015). ETS transcription factor ETV2 directly converts human fibroblasts into functional endothelial cells. Proceedings of the National Academy of Sciences, 112(1), 160–165. [DOI] [PMC free article] [PubMed] [Google Scholar]
- Nishiyama A, Xin L, Sharov AA, Thomas M, Mowrer G, Meyers E, Piao Y, Mehta S, Yee S, Nakatake Y, et al. (2009). Uncovering Early Response of Gene Regulatory Networks in ESCs by Systematic Induction of Transcription Factors. Cell Stem Cell, 5, 420–433. [DOI] [PMC free article] [PubMed] [Google Scholar]
- Niwa H, Toyooka Y, Shimosato D, Strumpf D, Takahashi K, Yagi R and Rossant J (2005). Interaction between Oct3/4 and Cdx2 Determines Trophectoderm Differentiation. Cell, 123(5), 917–929. [DOI] [PubMed] [Google Scholar]
- Pang ZP, Yang N, Vierbuchen T, Ostermeier A, Fuentes DR, Yang TQ, Citri A, Sebastiano V, Marro S, Sudhof TC, et al. (2011). Induction of human neuronal cells by defined transcription factors. Nature, 476(7359), 220–223. [DOI] [PMC free article] [PubMed] [Google Scholar]
- Park I-H, Zhao R, West JA, Yabuuchi A, Huo H, Ince TA, Lerou PH, Lensch MW and Daley GQ (2008). Reprogramming of human somatic cells to pluripotency with defined factors. Nature, 451(7175), 141–146. [DOI] [PubMed] [Google Scholar]
- Pataskar A, Jung J, Smialowski P, Noack F, Calegari F, Straub T and Tiwari VK (2016). NeuroD1 reprograms chromatin and transcription factor landscapes to induce the neuronal program. The EMBO Journal, 35(1), 24–45. [DOI] [PMC free article] [PubMed] [Google Scholar]
- Pelengaris S, Khan M and Evan G (2002). c-MYC: more than just a matter of life and death. Nature Reviews Cancer, 2(10), 764–776. [DOI] [PubMed] [Google Scholar]
- Pierreux CE, Poll AV, Kemp CR, Clotman F, Maestro MA, Cordi S, Ferrer J, Leyns L, Rousseau GG and Lemaigre FP (2006). The Transcription Factor Hepatocyte Nuclear Factor-6 Controls the Development of Pancreatic Ducts in the Mouse. Gastroenterology, 130(2), 532–541. [DOI] [PubMed] [Google Scholar]
- Rosenberg AB, Roco CM, Muscat RA, Kuchina A, Sample P, Yao Z, Graybuck LT, Peeler DJ, Mukherjee S, Chen W, et al. (2018). Single-cell profiling of the developing mouse brain and spinal cord with split-pool barcoding. Science, 360(6385), 176–182. [DOI] [PMC free article] [PubMed] [Google Scholar]
- La Russa MF and Qi LS (2015). The New State of the Art: Cas9 for Gene Activation and Repression. Molecular and Cellular Biology, 35(22), 3800–9. [DOI] [PMC free article] [PubMed] [Google Scholar]
- Sack LM, Davoli T, Xu Q, Li MZ and Elledge SJ (2016). Sources of Error in Mammalian Genetic Screens. G3, 6(9), 2781–90. [DOI] [PMC free article] [PubMed] [Google Scholar]
- Santoni de Sio FR, Gritti A, Cascio P, Neri M, Sampaolesi M, Galli C, Luban J and Naldini L (2008). Lentiviral Vector Gene Transfer Is Limited by the Proteasome at Postentry Steps in Various Types of Stem Cells. Stem Cells, 26(8), 2142–2152. [DOI] [PubMed] [Google Scholar]
- Servitja J-M, Pignatelli M, Maestro MA, Cardalda C, Boj SF, Lozano J, Blanco E, Lafuente A, McCarthy MI, Sumoy L, et al. (2009). Hnf1alpha (MODY3) controls tissue-specific transcriptional programs and exerts opposed effects on cell growth in pancreatic islets and liver. Molecular and Cellular Biology, 29(11), 2945–59. [DOI] [PMC free article] [PubMed] [Google Scholar]
- Shalem O, Sanjana NE and Zhang F (2015). High-throughput functional genomics using CRISPR-Cas9. Nature Reviews Genetics, 16(5), 299–311. [DOI] [PMC free article] [PubMed] [Google Scholar]
- Si-Tayeb K; Lemaigre FP; Duncan SA (2010). Organogenesis and Development of the Liver. Developmental Cell, 18(2), 175–189. [DOI] [PubMed] [Google Scholar]
- Strumpf D, Mao C-A, Yamanaka Y, Ralston A, Chawengsaksophak K, Beck F and Rossant J (2005). Cdx2 is required for correct cell fate specification and differentiation of trophectoderm in the mouse blastocyst. Development, 132(9), 2093–102. [DOI] [PubMed] [Google Scholar]
- Subramanian A, Tamayo P, Mootha VK, Mukherjee S, Ebert BL, Gillette M. a, Paulovich A, Pomeroy SL, Golub TR, Lander ES, et al. (2005). Gene set enrichment analysis: a knowledge-based approach for interpreting genome-wide expression profiles. Proceedings of the National Academy of Sciences, 102(43), 15545–15550. [DOI] [PMC free article] [PubMed] [Google Scholar]
- Sugimura R, Jha DK, Han A, Soria-Valles C, da Rocha EL, Lu Y-F, Goettel JA, Serrao E, Rowe RG, Malleshaiah M, et al. (2017). Haematopoietic stem and progenitor cells from human pluripotent stem cells. Nature, 545(7655), 432–438. [DOI] [PMC free article] [PubMed] [Google Scholar]
- Takahashi K, Tanabe K, Ohnuki M, Narita M, Ichisaka T, Tomoda K and Yamanaka S (2007). Induction of pluripotent stem cells from adult human fibroblasts by defined factors. Cell, 131(5), 861–72. [DOI] [PubMed] [Google Scholar]
- Takahashi K and Yamanaka S (2006). Induction of pluripotent stem cells from mouse embryonic and adult fibroblast cultures by defined factors. Cell, 126(4), 663–76. [DOI] [PubMed] [Google Scholar]
- Tiwari N, Meyer-Schaller N, Arnold P, Antoniadis H, Pachkov M, van Nimwegen E and Christofori G (2013). Klf4 Is a Transcriptional Regulator of Genes Critical for EMT, Including Jnk1 (Mapk8). PLoS ONE. Edited by Katz E, 8(2), e57329. [DOI] [PMC free article] [PubMed] [Google Scholar]
- Tsang KM, Hyun JS, Cheng KT, Vargas M, Mehta D, Ushio-Fukai M, Zou L, Pajcini KV, Rehman J and Malik AB (2017). Embryonic Stem Cell Differentiation to Functional Arterial Endothelial Cells through Sequential Activation of ETV2 and NOTCH1 Signaling by HIF1a. Stem Cell Reports, 9(3), 796–806. [DOI] [PMC free article] [PubMed] [Google Scholar]
- Wernig M, Meissner A, Foreman R, Brambrink T, Ku M, Hochedlinger K, Bernstein BE and Jaenisch R (2007). In vitro reprogramming of fibroblasts into a pluripotent ES-cell-like state. Nature, 448(7151), 318–324. [DOI] [PubMed] [Google Scholar]
- Xie S, Cooley A, Armendariz D, Zhou P and Hon GC (2018). Frequent sgRNA-barcode recombination in single-cell perturbation assays. PLOS ONE. Edited by Hu W, 13(6), e0198635. [DOI] [PMC free article] [PubMed] [Google Scholar]
- Xie S, Duan J, Li B, Zhou P and Hon GC (2017). Multiplexed Engineering and Analysis of Combinatorial Enhancer Activity in Single Cells. Molecular Cell, 66(2), 285–299.e5. [DOI] [PubMed] [Google Scholar]
- Xu J, Du Y and Deng H (2015). Direct lineage reprogramming: strategies, mechanisms, and applications. Cell Stem Cell, 16(2), 119–34. [DOI] [PubMed] [Google Scholar]
- Yang N, Chanda S, Marro S, Ng Y-H, Janas JA, Haag D, Ang CE, Tang Y, Flores Q, Mall M, et al. (2017). Generation of pure GABAergic neurons by transcription factor programming. Nature Methods, 14(6), 621–628. [DOI] [PMC free article] [PubMed] [Google Scholar]
- Yu J, Vodyanik MA, Smuga-Otto K, Antosiewicz-Bourget J, Frane JL, Tian S, Nie J, Jonsdottir GA, Ruotti V, Stewart R, et al. (2007). Induced Pluripotent Stem Cell Lines Derived from Human Somatic Cells. Science, 318(5858), 1917–1920. [DOI] [PubMed] [Google Scholar]
- Zhang B, Zhang Z, Xia S, Xing C, Ci X, Li X, Zhao R, Tian S, Ma G, Zhu Z, et al. (2013). KLF5 activates microRNA 200 transcription to maintain epithelial characteristics and prevent induced epithelial-mesenchymal transition in epithelial cells. Molecular and Cellular Biology, 33(24), 4919–35. [DOI] [PMC free article] [PubMed] [Google Scholar]
- Zhang Y, Pak C, Han Y, Ahlenius H, Zhang Z, Chanda S, Marro S, Patzke C, Acuna C, Covy J, et al. (2013). Rapid single-step induction of functional neurons from human pluripotent stem cells. Neuron, 78(5), 785–98. [DOI] [PMC free article] [PubMed] [Google Scholar]
- Zhang Y, Pak C, Han Y, Ahlenius H, Zhang Z, Chanda S, Marro S, Patzke C, Acuna C, Covy J, et al. (2013). Rapid Single-Step Induction of Functional Neurons from Human Pluripotent Stem Cells. Neuron, 78(5), 785–798. [DOI] [PMC free article] [PubMed] [Google Scholar]
Associated Data
This section collects any data citations, data availability statements, or supplementary materials included in this article.
Supplementary Materials
Summary of transcription factor, gene family and mutant gene libraries, related to Figure 1, Figure 2 and STAR Methods
Summary of QC metrics of each scRNA-seq dataset, related to Figure 1, Figure 2, STAR Methods
Genotyping summary for each scRNA-seq dataset, related to Figure 1, Figure 2, STAR Methods
Summary of gene module analysis: biological function and gene membership, related to Figure 1