

Abstract
The pleiotropic interleukin-6 (IL-6)–type cytokine oncostatin M (OSM) signals in multiple cell types, affecting processes such as cell differentiation, hematopoiesis, and inflammation. In humans, OSM exerts its effects through activation of either of two different heterodimeric receptor complexes, formed by glycoprotein 130 (gp130) and either OSM receptor (OSMR) or leukemia inhibitory factor receptor (LIFR). In contrast, the mouse OSM orthologue acts mainly through dimers containing OSMR and gp130 and shows limited activity through mouse LIFR. Despite their structural similarity, neither human nor mouse OSM signal through the other species' OSMR. The molecular basis for such species-specific signaling, however, remains poorly understood. To identify key molecular features of OSM that determine receptor activation in humans and mice, we generated chimeric mouse-human cytokines. Replacing regions within binding site III of murine OSM with the human equivalents showed that the cytokine's AB loop was critical for receptor selection. Substitutions of individual amino acids within this region demonstrated that residues Asn-37, Thr-40, and Asp-42 of the murine cytokine were responsible for limited LIFR activation and absence of human OSMR/LIFR signaling. In human OSM, Lys-44 appeared to be the main residue preventing mouse OSMR activation. Our data reveal that individual amino acids within the AB loop of OSM determine species-specific activities. These mutations might reflect a key step in the evolutionary process of this cytokine, in which receptor promiscuity gives way to ligand-receptor specialization.
Keywords: cell signaling, cytokine, signal transduction, STAT3, protein-protein interaction, LIFR, oncostatin M, OSM, OSMR
Introduction
The interleukin-6 (IL-6)3 family encompasses 10 different members; in addition to IL-6, these include ciliary neurotrophic factor, cardiotrophin-1, leukemia inhibitory factor (LIF), and OSM, among others (1–9). All of them adopt a characteristic secondary structure, comprising a four-helical bundle joined by loops (10–13). Biological actions are mediated by binding to receptor complexes in the cell membrane, formed by gp130 and additional co-receptors such as LIFR and OSMR (14). Upon activation, these complexes initiate intracellular signaling events through phosphorylation of components of different pathways, such as the mitogen-activated protein kinases (MAPKs), the phosphoinositide 3-kinase/protein kinase B (PI3K/Akt), and the Janus kinase/signal transducer and activator of transcription (STAT) (15).
Cytokines and receptors of the IL-6 family originate from a small set of genes that underwent gene duplication (16, 17). As a result, IL-6 class cytokines employ analogous receptor recognition epitopes to interact with receptors. Binding site II, required for gp130 recruitment, is located in helices A and C; binding site III, necessary for recognition of co-receptors such as OSMR or LIFR, is formed by residues in the N-terminal region of helix D as well as the loops between helices A and B and helices B and C (13).
Within the IL-6 family, OSM is regarded as unique due to its ability to bind with high affinity to two different receptor complexes, the shared LIFR/gp130 and the specific OSMR/gp130 (3, 18). This dual-receptor activation, first described for human OSM (hOSM), has also been confirmed for the rat orthologue (19). In contrast, mouse OSM (mOSM) was initially reported to lack LIFR/gp130 signaling ability in mice (20, 21). More recent work has revealed the existence of a low-affinity interaction between mOSM and the murine LIFR resulting in STAT3- but not STAT1-mediated signaling (22, 23). Nonetheless, all studies agree on fundamental differences in cytokine-receptor interactions of human and mouse OSM. This fact is further emphasized by the lack of cross-species activity; hOSM signals through murine LIFR but not mouse OSMR, whereas mOSM cannot activate any of the human receptors (Fig. 1, A and B) (19, 21). However, the underlying molecular features differentiating mOSM and hOSM remain enigmatic.
Figure 1.

Design of murine/human OSM chimeras. A and B, mouse and human OSM possess different signaling properties. C, three-dimensional model of murine OSM, with the AB loop and D-helix regions that modulate OSMR activation in the human cytokine highlighted. D, alignment of the AB loop and D-helix regions in binding site III of mouse and human OSM. Murine sequences were replaced by human equivalents to create murine-based OSM chimeras.
Here we investigated the molecular determinants of mouse and human OSM for controlling receptor recognition and activation. Chimeric cytokines were created to assess the relevance of binding site III region of mouse OSM for receptor interactions, as components of this region are crucial for initiation of hOSMR signaling (24). Replacement of the AB loop in mOSM by the corresponding hOSM amino acid sequence resulted in a chimera that initiates mLIFR as well as hOSMR and hLIFR signaling. Ensuing site-directed mutagenesis experiments identified residues Asn-37, Thr-40, and Asp-42 in the AB loop of mOSM to determine limited activation of mLIFR and human receptor activity by mOSM. Furthermore, substitutions of these residues in hOSM resulted in variants capable of mOSMR activation, highlighting the importance of the Asp to Lys exchange for evading mOSMR signaling.
We reason that the generation of mouse OSM variants essentially owning the same functional features as human OSM will facilitate future preclinical studies in mice. Our results also offer an explanation for the potential evolutionary path of this cytokine, in which the spatial rearrangements that resulted in promiscuous OSMR and LIFR activation (24) are followed by amino acid mutations promoting receptor specialization.
Results
Design and production of mouse-human OSM chimeric cytokines
The crystal structure of mOSM has not been described so far, but the high degree of sequence identity between the murine and human OSM orthologues allows generation of a homology model (Fig. 1C) based on data from the published hOSM structure (Protein Data Bank code 1EVS) (13). We recently reported the existence of two specific regions within binding site III of hOSM, the AB loop and N-terminal helix D, determining hOSMR interaction (24). Reasoning that the same regions might also influence species-specific receptor recognition, we aligned the amino acid sequences of mouse and human OSM using ClustalW (25) and compared the AB loop and helix D, selecting two different replacement lengths for each region.
The first nonconserved amino acid in the AB loop (Leu in mOSM) was chosen as the starting point of both substitutions. In the shorter chimera (AB1) the replacement was 12 amino acids long, stopping just before the conserved Cys required to maintain the secondary structure of OSM (26). This region was extended by six additional amino acids in the AB2 chimera. In both D-helix chimeras, the substitution included the residue immediately before the second conserved Cys (Ser in mOSM). The D1 chimera included 11 amino acids, whereas the longer D2 replaced 15 residues of mOSM by 18 residues of hOSM (Fig. 1D).
Because we knew from previous experience that bacterial expression of hOSM-based chimeras is not efficient (24), we employed a mammalian expression system (FreeStyle 293-F cells) for all experiments.
Murine and human receptor activation readout systems
OSM is unable to interact with OSMR without the contribution of gp130, complicating the direct measurement of OSM-OSMR binding affinity (18, 27). Furthermore, ligand–receptor binding might not always be equivalent to receptor signaling. Therefore, we monitored short-term phosphorylation changes in downstream signaling molecules, such as STAT3, or the expression of genes regulated by OSMR activation, such as TIMP1 (28, 29). To determine murine receptor activation, we identified a cell line (MH-S, murine alveolar macrophage cells) that exclusively expresses mLIFR but not mOSMR. We also created a lentiviral-mediated mLIFR knockdown cell line (NIH3T3, mouse embryo fibroblast cells) to specifically monitor mOSMR signaling (Fig. S1). In both cases, STAT3 Tyr-705 phosphorylation levels were assessed 10 min post-stimulation as a reflection of receptor activation. In addition, TIMP1 protein levels in NIH3T3 cells were measured 24 h post-stimulation as a specific readout for mOSMR activation (Fig. S2). Human receptor activation was measured using a similar approach, employing different cell lines (A375 cells for hOSMR, JAR cells for hLIFR) and previously established short- and long-term readout systems, such as the assessment of STAT3 phosphorylation, TIMP1 expression, and inhibition of A375 cell proliferation after hOSMR activation (24).
The AB loop in binding site III of mouse OSM modulates species-specific receptor activation
To assess the role of the OSM binding site III in species-specific receptor signaling, we first generated mOSM-based chimeric cytokines with different replacements in either the AB loop or N-terminal D-helix and analyzed them in the murine readout systems (Fig. 2A). Both AB loop chimeras became capable of phosphorylating STAT3 in mLIFR-specific MH-S cells, whereas N-terminal helix D replacements had a much smaller impact on mLIFR signaling (Fig. 2B), clearly suggesting that the murine AB loop residue composition is the main cause for the weak interaction with mLIFR. Intriguingly, all chimeras still maintained the ability to activate mOSMR, as indicated by up-regulation of TIMP1 expression in NIH3T3 cells (Fig. 2C) and high levels of STAT3 Tyr-705 phosphorylation in stable mLIFR knockdown cells (Fig. 2, E–G).
Figure 2.

The AB loop of mouse OSM prevents mouse LIFR activation. A, representation of different domain exchanges in mouse OSM-based chimeras by corresponding hOSM counterparts. B, STAT3 phosphorylation levels in MH-S cells (mLIFR activity) 10 min after cytokine stimulation. C, TIMP1 levels in NIH3T3 cells (mOSMR activity) 24 h after stimulation. D, relative quantification of receptor activation by each chimeric cytokine; P-STAT3 band intensities were first normalized against total STAT3 levels, and TIMP1 band intensities were normalized against pan-actin levels. Data were then transformed relative to the basal (Ctrl) signal, which was set to 0. Values are presented as mean ± S.E. (error bars), n = 5 independent cultures; not significant (n.s.), p > 0.05; **, p < 0.01. E and F, STAT3 phosphorylation levels in NIH3T3 cells transduced with a control vector (mOSMR and mLIFR activity) or shRNA directed against mLIFR (mOSMR activity) 10 min after cytokine stimulation. G, relative quantification of receptor activation by each chimeric cytokine: P-STAT3 band intensities were first normalized against total STAT3 levels and then transformed relative to the basal (Ctrl) signal, which was set to 0. Values are presented as mean ± S.E., n = 5 independent cultures; not significant (n.s.), p > 0.05; **, p < 0.01.
Next we tested whether the different mouse-human replacements showed human receptor activation. In line with the mLIFR results, the mouse AB loop variants induced clear receptor activation of both hOSMR and hLIFR. We observed that AB chimeras increased STAT3 phosphorylation in hOSMR-specific A375 cells and hLIFR-specific JAR cells (Fig. 3, A–C). Longer-term stimulations confirmed these findings, with higher expression of TIMP1 in A375 cells and total STAT3 in JAR cells 24 h after stimulation (Fig. 3, D–F). Finally, the mouse-human AB loop chimeras displayed hOSMR-mediated inhibition of A375 cell proliferation after 5 days of treatment (Fig. 3G).
Figure 3.

The AB loop of mouse OSM prevents human receptor activation. A and B, STAT3 phosphorylation levels in A375 cells (hOSMR activity) and JAR cells (hLIFR activity) 10 min after stimulation. C, relative quantification of receptor activation by each mutant cytokine: P-STAT3 band intensities were first normalized against total STAT3 levels. Data were then transformed relative to the basal (Ctrl) signal, which was set to 0. Values are presented as mean ± S.E. (error bars), n = 5 independent cultures. **, p < 0.01. D and E, TIMP1 levels in HepG2 cells (hOSMR activity) and STAT3 levels in JAR cells (hLIFR activity) 24 h after mutant cytokine stimulation. F, relative quantification of receptor activation by each mutant cytokine: TIMP1 and STAT3 band intensities were first normalized against pan-actin levels. Data were then transformed relative to the basal (Ctrl) signal, which was set to 0. Values are presented as mean ± S.E., n = 5 independent cultures; not significant (n.s.), p > 0.05; **, p < 0.01. G, A375 cell proliferation after 5-day cytokine stimulation, normalized to the proliferation of untreated cells. Values are presented as mean ± S.E., n = 3 independent cultures; not significant (n.s.), p > 0.05; **, p < 0.01.
Individual residues in the AB loop of mouse OSM are responsible for species-specific receptor activation
Our results suggested that a limited number of amino acids within the mOSM AB loop is responsible for the species-specific signaling of OSM. To identify these residues more precisely, we focused on differences between the human and mouse forms present in the shorter AB1 chimera (Fig. 4A). Two of the seven interspecies replacements (A45E and A46H) appeared unlikely to impact receptor activation, because hOSM alanine point mutants for these positions still retain full signaling ability through the human receptors (24).
Figure 4.

A limited number of amino acids in the AB loop of mouse OSM prevent mouse LIFR activation. A, depiction of the region exchanged in the shorter mouse OSM-based AB loop chimeras, with the differing amino acids between the mouse and human sequences highlighted. B, STAT3 phosphorylation levels in MH-S cells (mLIFR activity) 10 min after cytokine stimulation. C, TIMP1 levels in NIH3T3 cells (mOSMR activity) 24 h after stimulation. D, relative quantification of receptor activation by each mutant cytokine; P-STAT3 band intensities were first normalized against total STAT3 levels, and TIMP1 band intensities were normalized against pan-actin levels. Data were then transformed relative to the basal (Ctrl) signal, which was set to 0. Values are presented as mean ± S.E. (error bars), n = 5 independent cultures; **, p < 0.01. E and F, STAT3 phosphorylation levels in NIH3T3 cells transduced with a control vector (mOSMR and mLIFR activity) or shRNA directed against mLIFR (mOSMR activity) 10 min after cytokine stimulation. G, relative quantification of receptor activation by each mutant cytokine; P-STAT3 band intensities were first normalized against total STAT3 levels and then transformed relative to the basal (Ctrl) signal, which was set to 0. Values are presented as mean ± S.E., n = 5 independent cultures; not significant (n.s.), p > 0.05; **, p < 0.01.
The remaining five replacements (L35I, N37G, N39D, T40V, and D42K) were introduced into a mOSM mutant, which mirrored the behavior of the AB loop chimeras in terms of mouse receptor activation (Fig. 4, B–G). Quadruple mutants were also created to investigate the importance of each individual substitution (Fig. 4, B–G). Mutants in which Asn-37, Thr-40, or Asp-42 was still present showed impaired mLIFR signaling compared with the quintuple mutant (Fig. 4B), whereas mOSMR activity remained unaffected by any replacements (Fig. 4, C and F).
As in the case of the chimeras, the mOSM variants recapitulated human receptor signaling, as indicated by activation of both the hOSMR and hLIFR (Fig. 5, A–G). After a 10-min stimulation, only the quintuple mutants and those quadruple mutants containing N37G, T40V, and D42K replacements displayed more than 50% of the P-STAT3 signal intensity of hOSM through either hOSMR or hLIFR (Fig. 5, A–C). hOSMR-dependent TIMP1 expression and hLIFR-dependent STAT3 expression were similarly affected 24 h after stimulation (Fig. 5, D–F), as was hOSMR-mediated inhibition of A375 cell proliferation (Fig. 5G), again indicating closer similarities between the human receptors and mLIFR than to mOSMR.
Figure 5.

A limited number of amino acids in the AB loop of mouse OSM prevent human receptor activation. A and B, STAT3 phosphorylation levels in A375 cells (hOSMR activity) and JAR cells (hLIFR activity) 10 min after stimulation. C, relative quantification of receptor activation by each mutant cytokine; P-STAT3 band intensities were first normalized against total STAT3 levels. Data were then transformed relative to the basal (Ctrl) signal, which was set to 0. Values are presented as mean ± S.E. (error bars), n = 5 independent cultures; **, p < 0.01. D and E, TIMP1 levels in HepG2 cells (hOSMR activity) and STAT3 levels in JAR cells (hLIFR activity) 24 h after mutant cytokine stimulation. F, relative quantification of receptor activation by each mutant cytokine: TIMP1 and STAT3 band intensities were first normalized against pan-actin levels. Data were then transformed relative to the basal (Ctrl) signal, which was set to 0. Values are presented as mean ± S.E., n = 5 independent cultures; **, p < 0.01. G, A375 cell proliferation after 5-day cytokine stimulation, normalized to the proliferation of untreated cells. Values are presented as mean ± S.E., n = 3 independent cultures; *, p < 0.05; **, p < 0.01.
We subsequently generated single, double, and triple mOSM mutants to examine in more detail effects of N37G, T40V, and D42K replacements for OSMR and LIFR activation (Fig. 6A). Single substitutions led to a modest increase in mLIFR signaling, whereas the addition of more than one substitution resulted in a significant increase in activation, which was further enhanced when all three substitutions were included (Fig. 6B). Such alterations had no detectable impact on mOSMR signaling (Fig. 6, C–G), which is in line with results obtained from other mOSM mutants generated in this study. The new mOSM variants were able to initiate human receptor signaling, with the triple mutant again showing the best response in short- and long-term receptor activation readout systems (Fig. 7, A–G).
Figure 6.

Asn-37, Thr-40, and Asp-42 in the AB loop of mouse OSM hinder mouse LIFR activation. A, location of the three amino acids indicated by quadruple mOSM mutants to affect mLIFR signaling. B, STAT3 phosphorylation levels in MH-S cells (mLIFR activity) 10 min after cytokine stimulation. C, TIMP1 levels in NIH3T3 cells (mOSMR activity) 24 h after stimulation. D, relative quantification of receptor activation by each mutant cytokine; P-STAT3 band intensities were first normalized against total STAT3 levels, and TIMP1 band intensities were normalized against pan-actin levels. Data were then transformed relative to the basal (Ctrl) signal, which was set to 0. Values are presented as mean ± S.E. (error bars), n = 5 independent cultures; **, p < 0.01. E and F, STAT3 phosphorylation levels in NIH3T3 cells transduced with a control vector (mOSMR and mLIFR activity) or shRNA directed against mLIFR (mOSMR activity) 10 min after cytokine stimulation. G, relative quantification of receptor activation by each mutant cytokine: P-STAT3 band intensities were first normalized against total STAT3 levels and then transformed relative to the basal (Ctrl) signal, which was set to 0. Values are presented as mean ± S.E., n = 5 independent cultures; not significant (n.s.), p > 0.05; **, p < 0.01.
Figure 7.

Asn-37, Thr-40, and Asp-42 in the AB loop of mouse OSM prevent human receptor activation. A and B, STAT3 phosphorylation levels in A375 cells (hOSMR activity) and JAR cells (hLIFR activity) 10 min after stimulation. C, relative quantification of receptor activation by each mutant cytokine; P-STAT3 band intensities were first normalized against total STAT3 levels. Data were then transformed relative to the basal (Ctrl) signal, which was set to 0. Values are presented as mean ± S.E. (error bars), n = 5 independent cultures; **, p < 0.01. D and E, TIMP1 levels in HepG2 cells (hOSMR activity) and STAT3 levels in JAR cells (hLIFR activity) 24 h after mutant cytokine stimulation. F, relative quantification of receptor activation by each mutant cytokine; TIMP1 and STAT3 band intensities were first normalized against pan-actin levels. Data were then transformed relative to the basal (Ctrl) signal, which was set to 0. Values are presented as mean ± S.E., n = 5 independent cultures; **, p < 0.01. G, A375 cell proliferation after 5-day cytokine stimulation, normalized to the proliferation of untreated cells. Values are presented as mean ± S.E., n = 3 independent cultures; *, p < 0.05; **, p < 0.01.
Equivalent residues in the AB loop of human OSM are responsible for the absence of mouse OSMR activity
So far, our data indicated a specific role of residues Asn-37, Thr-40, and Asp-42 of the mOSM AB loop in preventing mLIFR and hOSMR/hLIFR activity. To examine whether the effect of these modifications is restricted to the murine cytokine, we replaced the equivalent amino acids (Gly-39, Val-42, and Lys-44, respectively) in the AB loop of hOSM, in addition to exchanging the whole loop (Fig. 8A). As expected, the presence of two or three substitutions abrogated the ability of hOSM to activate mLIFR (Fig. 8B). This effect was accompanied by acquisition of mOSMR signaling for all mutants containing the K44D exchange (Fig. 8, C–G), suggesting a possible participation of these amino acids in mOSMR recognition as well as in the prevention of mLIFR signaling.
Figure 8.

Corresponding residues in the AB loop of human OSM impede mouse OSMR activation. A, depiction of the point mutations and the AB loop domain exchange in hOSM-based cytokines. B, STAT3 phosphorylation levels in MH-S cells (mLIFR activity) 10 min after cytokine stimulation. C, TIMP1 levels in NIH3T3 cells (mOSMR activity) 24 h after stimulation. D, relative quantification of receptor activation by each mutant cytokine; P-STAT3 band intensities were first normalized against total STAT3 levels, and TIMP1 band intensities were normalized against pan-actin levels. Data were then transformed relative to the basal (Ctrl) signal, which was set to 0. Values are presented as mean ± S.E. (error bars), n = 5 independent cultures; **, p < 0.01. E and F, STAT3 phosphorylation levels in NIH3T3 cells transduced with a control vector (mOSMR and mLIFR activity) or shRNA directed against mLIFR (mOSMR activity) 10 min after cytokine stimulation. G, relative quantification of receptor activation by each mutant cytokine; P-STAT3 band intensities were first normalized against total STAT3 levels and then transformed relative to the basal (Ctrl) signal, which was set to 0. Values are presented as mean ± S.E., n = 5 independent cultures; not significant (n.s.), p > 0.05; **, p < 0.01.
Next, we tested the ability of hOSM variants to activate the human receptors. In agreement with previous reports (24), hOSMR activity was critically dependent on the presence of Gly-39 (Fig. 9, A–D). On the other hand, hLIFR activity was retained to some extent by all mutants, probably reflecting the more relaxed requirements of hLIFR for ligand interaction, although receptor activity declined 2–3-fold lower when several substitutions were combined (Fig. 9, B–F).
Figure 9.

Acquisition of mouse OSMR signaling by human OSM is accompanied by loss of human receptor activation. A and B, STAT3 phosphorylation levels in A375 cells (hOSMR activity) and JAR cells (hLIFR activity) 10 min after stimulation. C, relative quantification of receptor activation by each mutant cytokine: P-STAT3 band intensities were first normalized against total STAT3 levels. Data were then transformed relative to the basal (Ctrl) signal, which was set to 0. Values are presented as mean ± S.E. (error bars), n = 5 independent cultures; **, p < 0.01. D and E, TIMP1 levels in HepG2 cells (hOSMR activity) and STAT3 levels in JAR cells (hLIFR activity) 24 h after mutant cytokine stimulation. F, relative quantification of receptor activation by each mutant cytokine; TIMP1 and STAT3 band intensities were first normalized against pan-actin levels. Data were then transformed relative to the basal (Ctrl) signal, which was set to 0. Values are presented as mean ± S.E., n = 5 independent cultures; **, p < 0.01. G, A375 cell proliferation after 5-day cytokine stimulation, normalized to the proliferation of untreated cells. Values are presented as mean ± S.E. (n = 3 independent cultures); **, p < 0.01.
Modulation of receptor activation by the AB loop is not restricted to STAT3 signaling
Taken together, our results suggest that the amino acid composition of OSM's AB loop decisively influences species-specific receptor activation profiles of the murine and human cytokine orthologues. However, all readout systems employed throughout this work are dependent on STAT3 activation, which leaves the possibility that the observed changes in signaling were restricted to STAT3.
To make sure that the observed effects are not restricted to STAT3 signaling, we examined short-term signaling effects induced by some of the most relevant mutants through two of the other main OSMR-dependent pathways, STAT1 and STAT5 (27, 30). We found that mOSM, the mOSM and hOSM triple mutants, and the mOSM and hOSM AB chimeras showed increased phosphorylation of STAT3, STAT1, and STAT5 in mLIFR-knockdown murine cells after 10 min of cytokine treatment (Fig. 10, A and B). In contrast, only hOSM, hLIF, the mOSM triple mutant, and mOSM AB1 chimera were able to phosphorylate STAT1 as well as STAT3 in the mLIFR-specific MH-S cells (Fig. 10, C and D). STAT3 and STAT1 phosphorylation changes driven by mOSMR activation were still detectable 24 h after stimulation, which was not the case for STAT5 (Fig. 11, A and B). For mLIFR-initiated signaling, changes in STAT3 but not STAT1 were easily identified after 24 h (Fig. 11, C and D).
Figure 10.

Short-term changes in receptor activation are not restricted to STAT3 signaling. A, STAT3, STAT1, and STAT5 phosphorylation levels in NIH3T3 cells transduced with shRNA directed against mLIFR (mOSMR signaling) 10 min after cytokine stimulation. B, relative quantification of receptor activation by each cytokine; P-STAT band intensities were normalized against total STAT levels, followed by data transformation relative to the basal (Ctrl) level, which was set to 0. Values are presented as mean ± S.E. (error bars), n = 5 independent cultures. C, STAT3, STAT1, and STAT5 phosphorylation levels in MH-S cells (mLIFR signaling) 10 min after cytokine stimulation. D, relative quantification of receptor activation by each cytokine; P-STAT band intensities were normalized and transformed as described above. Values are presented as mean ± S.E., n = 3 independent cultures; not significant (n.s.), p > 0.05; *, p < 0.05; **, p < 0.01.
Figure 11.

Increased STAT3 phosphorylation is maintained 24 h post-stimulation. A, STAT3, STAT1, and STAT5 phosphorylation levels in NIH3T3 cells transduced with shRNA directed against mLIFR (mOSMR signaling) 24 h after cytokine stimulation. B, relative quantification of receptor activation by each cytokine; P-STAT band intensities were normalized against total STAT levels, followed by data transformation relative to the basal (Ctrl) level, which was set to 0; in the case of STAT5, the stronger basal signal was set to 1. Values are presented as mean ± S.E. (error bars), n = 3 independent cultures. C, STAT3, STAT1, and STAT5 phosphorylation levels in MH-S cells (mLIFR signaling) 24 h after cytokine stimulation. D, relative quantification of receptor activation by each cytokine; P-STAT band intensities were normalized and transformed as described above. Values are presented as mean ± S.E., n = 3 independent cultures; not significant (n.s.), p > 0.05; *, p < 0.05; **, p < 0.01.
We also analyzed short-term activation of the upstream regulator SHP2 and other OSMR-related pathways, such as PI3K/AKT and MAPKs (14, 15). In line with activation of STAT3, we observed increased phosphorylation of SHP2, AKT, and different MAPKs (ERK1/2, JNK, and p38) upon administration of the OSM triple mutants and AB loop chimeras (Fig. 12, A–D). We further found increased levels of other well-known OSMR target genes, such as HIF1α, SOD2, or VEGF, after 24 h (31–33), similar to the TIMP1 expression pattern (Fig. 13, A and B).
Figure 12.

Short-term OSMR activation stimulates PI3K and MAPK signaling pathways. A, SHP2 and AKT phosphorylation levels in serum-starved NIH3T3 cells transduced with shRNA directed against mLIFR (mOSMR signaling) 10 min after cytokine stimulation. B, relative quantification of receptor activation by each cytokine; band intensities were normalized against total protein levels, followed by data transformation relative to the basal (Ctrl) level, which was set to 0. Values are presented as mean ± S.E. (error bars), n = 3 independent cultures. C, ERK1/2, JNK, and p38 phosphorylation levels in serum-starved NIH3T3 cells transduced with shRNA directed against mLIFR (mOSMR signaling) 10 min after cytokine stimulation. D, relative quantification of receptor activation by each cytokine; band intensities were normalized and transformed as described above. Values are presented as mean ± S.E., n = 3 independent cultures; not significant (n.s.), p > 0.05; *, p < 0.05; **, p < 0.01.
Figure 13.
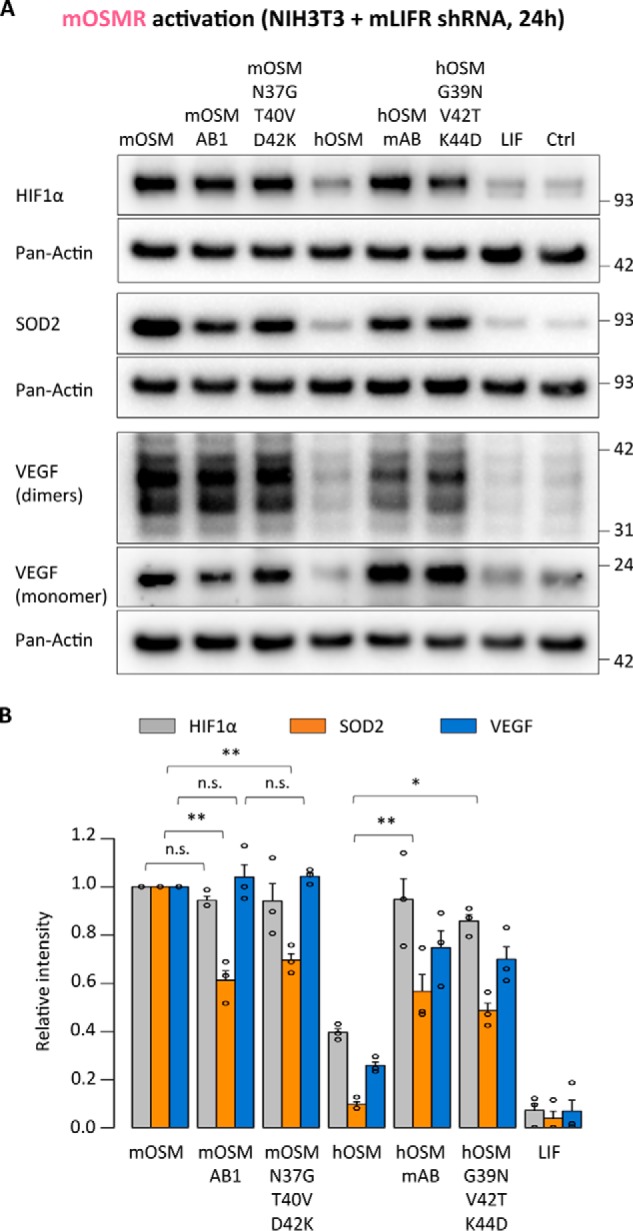
OSMR activation stimulates expression of different target genes. A, HIF1α, SOD2, and VEGF expression levels in NIH3T3 cells transduced with shRNA directed against mLIFR (mOSMR signaling) 24 h after cytokine stimulation. B, relative quantification of OSMR targets modulation by each cytokine; band intensities were normalized against pan-actin expression levels, followed by data transformation relative to the basal (Ctrl) level, which was set to 0. Values are presented as mean ± S.E. (error bars), n = 3 independent cultures; not significant (n.s.), p > 0.05; *, p < 0.05; **, p < 0.01.
Overall, the observed differences were consistent among the various signaling pathways and target genes, validating the general influence of the AB loop of OSM for determining receptor activation.
Discussion
Promiscuous activation of two different receptor complexes with high affinity is a unique characteristic of OSM within the IL-6 family (18, 34). Interaction of the human cytokine with OSMR and LIFR is mediated by OSM's BC loop and N-terminal AB loop and D-helix regions, collectively known as binding site III (13). A conserved FXXK motif in helix D of OSM is crucial for recognition of both receptors, whereas a small number of amino acids in the AB loop of hOSM were recently found to be key for hOSMR activation (13, 24).
A second defining feature of OSM is the species-specific signaling. hOSM interacts with hOSMR/gp130 and hLIFR/gp130 with high affinity, whereas mOSM combines full mOSMR/gp130 activation with only a limited ability to interact with mLIFR/gp130 (20–23). In addition, mOSM shows no cross-species reactivity with either human receptor, a characteristic also found with other murine IL-6 family members, such as mLIF and mIL-31 (19, 35, 36). In turn, hOSM is unable to signal through mOSMR but activates mLIFR/gp130, meaning that these two OSM orthologues share no high-affinity receptor complexes despite the high similarity (∼50%) (34). In contrast, hOSM and hLIF activate the LIFR with high efficiency despite more limited similarity (∼30%) at the amino acid level (37).
Here, we generated several mouse-human OSM chimeras to demonstrate a pivotal role of the cytokine's AB loop in species-dependent signaling. Our results show that introduction of the human AB loop in mOSM led to hOSMR and LIFR activation, whereas the presence of the murine loop in hOSM enabled mOSMR signaling. These findings reinforce the existence of evolutionarily selected receptor binding modules in the IL-6 family that are responsible for specific ligand–receptor interactions of this cytokine class. This model was first proposed for the LIFR-binding site III of ciliary neurotrophic factor and was later extended to the OSMR-binding site III of hOSM and the LIFR-binding site III of hLIF (24, 38).
Detailed examination of different substitutions in the mouse-human AB loop chimera identified residues Asn-37, Thr-40, and Asp-42 in mOSM as responsible for the lack of affinity toward mLIFR and the human receptors. Of these, the presence of Asn-37 might lead to significant alterations in the AB loop's secondary structure, because it replaces a Gly residue conserved in both hOSM and hLIF and critical for hOSMR activity (24). Thr is a slightly polar amino acid in place of the nonpolar residue (Val) in hOSM, whereas the positively charged Lys in the human cytokine is substituted by a negative Asp in the murine orthologue (39). hOSM acquired mOSMR signaling along with reduced hOSMR activity due to the replacement of Lys by Asp (K44D). The human Lys to murine Asp variation is also present in the IL-6 AB loop, where the Lys is assumed to contact with a negatively charged residue the human receptor interface to mediate receptor activation (40). Although we cannot offer direct experimental evidence, it appears likely that the Lys-44 residue in hOSM plays a similar role for the hOSMR. In any case, the identity of this charged residue in the OSM AB loop constitutes a clear point of divergence between the human and murine receptors.
Whereas the AB loop plays a central role in determining receptor signaling, our data suggest that additional domains influence OSM–receptor interaction. This would explain the lower levels of receptor activation in all mouse-human chimeras compared with native cytokines, in particular when assessing signaling through the human receptors. Especially intriguing is the fact that modifications in the mOSM AB loop did not lead to a large impact on mOSMR signaling, which constitutes a clear difference from hOSM. This observation suggests the existence of mOSM–mOSMR interacting regions outside the AB loop, allowing a higher degree of variability in the loop's composition before receptor activation becomes compromised.
Our results offer some new insight into the evolution of OSM. Soon after the discovery of LIF and OSM, it was proposed that both cytokines originate from the same ancestral gene through a duplication event (41–43). Given the low rate of evolutionary changes in the LIF gene compared with OSM (44), this common ancestral precursor might be much closer to LIF than to OSM. Phylogenetic inference indicates that mOSM is evolutionarily most distant from the ancestral precursor cytokine and therefore from LIF itself (Fig. 14A).
Figure 14.

Proposed model of OSM evolution. A, phylogeny inference analysis of OSM orthologues. B, proposed two-step model of OSM evolution, in which spatial rearrangements in the AB loop and D-helix initially enabled OSMR activation and acquisition of new biological function. Subsequently, point mutations in the OSM AB loop resulted in receptor and functional specialization in mice. *, This research was originally published in Journal of Biological Chemistry. Adrian-Segarra, J. M., Schindler, N., Gajawada, P., Lörchner, H., Braun, T., and Pöling, J. The AB loop and D-helix in binding site III of human Oncostatin M (OSM) are required for OSM receptor activation. J. Biol. Chem. 2018; 293:7017–7029. © Adrian-Segarra et al.
In contrast to prior hypotheses, which assume that new protein–protein interactions are preceded by interface-disrupting mutations in one of the proteins, which eventually cause adaptations of its partner (45), we propose that acquisition of new protein–protein interactions occurred via a mutation causing promiscuity. Evolution through functional promiscuity is a well-established process in the field of enzyme evolution and has been recently extended to protein–protein interactions, such as toxin–antitoxin pairs (45, 46). In fact, it might be argued that evolution will not select for nonfunctional intermediate states caused by interface-disrupting mutations. In contrast, promiscuous mutant proteins maintaining functionality at the expense of relaxed specificity might not have detrimental effects on organism fitness (45). Specificity for the new functions might eventually be attained due to the evolutionary pressures to minimize cross-talk in biological interaction networks (47, 48).
The species-dependent receptor activation profile of OSM supports this sort of evolutionary process, completing a novel model for OSM evolution (Fig. 14B). According to this concept, the first step involved acquisition of a new function (OSMR activation) by the ancestral precursor without loss of its original signaling abilities. The resulting cytokine possessed a promiscuous signaling profile similar to human or rat OSM, which strongly activates LIFR together with the OSMR (19). As previously shown by our group, this adaptation was achieved through changes in the ancestral cytokine's binding site III, exemplified by the acquisition of OSMR activity in LIF-based chimeras with modified AB loops and N-terminal D-helix regions (24). Such promiscuous proteins then tend to evolve in concert with its receptor to enhance specific signaling. In the case of OSM, only the mouse orthologue displays such specialization, attained through mutations in the AB loop that resulted in the loss of high-affinity LIFR binding, perhaps facilitated by the higher mutation rate in mice compared with humans (21, 23, 34, 49).
The presence of a second mOSM–mOSMR interaction domain outside of binding site III might have also been key in this evolutionary process, enabling the AB loop of mOSM to change to minimize LIFR signaling. Identification and comparison of additional regions of OSMR mediating ligand interaction in both species will be of great interest to further support this hypothesis. Currently, the lack of high-resolution structures for OSMR complicates matters. Co-crystallization of OSM with its receptors, or the application of cross-linking techniques coupled with mass spectrometry, might help in this regard (34, 50).
Finally, our work suggests potential practical applications, because OSMR/gp130 signaling is involved a wide array of physiological and pathological processes (34, 51). The more restricted effects of mOSM compared with other OSM orthologues have resulted in the extensive use of murine models in this field. However, the higher complexity of the human conditions (52), in which there is no specific OSMR/gp130 activator, might raise doubts about the applicability of these findings in humans. Because hOSM does not display dual-receptor activation in mice, it has not been possible to faithfully reflect human conditions in mice (21, 53). The new tools that we have generated change this scenario. We are now able to induce the same effects of OSM in mice as in humans. We assume that future studies in mice based on the use of “humanized” OSM variants will yield a much more accurate picture of the therapeutic potential of this potent cytokine.
Experimental procedures
Chimera construction and site-directed mutagenesis
Human OSM cDNA was a kind gift of Dr. Heike Hermanns (University of Würzburg), whereas human LIF cDNA (MHS6278-202857165) was purchased from Thermo Fisher Scientific. The respective gene sequences including a C-terminal His6 tag were amplified together with PacI and AscI restriction sites and cloned into a pCAG-GS vector for mammalian gene expression.
The nucleotide sequences of mouse OSM as well as the different mouse OSM-based chimeras and point mutants were codon-optimized for expression in human cells using DNAWorks (54). The resulting overlapping oligonucleotides were assembled using a nested PCR protocol (55) and cloned in a pCAG-GS vector through PacI and AscI restriction sites.
Chimeras and point mutants of human OSM were constructed by overlapping PCR, first generating the different fragments forming each chimera by the use of primers incorporating the desired mutations with overlapping regions of 30 nucleotides. These fragments were then used as templates for a second PCR to obtain the desired gene sequence flanked by PacI and AscI restriction sites and inserted into a pCAG-GS vector. All constructs were verified by DNA sequencing. For a complete list of primers used, see Table S1.
Protein expression and purification
Eukaryotic expression was performed in suspension cultures of FreeStyle 293-F cells (catalog no. R79007, Thermo Fisher Scientific) following the manufacturer's instructions. Supernatants were harvested 3 days after transfection for human OSM-based cytokines, 4 days after transfection for mouse OSM-based cytokines and 7 days after transfection for LIF-derived cytokines, and were then subjected to nickel-nitrilotriacetic acid affinity purification using standard procedures.
Cell lines
A375 cells (catalog no. 88113005) and MH-S cells (catalog no. 95090612) were purchased from the European Collection of Authenticated Cell Cultures. JAR cells (catalog no. ATCC HTB-144) were purchased from the American Type Culture Collection. HepG2 cells were a kind gift of Dr. Sarah Tonack (Max Planck Institute for Heart and Lung Research). NIH3T3 cells were a kind gift of Daniela Popescu (Max Planck Institute for Heart and Lung Research).
Lentivirus-mediated knockdown in NIH3T3 cells was achieved by using specific shRNAs against mouse LIFR included in the mouse genome-wide shRNA library generated by the RNAi consortium (56), kindly provided by Dr. Johnny Kim (Max Planck Institute for Heart and Lung Research). shRNAs were packaged into lentiviral vectors using standard methods (described in detail previously (57)). 72 h after viral transduction, NIH3T3 cells were selected by using cell culture medium supplemented with puromycin (4 μg/ml). After 1 week of selection, the surviving cells were subjected to sorting and clonal purification. Knockdown efficiency was tested for individual shRNAs by Western blot analysis, monitoring the loss of LIFR-dependent STAT3 activation in cell stimulation experiments (not shown). The clonal line with the lowest remaining LIFR activity was verified by quantitative RT-PCR using validated mLIFR primers (PrimerBank ID: 4379217a1) (58) and employed in all experiments included in this work.
Cell culture conditions and cytokine stimulations
NIH3T3, MH-S, and A375 cells were grown in DMEM, JAR cells in RPMI 1640 medium, and HepG2 cells in DMEM/F-12 medium (Gibco) with 10% fetal bovine serum, penicillin, and streptomycin (Sigma-Aldrich). The readout systems used in stimulations experiments did not require serum depletion. Cytokines were added at a final concentration of 25 ng/ml to subconfluent cells (∼80% confluent in 10-min stimulations, 60% in 24-h experiments), after which cells were returned to the 37 °C incubator (humidified atmosphere, 5% CO2) for the duration of stimulation. Proteins were harvested and processed for SDS-PAGE following standard protocols.
Immunoblots
10 μg of protein/sample were separated in NuPAGE 4–12% BisTris protein gels (Novex) and transferred into nitrocellulose membranes (Amersham Biosciences). These were probed with antibodies against phospho-STAT3 (Tyr-705) (catalog no. 9131, Cell Signaling Technology), phospho-STAT1 (Tyr-701) (catalog no. 7649, Cell Signaling Technology), phospho-STAT5 (Tyr-694) (catalog no. 9351, Cell Signaling Technology), phospho-SAP/JNK (Thr-183/Tyr-185) (catalog no. 9251, Cell Signaling Technology), phospho-ERK1/2 (Thr-202/Tyr-204) (catalog no. 9101, Cell Signaling Technology), phospho-AKT (Thr-308) (catalog no. 9275, Cell Signaling Technology), phospho-AKT (Ser-473) (catalog no. 9271, Cell Signaling Technology), phospho-SHP2 (Tyr-580) (catalog no. 3754, Cell Signaling Technology), Phospho-p38 (Thr-180/Tyr-182) (catalog. no. 9211, Cell Signaling Technology), pan-actin (catalog no. 4968, Cell Signaling Technology), human TIMP1 (catalog no. 8946, Cell Signaling Technology), mouse TIMP1 (catalog no. MAB9801, R&D Systems), HIF1α (catalog no. A300-286A, Bethyl Laboratories), SOD2 (catalog no. MAB3419, R&D Systems), VEGF 164 (catalog no. AF-493-NA, R&D Systems), total STAT3 (catalog no. 9139, Cell Signaling Technology), total STAT1 (catalog no. 9172, Cell Signaling Technology), total STAT5 (catalog no. 9310, Cell Signaling Technology), total SAP/JNK (catalog no. 9258, Cell Signaling Technology), total ERK1/2 (catalog no. 4695, Cell Signaling Technology), total AKT (catalog no. 9272, Cell Signaling Technology), total SHP2 (catalog no. 3752, Cell Signaling Technology), and total p38 (catalog no. 9212, Cell Signaling Technology). Bands were detected by employing horseradish peroxidase–conjugated secondary antibodies (R&D Systems) using the West Femto substrate (catalog no. 34095, Thermo Fisher Scientific) and a ChemiDoc MP System (Bio-Rad). Band intensity was quantified using the Image Lab software version 5.0 (Bio-Rad).
In the case of membranes reacted with phospho-STAT3 (Tyr-705), the same membrane was reblocked and probed against total STAT3. Total STAT3 levels were detected using an Alexa Fluor 680–conjugated secondary antibody (catalog no. A21057, Invitrogen) with the Odyssey® 9120 imaging system (LI-COR Biosciences) and quantified with Image Studio version 4.0.21 (LI-COR Biosciences). Membranes reacted with phospho-STAT1 (Tyr-701) and phospho-STAT5 (Tyr-694) were treated with stripping buffer (catalog no. 21059, Thermo Fisher Scientific), reblocked, and probed against total STAT1 or STAT5 levels before detecting bands through horseradish peroxidase–conjugated secondary antibodies.
Cell proliferation assays
A375 cells were seeded in 96-well cell culture plates at a density of 5000 cells/well in phenol red–free DMEM. After the addition of 10 ng/ml cytokine, cells were grown for 5 days before measuring cell proliferation using the Vybrant MTT cell proliferation assay kit (catalog no. V13154, Thermo Fisher Scientific).
Statistical analysis
Differences between the groups were assessed by means of a two-tailed Welch's t test, considering p values below 0.05 to be significant. All analyses were performed using R version 3.0.3 (the R Foundation for Statistical Computing) and RStudio version 0.98.1062 (RStudio).
Structural visualization
Protein structures were visualized with MacPymol version 1.7.2.1 (Schrödinger LLC) using available crystal structure data for human OSM (Protein Data Bank code 1EVS) and a homology model of murine OSM constructed with SWISS-MODEL (59).
Phylogeny inference
Protein sequences were retrieved from the NCBI Reference Sequence (RefSeq) database and aligned by Clustal Omega (25, 60). These aligned sequences were then employed to construct a phylogenetic tree by stochastic heuristics, applying the metapopulation genetic algorithm in MetaPIGA (61, 62).
Author contributions
J. M. A.-S., T. B., and J. P. conceptualization; J. M. A.-S. investigation; J. M. A.-S., K. S., P. G., and H. L. methodology; J. M. A.-S., T. B., and J. P. writing-original draft; J. M. A.-S., K. S., P. G., H. L., T. B., and J. P. writing-review and editing; T. B. and J. P. supervision.
Supplementary Material
Acknowledgments
We are grateful to Jutta Wetzel and Kerstin Richter for excellent technical assistance. We thank Dr. André Schneider for the gift of the pCAG-GS plasmid, Dr. Heike Hermanns (Division of Hepatology, University Hospital Würzburg) for contributing human OSM cDNA, Dr. Johnny Kim for supplying the pLKO mLIFR shRNA plasmids, Dr. Sarah Tonack for providing the HepG2 cell line, and Daniela Popescu for contributing the NIH3T3 cell line.
This work was supported by the Max Planck Society; the Excellence Initiative “Cardiopulmonary System” (ECCPS); DFG collaborative research center Pulmonary Hypertension and Core Pulmonale Grants SFB1213, TP A02, and B02; Foundation Leducq Grant 3CVD01; the German Center for Cardiovascular Research; and European Research Area Network on Cardiovascular Diseases Grant CLARIFY. The authors declare that they have no conflicts of interest with the contents of this article.
This article contains Table S1 and Figs. S1 and S2.
- IL-6
- interleukin-6
- OSM
- oncostatin M
- hOSM and mOSM
- human and mouse OSM, respectively
- LIF
- leukemia inhibitory factor
- hLIF and mLIF
- human and mouse LIF, respectively
- gp130
- glycoprotein 130
- OSMR
- oncostatin M receptor
- hOSMR and mOSMR
- human and mouse OSMR, respectively
- LIFR
- leukemia inhibitory factor receptor
- hLIFR and mLIFR
- human and mouse LIFR, respectively
- MAPK
- mitogen-activated protein kinase
- PI3K/Akt
- phosphoinositide 3-kinase/protein kinase B
- STAT
- signal transducer and activator of transcription
- P-STAT
- phosphorylated STAT
- TIMP1
- tissue inhibitor of metalloproteinase 1
- BisTris
- 2-[bis(2-hydroxyethyl)amino]-2-(hydroxymethyl)propane-1,3-diol
- JNK
- c-Jun N-terminal kinase.
References
- 1. Hirano T., Taga T., Nakano N., Yasukawa K., Kashiwamura S., Shimizu K., Nakajima K., Pyun K. H., and Kishimoto T. (1985) Purification to homogeneity and characterization of human B-cell differentiation factor (BCDF or BSFp-2). Proc. Natl. Acad. Sci. U.S.A. 82, 5490–5494 10.1073/pnas.82.16.5490 [DOI] [PMC free article] [PubMed] [Google Scholar]
- 2. Ip N. Y., Nye S. H., Boulton T. G., Davis S., Taga T., Li Y., Birren S. J., Yasukawa K., Kishimoto T., and Anderson D. J. (1992) CNTF and LIF act on neuronal cells via shared signaling pathways that involve the IL-6 signal transducing receptor component gp130. Cell 69, 1121–1132 10.1016/0092-8674(92)90634-O [DOI] [PubMed] [Google Scholar]
- 3. Gearing D. P., Comeau M. R., Friend D. J., Gimpel S. D., Thut C. J., McGourty J., Brasher K. K., King J. A., Gillis S., and Mosley B. (1992) The IL-6 signal transducer, gp130: an oncostatin M receptor and affinity converter for the LIF receptor. Science 255, 1434–1437 10.1126/science.1542794 [DOI] [PubMed] [Google Scholar]
- 4. Yin T., Taga T., Tsang M. L., Yasukawa K., Kishimoto T., and Yang Y. C. (1993) Involvement of IL-6 signal transducer gp130 in IL-11-mediated signal transduction. J. Immunol. 151, 2555–2561 [PubMed] [Google Scholar]
- 5. Pennica D., Shaw K. J., Swanson T. A., Moore M. W., Shelton D. L., Zioncheck K. A., Rosenthal A., Taga T., Paoni N. F., and Wood W. I. (1995) Cardiotrophin-1: biological activities and binding to the leukemia inhibitory factor receptor/gp130 signaling complex. J. Biol. Chem. 270, 10915–10922 10.1074/jbc.270.18.10915 [DOI] [PubMed] [Google Scholar]
- 6. Elson G. C., Lelièvre E., Guillet C., Chevalier S., Plun-Favreau H., Froger J., Suard I., de Coignac A. B., Delneste Y., Bonnefoy J. Y., Gauchat J. F., and Gascan H. (2000) CLF associates with CLC to form a functional heteromeric ligand for the CNTF receptor complex. Nat. Neurosci. 3, 867–872 10.1038/78765 [DOI] [PubMed] [Google Scholar]
- 7. Pflanz S., Hibbert L., Mattson J., Rosales R., Vaisberg E., Bazan J. F., Phillips J. H., McClanahan T. K., de Waal Malefyt R., and Kastelein R. A. (2004) WSX-1 and glycoprotein 130 constitute a signal-transducing receptor for IL-27. J. Immunol. 172, 2225–2231 10.4049/jimmunol.172.4.2225 [DOI] [PubMed] [Google Scholar]
- 8. Derouet D., Rousseau F., Alfonsi F., Froger J., Hermann J., Barbier F., Perret D., Diveu C., Guillet C., Preisser L., Dumont A., Barbado M., Morel A., deLapeyrière O., Gascan H., and Chevalier S. (2004) Neuropoietin, a new IL-6-related cytokine signaling through the ciliary neurotrophic factor receptor. Proc. Natl. Acad. Sci. U.S.A. 101, 4827–4832 10.1073/pnas.0306178101 [DOI] [PMC free article] [PubMed] [Google Scholar]
- 9. Dillon S. R., Sprecher C., Hammond A., Bilsborough J., Rosenfeld-Franklin M., Presnell S. R., Haugen H. S., Maurer M., Harder B., Johnston J., Bort S., Mudri S., Kuijper J. L., Bukowski T., Shea P., et al. (2004) Interleukin 31, a cytokine produced by activated T cells, induces dermatitis in mice. Nat. Immunol. 5, 752–760 10.1038/ni1084 [DOI] [PubMed] [Google Scholar]
- 10. Bazan J. F. (1990) Haemopoietic receptors and helical cytokines. Immunol. Today 11, 350–354 10.1016/0167-5699(90)90139-Z [DOI] [PubMed] [Google Scholar]
- 11. Robinson R. C., Grey L. M., Staunton D., Vankelecom H., Vernallis A. B., Moreau J. F., Stuart D. I., Heath J. K., and Jones E. Y. (1994) The crystal structure and biological function of leukemia inhibitory factor: implications for receptor binding. Cell 77, 1101–1116 10.1016/0092-8674(94)90449-9 [DOI] [PubMed] [Google Scholar]
- 12. McDonald N. Q., Panayotatos N., and Hendrickson W. A. (1995) Crystal structure of dimeric human ciliary neurotrophic factor determined by MAD phasing. EMBO J. 14, 2689–2699 10.1002/j.1460-2075.1995.tb07269.x [DOI] [PMC free article] [PubMed] [Google Scholar]
- 13. Deller M. C., Hudson K. R., Ikemizu S., Bravo J., Jones E. Y., and Heath J. K. (2000) Crystal structure and functional dissection of the cytostatic cytokine oncostatin M. Structure 8, 863–874 10.1016/S0969-2126(00)00176-3 [DOI] [PubMed] [Google Scholar]
- 14. Heinrich P. C., Behrmann I., Müller-Newen G., Schaper F., and Graeve L. (1998) Interleukin-6-type cytokine signalling through the gp130/Jak/STAT pathway. Biochem. J. 334, 297–314 10.1042/bj3340297 [DOI] [PMC free article] [PubMed] [Google Scholar]
- 15. Heinrich P. C., Behrmann I., Haan S., Hermanns H. M., Müller-Newen G., and Schaper F. (2003) Principles of interleukin (IL)-6-type cytokine signalling and its regulation. Biochem. J. 374, 1–20 10.1042/bj20030407 [DOI] [PMC free article] [PubMed] [Google Scholar]
- 16. Shields D. C., Harmon D. L., Nunez F., and Whitehead A. S. (1995) The evolution of haematopoietic cytokine/receptor complexes. Cytokine 7, 679–688 10.1006/cyto.1995.0080 [DOI] [PubMed] [Google Scholar]
- 17. Liongue C., and Ward A. C. (2007) Evolution of Class I cytokine receptors. BMC Evol. Biol. 7, 120 10.1186/1471-2148-7-120 [DOI] [PMC free article] [PubMed] [Google Scholar]
- 18. Mosley B., De Imus C., Friend D., Boiani N., Thoma B., Park L. S., and Cosman D. (1996) Dual oncostatin M (OSM) receptors: cloning and characterization of an alternative signaling subunit conferring OSM-specific receptor activation. J. Biol. Chem. 271, 32635–32643 10.1074/jbc.271.51.32635 [DOI] [PubMed] [Google Scholar]
- 19. Drechsler J., Grötzinger J., and Hermanns H. M. (2012) Characterization of the rat oncostatin M receptor complex which resembles the human, but differs from the murine cytokine receptor. PLoS One 7, e43155 10.1371/journal.pone.0043155 [DOI] [PMC free article] [PubMed] [Google Scholar]
- 20. Ichihara M., Hara T., Kim H., Murate T., and Miyajima A. (1997) Oncostatin M and leukemia inhibitory factor do not use the same functional receptor in mice. Blood 90, 165–173 [PubMed] [Google Scholar]
- 21. Lindberg R. A., Juan T. S., Welcher A. A., Sun Y., Cupples R., Guthrie B., and Fletcher F. A. (1998) Cloning and characterization of a specific receptor for mouse oncostatin M. Mol. Cell. Biol. 18, 3357–3367 10.1128/MCB.18.6.3357 [DOI] [PMC free article] [PubMed] [Google Scholar]
- 22. Walker E. C., McGregor N. E., Poulton I. J., Solano M., Pompolo S., Fernandes T. J., Constable M. J., Nicholson G. C., Zhang J.-G., Nicola N. A., Gillespie M. T., Martin T. J., and Sims N. A. (2010) Oncostatin M promotes bone formation independently of resorption when signaling through leukemia inhibitory factor receptor in mice. J. Clin. Invest. 120, 582–592 10.1172/JCI40568 [DOI] [PMC free article] [PubMed] [Google Scholar]
- 23. Walker E. C., Johnson R. W., Hu Y., Brennan H. J., Poulton I. J., Zhang J.-G., Jenkins B. J., Smyth G. K., Nicola N. A., and Sims N. A. (2016) Murine oncostatin M acts via leukemia inhibitory factor receptor to phosphorylate signal transducer and activator of transcription 3 (STAT3) but not STAT1, an effect that protects bone mass. J. Biol. Chem. 291, 21703–21716 10.1074/jbc.M116.748483 [DOI] [PMC free article] [PubMed] [Google Scholar]
- 24. Adrian-Segarra J. M., Schindler N., Gajawada P., Lörchner H., Braun T., and Pöling J. (2018) The AB loop and D-helix in binding site III of human Oncostatin M (OSM) are required for OSM receptor activation. J. Biol. Chem. 293, 7017–7029 10.1074/jbc.RA118.001920 [DOI] [PMC free article] [PubMed] [Google Scholar]
- 25. Sievers F., Wilm A., Dineen D., Gibson T. J., Karplus K., Li W., Lopez R., McWilliam H., Remmert M., Söding J., Thompson J. D., and Higgins D. G. (2011) Fast, scalable generation of high-quality protein multiple sequence alignments using Clustal Omega. Mol. Syst. Biol. 7, 539 [DOI] [PMC free article] [PubMed] [Google Scholar]
- 26. Kallestad J. C., Shoyab M., and Linsley P. S. (1991) Disulfide bond assignment and identification of regions required for functional activity of oncostatin M. J. Biol. Chem. 266, 8940–8945 [PubMed] [Google Scholar]
- 27. Wang Y., Robledo O., Kinzie E., Blanchard F., Richards C., Miyajima A., and Baumann H. (2000) Receptor subunit-specific action of oncostatin M in hepatic cells and its modulation by leukemia inhibitory factor. J. Biol. Chem. 275, 25273–25285 10.1074/jbc.M002296200 [DOI] [PubMed] [Google Scholar]
- 28. Hermanns H. M., Radtke S., Haan C., Schmitz-Van de Leur H., Tavernier J., Heinrich P. C., and Behrmann I. (1999) Contributions of leukemia inhibitory factor receptor and oncostatin M receptor to signal transduction in heterodimeric complexes with glycoprotein 130. J. Immunol. 163, 6651–6658 [PubMed] [Google Scholar]
- 29. Richards C. D., Shoyab M., Brown T. J., and Gauldie J. (1993) Selective regulation of metalloproteinase inhibitor (TIMP-1) by oncostatin M in fibroblasts in culture. J. Immunol. 150, 5596–5603 [PubMed] [Google Scholar]
- 30. Sadowski H. B., Shuai K., Darnell J. E. Jr., and Gilman M. Z. (1993) A common nuclear signal transduction pathway activated by growth factor and cytokine receptors. Science 261, 1739–1744 10.1126/science.8397445 [DOI] [PubMed] [Google Scholar]
- 31. Vollmer S., Kappler V., Kaczor J., Flügel D., Rolvering C., Kato N., Kietzmann T., Behrmann I., and Haan C. (2009) Hypoxia-inducible factor 1α is up-regulated by oncostatin M and participates in oncostatin M signaling. Hepatology 50, 253–260 10.1002/hep.22928 [DOI] [PubMed] [Google Scholar]
- 32. Negoro S., Kunisada K., Fujio Y., Funamoto M., Darville M. I., Eizirik D. L., Osugi T., Izumi M., Oshima Y., Nakaoka Y., Hirota H., Kishimoto T., and Yamauchi-Takihara K. (2001) Activation of signal transducer and activator of transcription 3 protects cardiomyocytes from hypoxia/reoxygenation-induced oxidative stress through the upregulation of manganese superoxide dismutase. Circulation 104, 979–981 10.1161/hc3401.095947 [DOI] [PubMed] [Google Scholar]
- 33. Vasse M., Pourtau J., Trochon V., Muraine M., Vannier J. P., Lu H., Soria J., and Soria C. (1999) Oncostatin M induces angiogenesis in vitro and in vivo. Arterioscler. Thromb. Vasc. Biol. 19, 1835–1842 10.1161/01.ATV.19.8.1835 [DOI] [PubMed] [Google Scholar]
- 34. Hermanns H. M. (2015) Oncostatin M and interleukin-31: cytokines, receptors, signal transduction and physiology. Cytokine Growth Factor Rev. 26, 545–558 10.1016/j.cytogfr.2015.07.006 [DOI] [PubMed] [Google Scholar]
- 35. Layton M. J., Owczarek C. M., Metcalf D., Clark R. L., Smith D. K., Treutlein H. R., and Nicola N. A. (1994) Conversion of the biological specificity of murine to human leukemia inhibitory factor by replacing 6 amino acid residues. J. Biol. Chem. 269, 29891–29896 [PubMed] [Google Scholar]
- 36. Broxmeyer H. E., Li J., Hangoc G., Cooper S., Tao W., Mantel C., Graham-Evans B., Ghilardi N., and de Sauvage F. J. (2007) Regulation of myeloid progenitor cell proliferation/survival by IL-31 receptor and IL-31. Exp. Hematol. 35, 78–86 10.1016/j.exphem.2007.01.028 [DOI] [PMC free article] [PubMed] [Google Scholar]
- 37. Rose T. M., and Bruce A. G. (1991) Oncostatin M is a member of a cytokine family that includes leukemia-inhibitory factor, granulocyte colony-stimulating factor, and interleukin 6. Proc. Natl. Acad. Sci. U.S.A. 88, 8641–8645 10.1073/pnas.88.19.8641 [DOI] [PMC free article] [PubMed] [Google Scholar]
- 38. Kallen K. J., Grötzinger J., Lelièvre E., Vollmer P., Aasland D., Renné C., Müllberg J., Myer zum Büschenfelde K. H., Gascan H., and Rose-John S. (1999) Receptor recognition sites of cytokines are organized as exchangeable modules: transfer of the leukemia inhibitory factor receptor-binding site from ciliary neurotrophic factor to interleukin-6. J. Biol. Chem. 274, 11859–11867 10.1074/jbc.274.17.11859 [DOI] [PubMed] [Google Scholar]
- 39. Betts M. J., and Russell R. B. (eds) (2003) Amino acid properties and consequences of substitutions. In Bioinformatics for Geneticists, pp. 289–316, John Wiley & Sons, Ltd., Chichester, UK [Google Scholar]
- 40. Ehlers M., Grötzinger J., Fischer M., Bos H. K., Brakenhoff J. P., and Rose-John S. (1996) Identification of single amino acid residues of human IL-6 involved in receptor binding and signal initiation. J. Interferon Cytokine Res. 16, 569–576 10.1089/jir.1996.16.569 [DOI] [PubMed] [Google Scholar]
- 41. Rose T. M., Lagrou M. J., Fransson I., Werelius B., Delattre O., Thomas G., de Jong P. J., Todaro G. J., and Dumanski J. P. (1993) The genes for oncostatin M (OSM) and leukemia inhibitory factor (LIF) are tightly linked on human chromosome 22. Genomics 17, 136–140 10.1006/geno.1993.1294 [DOI] [PubMed] [Google Scholar]
- 42. Jeffery E., Price V., and Gearing D. P. (1993) Close proximity of the genes for leukemia inhibitory factor and oncostatin M. Cytokine 5, 107–111 10.1016/1043-4666(93)90048-A [DOI] [PubMed] [Google Scholar]
- 43. Giovannini M., Djabali M., McElligott D., Selleri L., and Evans G. A. (1993) Tandem linkage of genes coding for leukemia inhibitory factor (LIF) and oncostatin M (OSM) on human chromosome 22. Cytogenet. Cell Genet. 64, 240–244 10.1159/000133586 [DOI] [PubMed] [Google Scholar]
- 44. Hanington P. C., and Belosevic M. (2007) Interleukin-6 family cytokine M17 induces differentiation and nitric oxide response of goldfish (Carassius auratus L.) macrophages. Dev. Comp. Immunol. 31, 817–829 10.1016/j.dci.2006.12.001 [DOI] [PubMed] [Google Scholar]
- 45. Aakre C. D., Herrou J., Phung T. N., Perchuk B. S., Crosson S., and Laub M. T. (2015) Evolving new protein-protein interaction specificity through promiscuous intermediates. Cell 163, 594–606 10.1016/j.cell.2015.09.055 [DOI] [PMC free article] [PubMed] [Google Scholar]
- 46. Khersonsky O., and Tawfik D. S. (2010) Enzyme promiscuity: a mechanistic and evolutionary perspective. Annu. Rev. Biochem. 79, 471–505 10.1146/annurev-biochem-030409-143718 [DOI] [PubMed] [Google Scholar]
- 47. Capra E. J., Perchuk B. S., Skerker J. M., and Laub M. T. (2012) Adaptive mutations that prevent crosstalk enable the expansion of paralogous signaling protein families. Cell 150, 222–232 10.1016/j.cell.2012.05.033 [DOI] [PMC free article] [PubMed] [Google Scholar]
- 48. Zarrinpar A., Park S.-H., and Lim W. A. (2003) Optimization of specificity in a cellular protein interaction network by negative selection. Nature 426, 676–680 10.1038/nature02178 [DOI] [PubMed] [Google Scholar]
- 49. Milholland B., Dong X., Zhang L., Hao X., Suh Y., and Vijg J. (2017) Differences between germline and somatic mutation rates in humans and mice. Nat. Commun. 8, 15183 10.1038/ncomms15183 [DOI] [PMC free article] [PubMed] [Google Scholar]
- 50. Rappsilber J., Siniossoglou S., Hurt E. C., and Mann M. (2000) A generic strategy to analyze the spatial organization of multi-protein complexes by cross-linking and mass spectrometry. Anal. Chem. 72, 267–275 10.1021/ac991081o [DOI] [PubMed] [Google Scholar]
- 51. Richards C. D. (2013) The enigmatic cytokine oncostatin M and roles in disease. ISRN Inflamm. 2013, 512103 [DOI] [PMC free article] [PubMed] [Google Scholar]
- 52. Seok J., Warren H. S., Cuenca A. G., Mindrinos M. N., Baker H. V., Xu W., Richards D. R., McDonald-Smith G. P., Gao H., Hennessy L., Finnerty C. C., López C. M., Honari S., Moore E. E., Minei J. P., et al. (2013) Genomic responses in mouse models poorly mimic human inflammatory diseases. Proc. Natl. Acad. Sci. U.S.A. 110, 3507–3512 10.1073/pnas.1222878110 [DOI] [PMC free article] [PubMed] [Google Scholar]
- 53. Juan T. S., Bolon B., Lindberg R. A., Sun Y., Van G., and Fletcher F. A. (2009) Mice overexpressing murine oncostatin M (OSM) exhibit changes in hematopoietic and other organs that are distinct from those of mice overexpressing human OSM or bovine OSM. Vet. Pathol. 46, 124–137 10.1354/vp.46-1-124 [DOI] [PubMed] [Google Scholar]
- 54. Hoover D. M., and Lubkowski J. (2002) DNAWorks: an automated method for designing oligonucleotides for PCR-based gene synthesis. Nucleic Acids Res. 30, e43 10.1093/nar/30.10.e43 [DOI] [PMC free article] [PubMed] [Google Scholar]
- 55. Varadarajan N., Cantor J. R., Georgiou G., and Iverson B. L. (2009) Construction and flow cytometric screening of targeted enzyme libraries. Nat. Protoc. 4, 893–901 10.1038/nprot.2009.60 [DOI] [PubMed] [Google Scholar]
- 56. Root D. E., Hacohen N., Hahn W. C., Lander E. S., and Sabatini D. M. (2006) Genome-scale loss-of-function screening with a lentiviral RNAi library. Nat. Methods 3, 715–719 10.1038/nmeth924 [DOI] [PubMed] [Google Scholar]
- 57. Sreenivasan K., Braun T., and Kim J. (2017) Systematic identification of genes regulating muscle stem cell self-renewal and differentiation. Methods Mol. Biol. 1556, 343–353 10.1007/978-1-4939-6771-1_19 [DOI] [PubMed] [Google Scholar]
- 58. Spandidos A., Wang X., Wang H., and Seed B. (2010) PrimerBank: a resource of human and mouse PCR primer pairs for gene expression detection and quantification. Nucleic Acids Res. 38, D792–D799 10.1093/nar/gkp1005 [DOI] [PMC free article] [PubMed] [Google Scholar]
- 59. Biasini M., Bienert S., Waterhouse A., Arnold K., Studer G., Schmidt T., Kiefer F., Gallo Cassarino T., Bertoni M., Bordoli L., and Schwede T. (2014) SWISS-MODEL: modelling protein tertiary and quaternary structure using evolutionary information. Nucleic Acids Res. 42, W252–W258 10.1093/nar/gku340 [DOI] [PMC free article] [PubMed] [Google Scholar]
- 60. Maglott D. R., Katz K. S., Sicotte H., and Pruitt K. D. (2000) NCBI's LocusLink and RefSeq. Nucleic Acids Res. 28, 126–128 10.1093/nar/28.1.126 [DOI] [PMC free article] [PubMed] [Google Scholar]
- 61. Lemmon A. R., and Milinkovitch M. C. (2002) The metapopulation genetic algorithm: an efficient solution for the problem of large phylogeny estimation. Proc. Natl. Acad. Sci. U.S.A. 99, 10516–10521 10.1073/pnas.162224399 [DOI] [PMC free article] [PubMed] [Google Scholar]
- 62. Helaers R., and Milinkovitch M. C. (2010) MetaPIGA v2.0: maximum likelihood large phylogeny estimation using the metapopulation genetic algorithm and other stochastic heuristics. BMC Bioinformatics 11, 379 10.1186/1471-2105-11-379 [DOI] [PMC free article] [PubMed] [Google Scholar]
Associated Data
This section collects any data citations, data availability statements, or supplementary materials included in this article.