Abstract
Epigenetic alterations play an important role in the pathogenesis in multiple myeloma, but their biological and clinical relevance is not fully understood. Here, we show that DOT1L, which catalyzes methylation of histone H3 lysine 79, is required for myeloma cell survival. DOT1L expression levels were higher in monoclonal gammopathy of undetermined significance and smoldering multiple myeloma than in normal plasma cells. Treatment with a DOT1L inhibitor induced cell cycle arrest and apoptosis in myeloma cells, and strongly suppressed cell proliferation in vitro. The anti-myeloma effect of DOT1L inhibition was confirmed in a mouse xenograft model. Chromatin immunoprecipitation-sequencing and microarray analysis revealed that DOT1L inhibition downregulated histone H3 lysine 79 dimethylation and expression of IRF4-MYC signaling genes in myeloma cells. In addition, DOT1L inhibition upregulated genes associated with immune responses and interferon signaling. Myeloma cells with histone modifier mutations or lower IRF4/MYC expression were less sensitive to DOT1L inhibition, but with prolonged treatment, anti-proliferative effects were achieved in these cells. Our data suggest that DOT1L plays an essential role in the development of multiple myeloma and that DOT1L inhibition may provide new therapies for myeloma treatment.
Introduction
Multiple myeloma (MM) is a genetically complex disorder caused by monoclonal proliferation of abnormal plasma cells. MM accounts for 1% of all cancers and 10% of hematologic malignancies in the United States, and there are 101,000 deaths per year caused by MM around the world.1 Despite development of a variety of new therapeutic agents, including proteasome inhibitors, immunomodulatory drugs, monoclonal antibodies and histone deacetylase inhibitors, MM remains an incurable disorder.2
Epigenetic alterations such as aberrant DNA methylation and histone modification play key roles in the pathogenesis of MM and are thought to be potential therapeutic targets.3,4 For instance, the histone deacetylase (HDAC) inhibitor panobinostat reportedly exerts synergistic anti-myeloma effects when combined with bortezomib and dexamethasone, yielding a complete or near complete response in 27.6% of patients with relapsed or relapsed and refractory MM.5 Notably, HDAC inhibitors appear to affect a wide variety of non-histone proteins in addition to histones, exerting anti-myeloma effects that include upregulation of CDKN1A and disruption of aggresomes.6 Methylation of histone lysine residues is a major epigenetic mechanism by which chromatin organization and gene expression are regulated.7 For instance, methylation of histone H3 lysine 4 (H3K4), H3K36 and H3K79 is asso ciated with active transcription, while methylation of H3K9 and H3K27 are well known to be repressive marks.7,8 Moreover, dysregulation of histone methylation appears to be involved in the pathogenesis of MM. Mutations in genes encoding the histone modifiers H3K27 demethylase UTX (also known as KDM6A); H3K4 methyltransferases MLL, MLL2, and MLL3; H3K9 methyltransferase G9a (also known as EHMT2); and H3K36 methyltransferase MMSET (also known as WHSC1 or NSD2) have been detected in MM.9,10 MMSET is overexpressed in MM with t(4;14), which leads to a global accumulation of H3K36 dimethylation (H3K36me2) and reduction of H3K27me3.11 EZH2 is also reportedly overexpressed in MM, is associated with a poor prognosis, and is considered a potential therapeutic target.12,13 In the present study, we aimed to examine the pathological and therapeutic implications of histone methylation in MM.
Methods
Cell lines and clinical specimens
MM cell lines (RPMI-8226, MM.1S, KMS-11, KMS-12BM, KMS-12PE and U-266) were obtained and cultured as described previously.14 All cell lines were authenticated using short tandem repeat analysis performed by JCRB (Tokyo, Japan) or BEX (Tokyo, Japan) between 2015 and 2017. Total RNA and genomic DNA were extracted using RNeasy Mini Kits (Qiagen, Hilden, Germany) and QIAamp DNA Mini Kits (Qiagen) according to the manufacturer’s instructions. Specimens of bone marrow or peripheral blood were respectively collected from MM or plasma cell leukemia (PCL) patients, after which CD138-positive cells were isolated using a MACS manual cell separator (Miltenyi Biotec, Bergisch Gladbach, Germany). CD138-positive cells were cultured for 24 hours in RPMI-1640 medium supplemented with 20% fetal bovine serum (FBS) and 1% penicillin/streptomycin/amphotericin B, after which drug treatment and cell viability assays were performed. This study was performed in accordance with the Declaration of Helsinki and was approved by the Institutional Review Board of Sapporo Medical University. Informed consent was obtained from all patients before specimen collection.
Reagents
The H3K4 methyltransferase LSD1 inhibitor S2101 was purchased from Merck Millipore (Burlington, MA, USA). The LSD1 inhibitor GSK2879552, H3K27 methyltransferase EZH2 inhibitor GSK126, and H3K79 methyltransferase DOT1L inhibitor EPZ-5676 were all purchased from Chemietek (Indianapolis, IN, USA). The H3K9 methyltransferase G9a inhibitor UNC0638, H3K27 demethylase JMJD3/UTX inhibitor GSKJ1, DOT1L inhibitor SGC0946, and MYC inhibitor 10058-F4 were all purchased from Sigma-Aldrich (St. Louis, MO, USA).
Drug treatment and cell viability assay
To screen for anti-proliferative effects of histone methyltransferase or demethylase inhibitors, MM cell lines (3×10⁴ to 1×10⁵ cells/well in 6-well plate) were treated with the respective drugs at a concentration of 1 mM or with DMSO for up to 14 days, refreshing the medium and drugs every 3 to 4 days. Cell viabilities were assessed on days 3-4 and 11-14 using a Cell Counting Kit-8 (Dojindo, Kumamoto, Japan) and a microplate reader (Model 680; Bio-Rad, Hercules, CA, USA) according to the manufacturer’s instructions. To further analyze the effect of DOT1L inhibitors, MM cell lines (2×10⁴ to 8×10⁴ cells/well in 6-well plate) or patient-derived CD138-positive cells (1.3×10⁵ to 3×10⁵ cells/well in 6-well plate) were treated with the respective inhibitors at 0.25-1 mM or with DMSO for up to 18 days, refreshing the medium and drug every 3 days.
Xenograft studies
For xenograft studies, we used the ex vivo drug pre-treatment method.15,16 RPMI-8226 cells were pre-treated for 3 days with 1 mM SGC0946 or EPZ-5676 or with DMSO, after which 1×10⁷ cells were suspended in 200 ml of RPMI-1640 medium and subcutaneously injected into the bilateral thighs of 6-week-old C.B-17 SCID mice. Tumor size was measured every 3 days using digital calipers, and tumor volume was calculated using the formula, length × width2/2. All animal experiments were conducted in compliance with the protocol approved by the Institutional Animal Care and Use Committee of Sapporo Medical University.
Results
DOT1L is a potential therapeutic target in MM
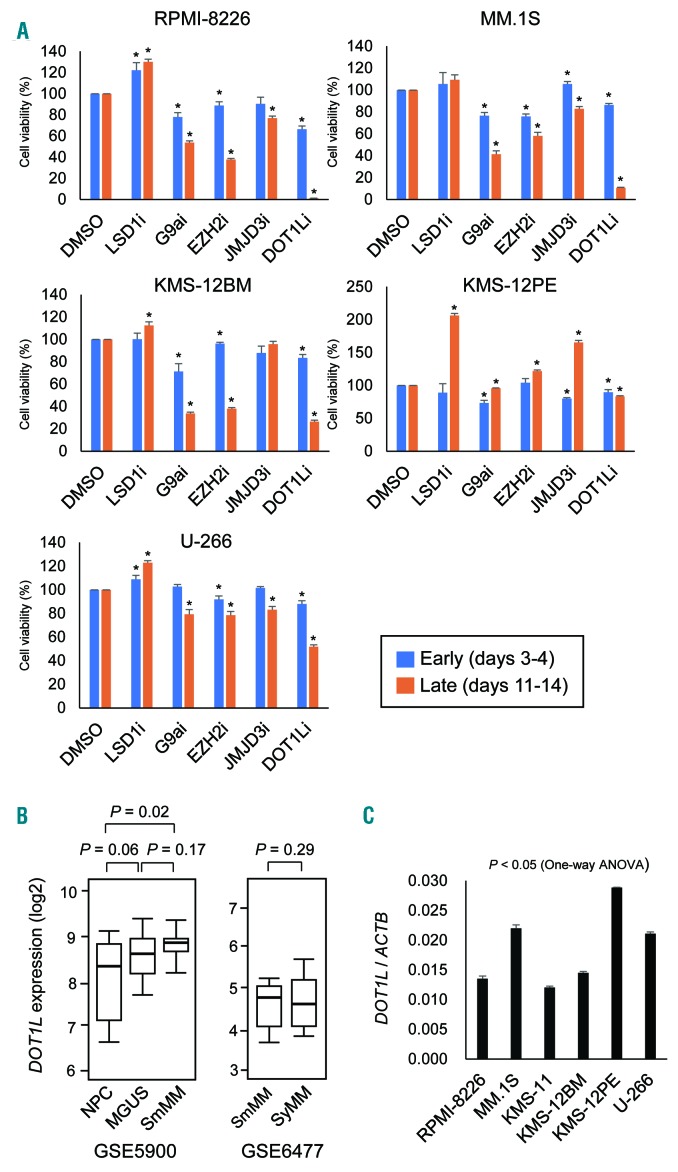
To determine whether histone methylation modifiers could be useful therapeutic targets in MM, we first tested the effects of the following compounds on proliferation of MM cell lines: the LSD1 inhibitors S2101 and GSK2879552, the G9a inhibitor UNC0638, the EZH2 inhibitor GSK126, the JMJD3 inhibitor GSKJ1 and the DOT1L inhibitor SGC0946 (Figure 1A). Five MM cell lines were treated with the drugs (1 μM) for up to 14 days, and cell viabilities were assessed early (days 3-4) and late (days 11-14) during the treatment. We found that inhibitors of G9a, EZH2 and DOT1L each moderately suppressed proliferation of more than 2 MM cell lines at the early times (Figure 1A). Longer treatment with these drugs led to stronger growth suppressive effects in most of the MM cell lines, though not in KMS-12PE cells (Figure 1A). By contrast, the LSD1 inhibitors were less effective. We tested 2 LSD1 inhibitors (S2101 for KMS-12BM and MM.1S cells and GSK2879552 for RPMI-8226, KMS-12PE and U-266 cells), but neither suppressed MM cell proliferation and appeared to even promote it in most cases (Figure 1A). Among them, we selected DOT1L for further analysis, because its inhibition had a strong anti-proliferative effect.
Figure 1.
Identification of DOT1L as a potential therapeutic target in MM. (A) Effects of inhibitors of histone methylation modifiers on MM cell proliferation. Shown are summarized results of cell viability assays in MM cell lines treated with the indicated drugs (1 mM) at early and late times. Results are normalized to cells treated with DMSO. The data are presented as means of 5 replications; error bars represent standard errors of means (SEMs). Statistical analyses compared cells treated with DMSO and those treated with the indicated drugs using t-tests (unpaired, two-sided). * P<0.05. (B) Comparison of DOT1L mRNA expression among normal plasma cells (NPC, n=22), monoclonal gammopathy of undetermined significance (MGUS, n=44), and smoldering multiple myeloma (SmMM, n=12) (left) and between SmMM (n=24) and symptomatic MM (SyMM, n=69) (right) using the indicated datasets. (C) qRT-PCR analysis of DOT1L in the indicated MM cell lines. Results are normalized to ACTB expression. Shown are means of 3 replications; error bars represent standard errors of means (SEMs).
Analysis using published data sets revealed that expression of DOT1L is increased during the progression from normal plasma cells (NPCs) to monoclonal gammopathy of undetermined significance (MGUS) and smoldering multiple myeloma (SmMM) (Figure 1B). By contrast, we detected no significant difference in the levels of DOT1L expression between SmMM and symptomatic MM (SyMM) (Figure 1B). qRT-PCR showed that DOT1L is expressed at various levels in the MM cell lines tested, irrespective of their sensitivity to the DOT1L inhibitor (Figure 1C).
DOT1L inhibitors induce growth suppression, cell cycle arrest and apoptosis in MM cells
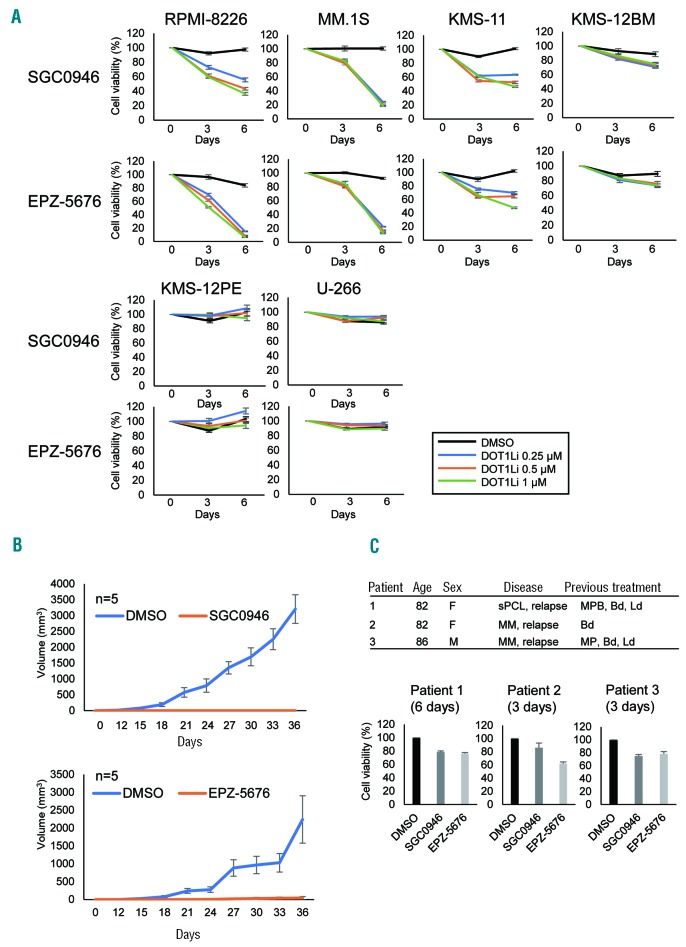
To further evaluate the therapeutic potential of DOT1L inhibition in MM, we treated MM cell lines with two DOT1L inhibitors, SGC0946 and EPZ-5676. Western blot analysis using an antibody specific for mono-, di-, and trimethylated H3K79 (H3K79me1/me2/me3) showed that treatment with either drug (1 mM, 3 days) significantly reduced levels of H3K79me1/me2/me3 in RPMI-8226 cells (Online Supplementary Figure S1) and strongly suppressed proliferation of RPMI-8226, MM.1S, KMS-11 and KMS-12BM cells (Figure 2A). That the drugs were acting through DOT1L inhibition was confirmed by the finding that shRNA-mediated DOT1L knockdown moderately suppressed MM cell proliferation (Online Supplementary Figure S2). On the other hand, DOT1L inhibitors were less effective or ineffective in KMS-12PE and U-266 cells (Figure 2A). Moreover, ex vivo treatment with SGC0946 or EPZ-5676 strongly suppressed tumor formation by MM cells in SCID mice (Figure 2B, Online Supplementary Figure S3). To evaluate the effects of DOT1L inhibitors in primary tumors, we isolated CD138-positive cells from MM and PCL patients. We found that both drugs moderately suppressed the viability of primary tumor cells (Figure 2C).
Figure 2.
Antitumor effects of DOT1L inhibitors in MM. (A) Results of cell viability assays in MM cell lines treated with the indicated concentrations of DOT1L inhibitors. Results are normalized to untreated cells. Shown are means of 3 replications; error bars represent SEMs. (B) Tumor growth in mice injected with RPMI-8226 cells pretreated with SGC0946 or EPZ-5676 (left thigh) or DMSO (right thigh). Growth curves are means of 5 replicates; error bars represent SEMs. (C) Results of cell viability assays in primary tumor cells. CD138-positive cells isolated from MM or PCL patients were treated with DOT1L inhibitors (1 μM) for the indicated periods. A summary of the patients is at the top. Shown are means of 3-6 replications; error bars represent SEMs. sPCL: secondary plasma cell leukemia; MPB: Melphalan + Prednisolone + Bortezomib; Bd: Bortezomib + Dexamethasone; Ld: Lenalidomide + Dexamethasone; MP: Melphalan + Prednisolone.
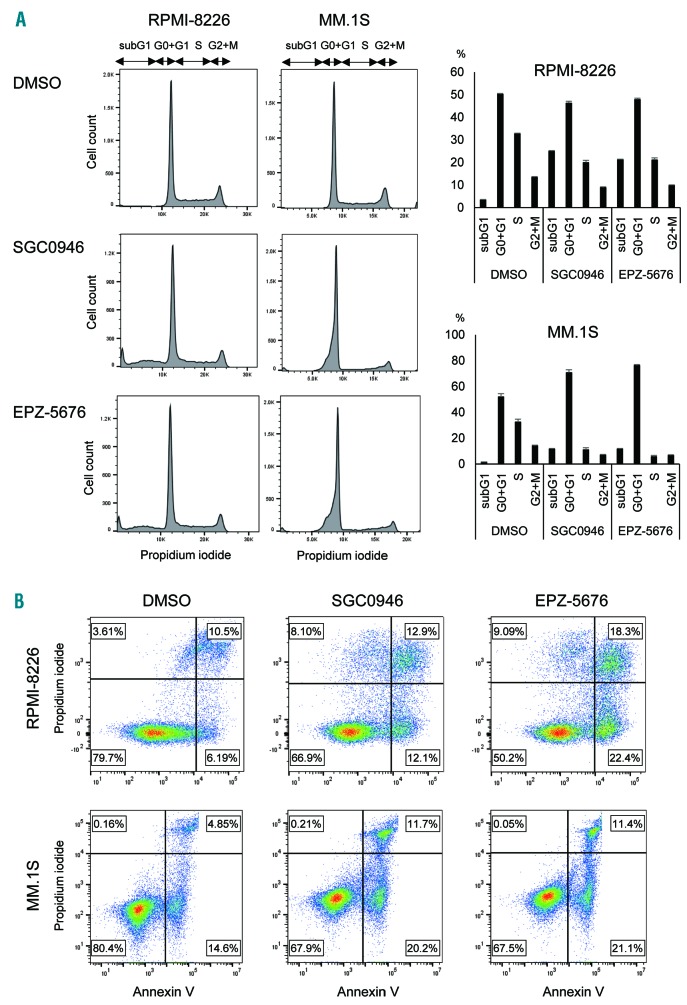
Cell cycle analysis using flow cytometry revealed that treatment with SGC0946 (1 mM, 6 days) or EPZ-5676 (1 mM, 6 days) led to increases in sub-G1 and G0-G1 phase populations and decreases in S phase populations in RPMI-8226 and MM.1S cells, which suggests DOT1L inhibition induces G1-S arrest and apoptosis (Figure 3A). Induction of apoptosis by DOT1L inhibitors was confirmed using Annexin V staining assays (Figure 3B, Online Supplementary Figure S4). Cell cycle and apoptosis were also analyzed at an earlier time point (3 days), and similar results were observed in RPMI-8226 cells (Online Supplementary Figure S5). By contrast, induction of cell cycle arrest and apoptosis were relatively limited in MM.1S cells at this time point, which is consistent with the results of the cell viability assays (Online Supplementary Figure S5, Figure S2A).
Figure 3.
Effects of DOT1L inhibitors on cell cycle and apoptosis in MM cells. (A) Results of cell cycle analysis in MM cells treated with the indicated DOT1L inhibitors (1mM, 6 days). Representative results are shown on the left. Summarized results of 3 replications are shown on the right; error bars represent SEMs. (B) Results of apoptosis assays in MM cell lines treated with the indicated DOT1L inhibitors (1mM, 6 days). The results were confirmed in at least 3 independent experiments, and representative results are shown (also see Online Supplementary Figure S4).
DOT1L inhibitors suppress IRF4 and MYC signaling in MM cells
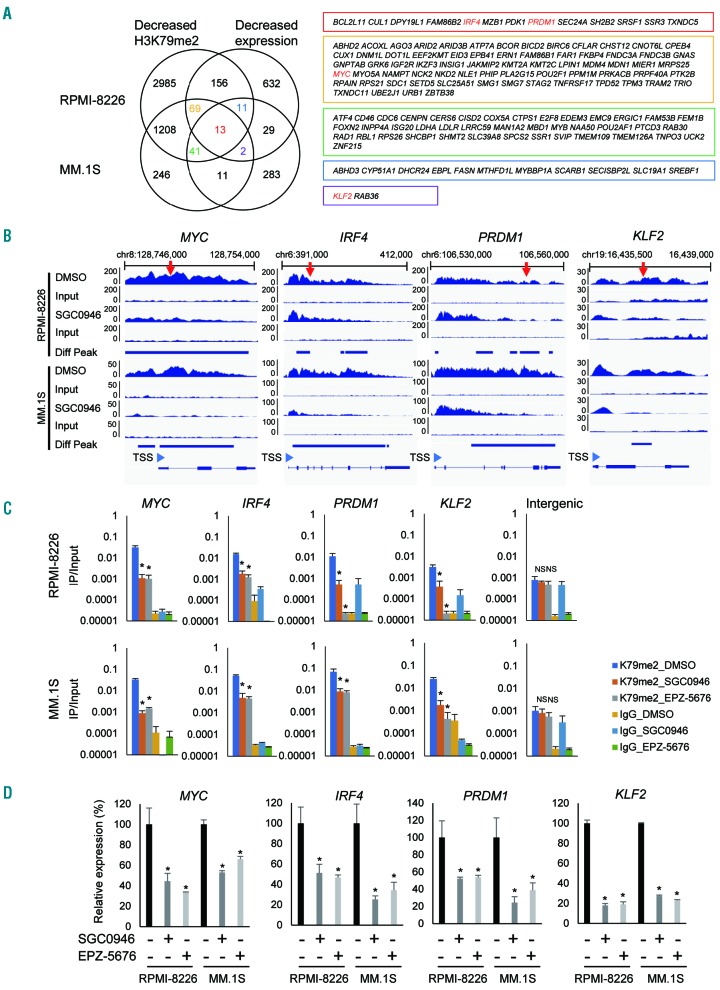
To clarify the molecular mechanism underlying the antitumor effects of DOT1L inhibition, we next analyzed H3K79me2 levels and gene expression status in MM cells. Earlier studies showed that 2 to 3 days of DOT1L inhibition resulted in evident depletion of H3K79me2 in tumor cells, while mRNA expression of target genes was signifi cantly reduced after 6 to 7 days of treatment.17,18 We therefore performed ChIP-seq analysis of H3K79me2 in RPMI-8226 and MM.1S cells treated for 3 days with 1 mM SGC0946 or with DMSO, and gene expression microarray analysis with cells treated with the drug for 6 days. ChIP-seq analyses of RPMI-8226 and MM.1S cells respectively identified 4483 and 1590 genes at which H3K79me2 levels were significantly reduced by DOT1L inhibition (Figure 4A, Online Supplementary Tables S1 and S2). Microarray analysis revealed that expression of 912 and 390 genes were downregulated (> 1.5-fold) by SGC0946 in these cells (Online Supplementary Tables S3 and S4). Collectively, we identified 249 genes in RPMI-8226 cells in which both H3K79me2 and expression levels were significantly decreased by SGC0946, while 67 genes were similarly affected in MM.1S cells (Figure 4A). We also identified 13 genes in which both H3K79me2 and expression levels were decreased in both cell lines and 123 genes in which either H3K79me2 levels or their expression levels were decreased in these cell lines (Figure 4A). Among these, we noted that 4 genes associated with IRF4 and MYC signaling (MYC, IRF4, PRDM1 and KLF2) were affected in both cell lines (Figure 4A). Visualization of the ChIP-seq data clearly revealed decreased H3K79me2 levels in those 4 genes in both cell lines treated with SGC0946, though differential peak call analysis failed to detect KLF2 in RPMI- 8226 cells (Figure 4B). The decreased H3K79me2 levels in these genes in MM cells treated with DOT1L inhibitors were further confirmed by a ChIP-qPCR analysis (Figure 4C). To validate binding of DOT1L to genes marked by H3K79me2, we performed ChIP qPCR and ChIP-seq analysis using an anti-DOT1L antibody. We observed enrichment of DOT1L in the IRF4-MYC signaling genes in both cell lines (Online Supplementary Figure S6).
Figure 4.
Analysis of H3K79me2 and gene expression levels in MM cells treated with DOT1L inhibitors. (A) Integrated analysis of H3K79me2 and gene expression levels in RPMI-8226 and MM.1S cells treated with SGC0946. Left; Venn diagrams of genes whose H3K79me2 or expression levels were suppressed (> 1.5-fold) by SGC0946. Right; Genes indicated in the Venn diagram shown in boxes of their respective colors. Red letters indicate IRF4-MYC signaling genes. Gene expression was assessed in 2 replicates of microarray analyses, and H3K79me2 was assessed in a single ChIP seq analysis. (B) Representative results of ChIP-seq analyses showing decreased H3K79me2 levels at IRF4-MYC signaling genes induced by SGC0946. Results of input DNA are shown below. The numbers on the vertical axis indicate the numbers of sequence reads. Diff Peak: differential peak; TSS: transcription start site. Regions analyzed by ChIP-PCR are indicated by red arrows. (C) ChIP-qPCR analysis of IRF4-MYC signaling genes in MM cells treated with the indicated DOT1L inhibitors (1 mM, 3 days). Results are normalized to respective input DNAs. Shown are means of 3 replications; error bars represent SEMs. An intergenic region located 28 kb upstream of KLF2 was used as a negative control. *P<0.05; NS: not significant. (D) qRT-PCR analysis of IRF4-MYC signaling genes in MM cells treated with the indicated DOT1L inhibitors (1 mM, 6 days). Results are normalized to ACTB expression. Shown are means of 3 replications; error bars represent SEMs. *P<0.05.
In addition, qRT-PCR analysis confirmed decreased expression of the 4 genes in MM cell lines treated with DOT1L inhibitors, though our microarray analysis failed to detect suppression of MYC by SGC0946 in MM.1S cells (Figure 4D). We also confirmed decreased levels of MYC protein in MM cell lines treated with DOT1L inhibitors (Online Supplementary Figure S7), and we found that IRF4 expression was downregulated by DOT1L knockdown in MM cells (Online Supplementary Figure S2A).
DOT1L inhibitors affect immune responses and interferon signaling in MM cells
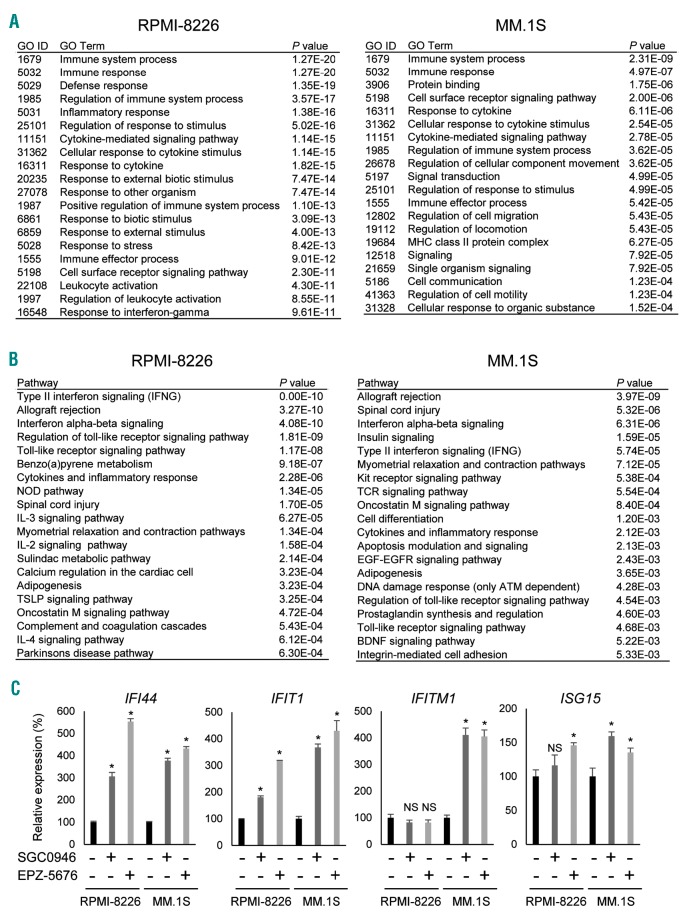
In addition to their suppressive effects on H3K79me2 and gene expression, DOT1L inhibitors also increased expression of a number of genes in MM cells. Microarray analysis showed that 1255 probe sets were upregulated (>1.5-fold) by SGC0946 in RPMI-8226 cells, as were 492 probe sets in MM.1S cells (Online Supplementary Tables S5 and S6). Among them, 143 probe sets (including 125 protein coding genes) were upregulated in both cell lines (Online Supplementary Figure S8A). Gene ontology (GO) analysis suggested that genes involved in “immune system” and “immune response” were significantly enriched among the upregulated genes in both cell lines (Figure 5A), while pathway analysis revealed that genes associated with “interferon (IFN) signaling” were significantly enriched among the upregulated genes (Figure 5B). qRT-PCR analysis confirmed that a series of IFN-stimulated genes were upregulated by SGC0946 and EPZ-5676 in MM cells (Figure 5C). However, ChIP-seq analysis showed that H3K79me2 levels were not significantly altered at these genes (Online Supplementary Figure S8B). This suggests DOT1L inhibitors may affect immune responses and IFN signaling through a H3K79me2-independent mechanism in MM cells.
Figure 5.
DOT1L inhibition affects immune responses and interferon signaling in MM cells. (A) GO analysis of genes of upregulated (> 1.5-fold) by SGC0946 (1 mM, 6 days) in RPMI-8226 and MM.1S cells. (B) Pathway analysis of genes upregulated by SGC0946 in the indicated MM cell lines. (C) qRT-PCR analysis of interferon-stimulated genes in MM cells treated with the indicated DOT1L inhibitors. Results are normalized to ACTB expression. Shown are means of 3 replications; error bars represent SEMs. *P<0.05; NS: not significant.
Gene mutations are potentially associated with the DOT1L sensitivity in MM cells
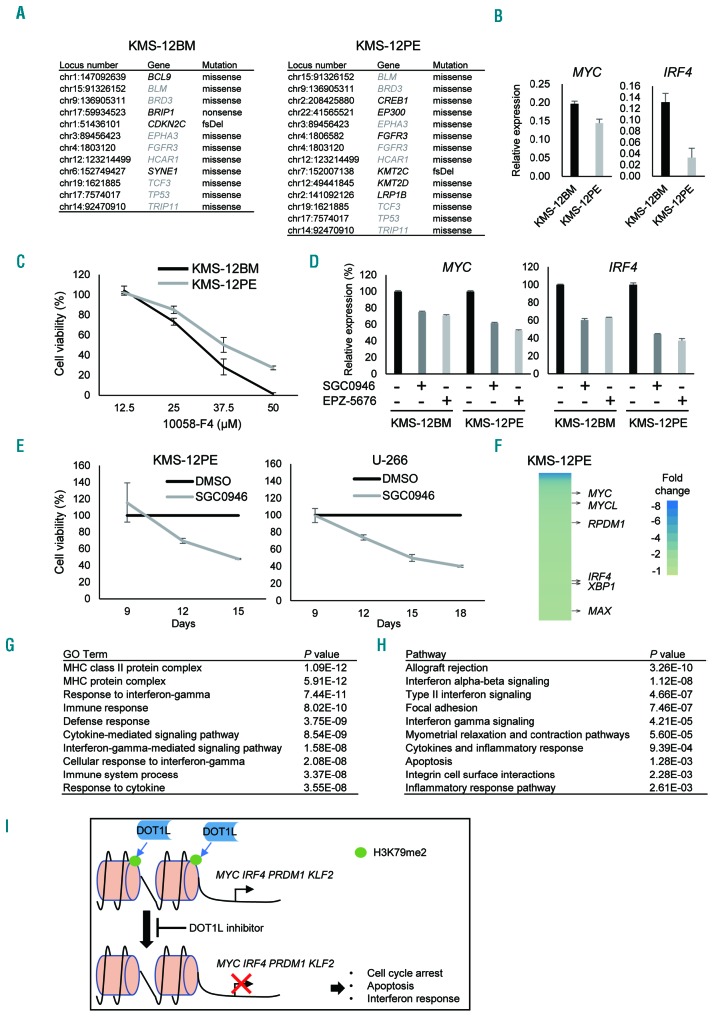
Although the KMS-12BM and KMS-12PE cell lines were established from the same patient,19 KMS-12PE cells were less sensitive to DOT1L inhibitors and other epigenetic drugs than KMS-12BM cells (Figures 1A and 2A). To determine the molecular mechanism underlying this difference in drug sensitivity, we carried out targeted sequencing of a panel of cancer-related genes in these cell lines. In the 409 genes analyzed, mutations were detected in 12 genes in KMS-12BM cells, while 14 mutations in 13 genes were detected in KMS-12PE cells (Figure 6A, Online Supplementary Table S7). Among these mutations, 8 were found in both cell lines (Figure 6A). Notably, KMS-12PE cells exhibited mutations in multiple histone modifier genes (EP300, KMT2C and KMT2D), but KMS-12BM cells did not (Figure 6A).
Figure 6.
Factors potentially associated with the sensitivity of MM cells to DOT1L inhibitors. (A) Mutations of cancer-related genes detected in KMS-12BM and KMS-12PE. Genes shared by both cell lines are indicated by gray letters. fsDel: frameshift deletion. (B) qRT-PCR of MYC and IRF4. Results are normalized to ACTB expression. Shown are means of 3 replications; error bars represent SEMs. (C) Results of cell viability assays in KMS-12BM and KMS-12PE cells treated for 2 days with the indicated concentrations of the MYC inhibitor 10058-F4. Results are normalized to cells treated with DMSO. Shown are means of 3 replications; error bars represent SEMs. (D) qRT-PCR analysis of MYC and IRF4 in KMS-12BM and KMS-12PE cells treated with the indicated DOT1L inhibitors (1 mM, 6 days). Shown are means of 3 replications; error bars represent SEMs. (E) Results of cell viability assays in KMS-12PE and U-266 cells subjected to extended DOT1L inhibitor treatment. Cells were treated with SGC0946 (1 mM) or DMSO for 9 days, after which 3×10⁴ cells were placed in a new 6-well plate and cell viabilities were assessed at the indicated times. Results are normalized to cells treated with DMSO. Shown are means of 3 replications; error bars represent SEMs. (F) Heat map showing genes downregulated (> 1.5-fold) by SGC0946 (1 mM, 12 days) in KMS-12PE cells. (G, H) GO (G) and pathway (H) analyses of genes upregulated (> 1.5-fold) by SGC0946 (1 mM, 12 days) in KMS-12PE cells. (I) Hypothesized mechanism underlying the antitumor effect of DOT1L inhibitors in MM cells.
Extended treatment enhances the effect of DOT1L inhibitors in MM cells
We next clarified whether IRF4-MYC signaling is associated with the different sensitivities of KMS-12BM and KMS-12PE cells to DOT1L inhibitors. qRT-PCR revealed that MYC and IRF4 were expressed at lower levels in KMS-12PE than KMS-12BM cells, suggesting lower IRF4-MYC signaling may be associated with the impaired anti-tumor effect of DOT1L inhibitors (Figure 6B). Consistent with that idea, KMS-12PE cells were also less sensitive to the MYC inhibitor 10058-F4 than were KMS-12BM cells (Figure 6C). By contrast, RPMI-8226 cells, which were sensitive to DOT1L inhibitors, were also highly sensitive to 10058-F4 (Online Supplementary Figure S9).
It is noteworthy, however, that DOT1L inhibitors suppressed expression of MYC and IRF4 in KMS-12PE cells (Figure 6D). Moreover, extended treatment with DOT1L inhibitors for up to 18 days led to strong growth suppression in the less sensitive KMS-12PE and U-266 cell lines (Figure 6E). To clarify the mechanism underlying antitumor effect of the extended treatment, we performed gene expression microarray analysis with KMS-12PE cells treated with SGC0946 or DMSO for 12 days. This analysis identified 509 (401 unique genes) probe sets that were downregulated (> 1.5-fold) and 865 (739 unique genes) that were upregulated (> 1.5-fold) by SGC0946 in KMS-12PE cells (Online Supplementary Tables S8 and S9). Among them, multiple IRF4-MYC signaling genes were downregulated by SGC0946 (Figure 6F). Moreover, gene ontology and pathway analyses showed that genes associated with “immune response” and “IFN signaling” were significantly enriched among the upregulated genes (Figure 6G and H). These results demonstrate that the time required for DOT1L inhibitors to exert their effects varies among MM cells.
Discussion
In the present study, we show that DOT1L inhibitors exerted a strong anti-myeloma effect. Expression of DOT1L is significantly higher in SmMM than NPC, suggesting DOT1L may be causally associated with myelomagenesis.
DOT1L is the only known histone methyltransferase that catalyzes mono-, di- and trimethylation at H3K79.20,21 In mammals, most of H3K79 is unmethylated, and H3K79 methylation is linked to active transcription.20,22 DOT1L is a component of large transcription complexes that also include transcription factors such as AF4, AF9, AF10, ENL and P-TEFb.20,23–26 Within these complexes, DOT1L may initiate or sustain active transcription by mediating H3K79 methylation. DOT1L is also a potential drug target in mixed lineage leukemia (MLL) gene rearranged leukemia. DOT1L forms a complex with MLL fusion proteins, and DOT1L-mediated H3K79 methylation leads to enhanced expression of target oncogenes, including HOXA9 and MEIS1.26,27 Recent studies have demonstrated the selective and strong antitumor effects of DOT1L inhibitors against MLL-rearranged leukemia.17,18,28 Similarly, DOT1L is a potential therapeutic target in lung and breast cancer with high DOT1L expression and neuroblastoma with MYCN amplification.29–31
We found that DOT1L inhibition targets the IRF4-MYC axis in MM cells (Figure 6I). Aberrant activation of several transcription factors, including MYC, MAF, NF-κB and IRF4, is involved in the development of MM.4 MM cell survival is strongly dependent on IRF4 and MYC, and MYC is a direct target gene of IRF4 transactivation, while IRF4 is a direct target of MYC.32,33 The IRF4-MYC axis is thus considered to be an important therapeutic target in MM, and a recent study showed that CBP/EP300 bromodomain inhibitors directly suppress IRF4 expression and inhibit MM cell viability.34 Moreover, dependence on the KDM3A-KLF2-IRF4 axis was recently reported in MM.35 KDM3A maintains KLF2 and IRF4 expression via H3K9 demethylation, and KLF2 directly targets IRF4 while IRF4 reciprocally activates KLF2, forming a positive autoregulatory circuit.35 We found that DOT1L inhibition leads to decreased levels of H3K79me2 and repression of IRF4 and its target genes, including MYC, PRDM1 (also known as BLIMP1) and KLF2 in MM cells.32 As previously shown, H3K79me2 peaked just behind the transcriptional start site of the active genes and gradually declined over the course of the gene body,20,36 and it was significantly depleted in MM cells treated with a DOT1L inhibitor.
We found that genes associated with immune responses and IFN signaling were significantly upregulated by DOT1L inhibition in MM cells. The potential of IFN in the clinical treatment of MM has long been recognized. Interferon-alpha (IFN-α) reportedly induces apoptosis and inhibits growth in MM cell lines.37 In the 1980s, IFN-α was used as monotherapy in MM, with an overall response rate of 15-20%.38 In this study, we found that a series of INF-stimulated genes were upregulated in MM cells by DOT1L inhibitors, which may contribute to the drugs’ anti-myeloma effects. The mechanism underlying the activation of immune response genes and INF signaling is unclear. One possible mechanism is that DOT1L inhibition causes DNA damage that leads to stimulation of IFN signaling.39 An earlier study reported that IRF4 functions as a repressor by binding to the IFN-stimulated response elements of several genes, including IFN-stimulated gene 15 (ISG15), which suggests downregulation of IRF4 by DOT1L inhibition may have caused upregulation of ISG15.40 More recent studies showed that DNA methyltransferase inhibitors stimulate an interferon response by inducing endogenous double strand RNAs, which contribute to the antitumor effect through DNA demethylation.41,42 It is presently unclear whether DOT1L inhibition exerts similar effects in MM cells, however.
Finally, we investigated the mechanism determining DOT1L sensitivity by focusing on two MM cell lines with different sensitivities to DOT1L inhibitors (KMS-12BM and KMS-12PE). These cell lines were both established from a 64-year-old female MM patient, KMS-12BM from bone marrow and KMS-12PE from pleural effusion.19 Targeted sequencing of a panel of cancer-related genes revealed that, although many of the mutations were present in both cell lines, the less sensitive KMS-12PE cells harbored mutations in the histone modifier genes EP300, KMT2C and KMT2D, which were absent in KMS-12BM cells. A recent study reported that mutations in epigenetic modifier genes were more frequently found in previously treated MM patients than in newly diagnosed patients, suggesting these mutations are associated with disease progression and chemoresistance.10 Thus, the mutation of epigenetic modifier genes in KMS-12PE cells may be associated with their reduced sensitivity to DOT1L inhibitors. In addition, we also noted that KMS-12PE cells express MYC and IRF4 at lower levels than KMS-12BM cells, suggesting decreased dependence on the IRF4-MYC axis may lead to lower sensitivity to DOT1L inhibitors in KMS-12PE cells. It is noteworthy, however, that prolonged treatment with DOT1L inhibitors exerted suppressive effects on IRF4/MYC expression and cell viability in the less sensitive MM cell lines. Our results suggest that DOT1L is a promising therapeutic target in MM, and further exploration of DOT1L inhibitors for MM treatment is warranted.
Supplementary Material
Acknowledgments
The authors thank Dr. William F. Goldman for editing the manuscript and Ms. Mutsumi Toyota and Ms. Tomo Hatahira for technical assistance.
Footnotes
Check the online version for the most updated information on this article, online supplements, and information on authorship & disclosures: www.haematologica.org/content/104/1/155
Funding
This study was supported in part by Grant-in-Aid for Scientific Research (C) from the Japan Society for Promotion of Science (JSPS KAKENHI 15K09456, T. Ishida) and Takeda Science Foundation (2018, T. Niinuma).
References
- 1.Siegel RL, Miller KD, Jemal A. Cancer statistics, 2017. CA Cancer J Clin. 2017; 67(1):7–30. [DOI] [PubMed] [Google Scholar]
- 2.Dingli D, Ailawadhi S, Bergsagel PL, et al. Therapy for relapsed multiple myeloma: Guidelines from the Mayo stratification for myeloma and risk-adapted therapy. Mayo Clin Proc. 2017;92(4):578–598. [DOI] [PMC free article] [PubMed] [Google Scholar]
- 3.Dimopoulos K, Gimsing P, Gronbaek K. The role of epigenetics in the biology of multiple myeloma. Blood Cancer J. 2014; 4:e207. [DOI] [PMC free article] [PubMed] [Google Scholar]
- 4.Morgan GJ, Walker BA, Davies FE. The genetic architecture of multiple myeloma. Nat Rev Cancer. 2012;12(5):335–348. [DOI] [PubMed] [Google Scholar]
- 5.San-Miguel JF, Hungria VT, Yoon SS, et al. Panobinostat plus bortezomib and dexamethasone versus placebo plus bortezomib and dexamethasone in patients with relapsed or relapsed and refractory multiple myeloma: a multicentre, randomised, double-blind phase 3 trial. Lancet Oncol. 2014; 15(11):1195–1206. [DOI] [PubMed] [Google Scholar]
- 6.Hideshima T, Richardson PG, Anderson KC. Mechanism of action of proteasome inhibitors and deacetylase inhibitors and the biological basis of synergy in multiple myeloma. Mol Cancer Ther. 2011;10(11):2034–2042. [DOI] [PMC free article] [PubMed] [Google Scholar]
- 7.Mozzetta C, Boyarchuk E, Pontis J, Ait-Si-Ali S. Sound of silence: the properties and functions of repressive Lys methyltransferases. Nat Rev Mol Cell Biol. 2015; 16(8):499–513. [DOI] [PubMed] [Google Scholar]
- 8.Black JC, Van Rechem C, Whetstine JR. Histone lysine methylation dynamics: establishment, regulation, and biological impact. Mol Cell. 2012;48(4):491–507. [DOI] [PMC free article] [PubMed] [Google Scholar]
- 9.Chapman MA, Lawrence MS, Keats JJ, et al. Initial genome sequencing and analysis of multiple myeloma. Nature. 2011; 471(7339):467–472. [DOI] [PMC free article] [PubMed] [Google Scholar]
- 10.Pawlyn C, Kaiser MF, Heuck C, et al. The spectrum and clinical impact of epigenetic modifier mutations in myeloma. Clin Cancer Res. 2016;22(23):5783–5794. [DOI] [PMC free article] [PubMed] [Google Scholar]
- 11.Martinez-Garcia E, Popovic R, Min DJ, et al. The MMSET histone methyl transferase switches global histone methylation and alters gene expression in t(4;14) multiple myeloma cells. Blood. 2011;117(1):211–220. [DOI] [PMC free article] [PubMed] [Google Scholar]
- 12.Hernando H, Gelato KA, Lesche R, et al. EZH2 inhibition blocks multiple myeloma cell growth through upregulation of epithelial tumor suppressor genes. Mol Cancer Ther. 2016;15(2):287–298. [DOI] [PubMed] [Google Scholar]
- 13.Pawlyn C, Bright MD, Buros AF, et al. Overexpression of EZH2 in multiple myeloma is associated with poor prognosis and dysregulation of cell cycle control. Blood Cancer J. 2017;7(3):e549. [DOI] [PMC free article] [PubMed] [Google Scholar]
- 14.Nojima M, Maruyama R, Yasui H, et al. Genomic screening for genes silenced by DNA methylation revealed an association between RASD1 inactivation and dexamethasone resistance in multiple myeloma. Clin Cancer Res. 2009;15(13):4356–4364. [DOI] [PubMed] [Google Scholar]
- 15.Chen CW, Koche RP, Sinha AU, et al. DOT1L inhibits SIRT1-mediated epigenetic silencing to maintain leukemic gene expression in MLL-rearranged leukemia. Nat Med. 2015;21(4):335–343. [DOI] [PMC free article] [PubMed] [Google Scholar]
- 16.Lu R, Wang P, Parton T, et al. Epigenetic perturbations by Arg882-mutated DNMT3A potentiate aberrant stem cell gene-expression program and acute leukemia development. Cancer Cell. 2016; 30(1):92–107. [DOI] [PMC free article] [PubMed] [Google Scholar]
- 17.Daigle SR, Olhava EJ, Therkelsen CA, et al. Potent inhibition of DOT1L as treatment of MLL-fusion leukemia. Blood. 2013; 122(6):1017–1025. [DOI] [PMC free article] [PubMed] [Google Scholar]
- 18.Yu W, Chory EJ, Wernimont AK, et al. Catalytic site remodelling of the DOT1L methyltransferase by selective inhibitors. Nat Commun. 2012;3:1288. [DOI] [PubMed] [Google Scholar]
- 19.Namba M, Ohtsuki T, Mori M, et al. Establishment of five human myeloma cell lines. In Vitro Cell Dev Biol. 1989; 25(8):723–729. [DOI] [PubMed] [Google Scholar]
- 20.Vlaming H, van Leeuwen F. The upstreams and downstreams of H3K79 methylation by DOT1L. Chromosoma. 2016; 125(4):593–605. [DOI] [PubMed] [Google Scholar]
- 21.Feng Q, Wang H, Ng HH, et al. Methylation of H3-lysine 79 is mediated by a new family of HMTases without a SET domain. Curr Biol. 2002;12(12):1052–1058. [DOI] [PubMed] [Google Scholar]
- 22.Steger DJ, Lefterova MI, Ying L, et al. DOT1L/KMT4 recruitment and H3K79 methylation are ubiquitously coupled with gene transcription in mammalian cells. Mol Cell Biol. 2008;28(8):2825–2839. [DOI] [PMC free article] [PubMed] [Google Scholar]
- 23.Bitoun E, Oliver PL, Davies KE. The mixed-lineage leukemia fusion partner AF4 stimulates RNA polymerase II transcriptional elongation and mediates coordinated chromatin remodeling. Hum Mol Genet. 2007; 16(1):92–106. [DOI] [PubMed] [Google Scholar]
- 24.Mueller D, Bach C, Zeisig D, et al. A role for the MLL fusion partner ENL in transcriptional elongation and chromatin modification. Blood. 2007;110(13):4445–4454. [DOI] [PMC free article] [PubMed] [Google Scholar]
- 25.Mueller D, Garcia-Cuellar MP, Bach C, Buhl S, Maethner E, Slany RK. Misguided transcriptional elongation causes mixed lineage leukemia. PLoS Biol. 2009;7(11):e1000249. [DOI] [PMC free article] [PubMed] [Google Scholar]
- 26.Okada Y, Feng Q, Lin Y, et al. hDOT1L links histone methylation to leukemogenesis. Cell. 2005;121(2):167–178. [DOI] [PubMed] [Google Scholar]
- 27.Krivtsov AV, Feng Z, Lemieux ME, et al. H3K79 methylation profiles define murine and human MLL-AF4 leukemias. Cancer Cell. 2008;14(5):355–368. [DOI] [PMC free article] [PubMed] [Google Scholar]
- 28.Daigle SR, Olhava EJ, Therkelsen CA, et al. Selective killing of mixed lineage leukemia cells by a potent small-molecule DOT1L inhibitor. Cancer Cell. 2011;20(1):53–65. [DOI] [PMC free article] [PubMed] [Google Scholar]
- 29.Kim W, Kim R, Park G, Park JW, Kim JE. Deficiency of H3K79 histone methyltransferase Dot1-like protein (DOT1L) inhibits cell proliferation. J Biol Chem. 2012; 287(8):5588–5599. [DOI] [PMC free article] [PubMed] [Google Scholar]
- 30.Zhang L, Deng L, Chen F, et al. Inhibition of histone H3K79 methylation selectively inhibits proliferation, self-renewal and metastatic potential of breast cancer. Oncotarget. 2014;5(21):10665–10677. [DOI] [PMC free article] [PubMed] [Google Scholar]
- 31.Wong M, Tee AEL, Milazzo G, et al. The histone methyltransferase DOT1L promotes neuroblastoma by regulating gene transcription. Cancer Res. 2017;77(9):2522–2533. [DOI] [PubMed] [Google Scholar]
- 32.Shaffer AL, Emre NC, Lamy L, et al. IRF4 addiction in multiple myeloma. Nature. 2008;454(7201):226–231. [DOI] [PMC free article] [PubMed] [Google Scholar]
- 33.Holien T, Vatsveen TK, Hella H, Waage A, Sundan A. Addiction to c-MYC in multiple myeloma. Blood. 2012;120(12):2450–2453. [DOI] [PubMed] [Google Scholar]
- 34.Conery AR, Centore RC, Neiss A, et al. Bromodomain inhibition of the transcriptional coactivators CBP/EP300 as a therapeutic strategy to target the IRF4 network in multiple myeloma. Elife. 2016;5. [DOI] [PMC free article] [PubMed] [Google Scholar]
- 35.Ohguchi H, Hideshima T, Bhasin MK, et al. The KDM3A-KLF2-IRF4 axis maintains myeloma cell survival. Nat Commun. 2016; 7:10258. [DOI] [PMC free article] [PubMed] [Google Scholar]
- 36.Suzuki H, Takatsuka S, Akashi H, et al. Genome-wide profiling of chromatin signatures reveals epigenetic regulation of MicroRNA genes in colorectal cancer. Cancer Res. 2011;71(17):5646–5658. [DOI] [PubMed] [Google Scholar]
- 37.Minami R, Muta K, Ilseung C, Abe Y, Nishimura J, Nawata H. Interleukin-6 sensitizes multiple myeloma cell lines for apoptosis induced by interferon-alpha. Exp Hematol. 2000;28(3):244–255. [DOI] [PubMed] [Google Scholar]
- 38.Zhang L, Tai YT, Ho MZG, Qiu L, Anderson KC. Interferon-alpha-based immunotherapies in the treatment of B cell-derived hematologic neoplasms in today’s treat-to-target era. Exp Hematol Oncol. 2017;6:20. [DOI] [PMC free article] [PubMed] [Google Scholar]
- 39.Cheon H, Borden EC, Stark GR. Interferons and their stimulated genes in the tumor microenvironment. Semin Oncol. 2014; 41(2):156–173. [DOI] [PMC free article] [PubMed] [Google Scholar]
- 40.Rosenbauer F, Waring JF, Foerster J, Wietstruk M, Philipp D, Horak I. Interferon consensus sequence binding protein and interferon regulatory factor-4/Pip form a complex that represses the expression of the interferon-stimulated gene-15 in macrophages. Blood. 1999;94(12):4274–4281. [PubMed] [Google Scholar]
- 41.Chiappinelli KB, Strissel PL, Desrichard A, et al. Inhibiting DNA methylation causes an interferon response in cancer via dsRNA including endogenous retroviruses. Cell. 2015;162(5):974–986. [DOI] [PMC free article] [PubMed] [Google Scholar]
- 42.Roulois D, Loo Yau H, Singhania R, et al. DNA-demethylating agents target colorectal cancer cells by inducing viral mimicry by endogenous transcripts. Cell. 2015; 162(5):961–973. [DOI] [PMC free article] [PubMed] [Google Scholar]
Associated Data
This section collects any data citations, data availability statements, or supplementary materials included in this article.


