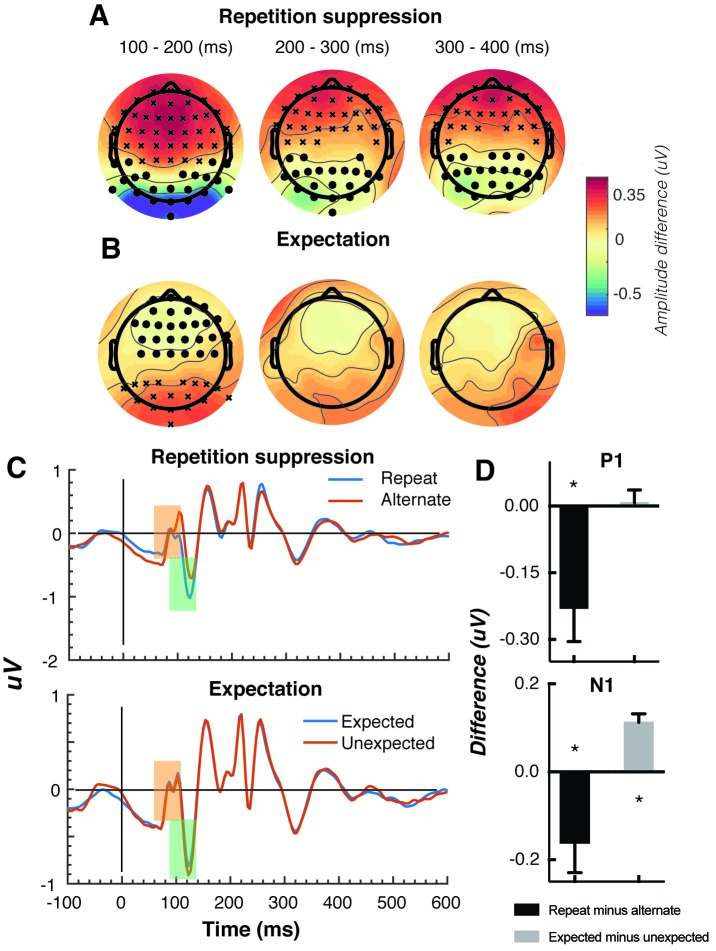
Figure 2. Univariate EEG results for the effect of repetition suppression and expectation on the second stimulus in a pair.
Panels A and B show the main effects of repetition suppression and expectation, respectively, over three post-stimulus epochs (100–200 ms, 200–300 ms, 300–400 ms) and across all electrodes. The main effect of repetition suppression is displayed as Repeating minus Alternating trials. The main effect of expectation is displayed as Expected minus Unexpected trials. Circles indicate clusters of electrodes with significantly reduced activity, and crosses indicate clusters of electrodes with significantly increased activity (alpha p < 0.05, cluster p < 0.025, N permutations = 1500). (C) Bandpass filtered (2–40 Hz) event-related potentials (ERPs) for the two conditions, averaged over occipital-parietal electrodes (O1, O2, Oz, POz, PO7, PO3, PO8, PO4, P3, Pz, P2). A peak analysis was conducted to aid comparison with previous studies. Orange shading indicates the P1 component; green shading indicates the N1 component. (D) Peak analysis results for P1 and N1 components. Note that the plotted values represent differences between conditions, as indicated, rather than condition-specific evoked responses. Asterisks indicate p < 0.05. Error bars indicate ±1 standard error.

