Abstract
Purpose
To develop a fast three-dimensional method for simultaneous T1 and T2 quantification for breast imaging by using MR fingerprinting.
Materials and Methods
In this prospective study, variable flip angles and magnetization preparation modules were applied to acquire MR fingerprinting data for each partition of a three-dimensional data set. A fast postprocessing method was implemented by using singular value decomposition. The proposed technique was first validated in phantoms and then applied to 15 healthy female participants (mean age, 24.2 years ± 5.1 [standard deviation]; range, 18–35 years) and 14 female participants with breast cancer (mean age, 55.4 years ± 8.8; range, 39–66 years) between March 2016 and April 2018. The sensitivity of the method to B1 field inhomogeneity was also evaluated by using the Bloch-Siegert method.
Results
Phantom results showed that accurate and volumetric T1 and T2 quantification was achieved by using the proposed technique. The acquisition time for three-dimensional quantitative maps with a spatial resolution of 1.6 × 1.6 × 3 mm3 was approximately 6 minutes. For healthy participants, averaged T1 and T2 relaxation times for fibroglandular tissues at 3.0 T were 1256 msec ± 171 and 46 msec ± 7, respectively. Compared with normal breast tissues, higher T2 relaxation time (68 msec ± 13) was observed in invasive ductal carcinoma (P < .001), whereas no statistical difference was found in T1 relaxation time (1183 msec ± 256; P = .37).
Conclusion
A method was developed for breast imaging by using the MR fingerprinting technique, which allows simultaneous and volumetric quantification of T1 and T2 relaxation times for breast tissues.
© RSNA, 2018
Summary
A method was developed for breast imaging by using the MR fingerprinting technique, which allows simultaneous and volumetric quantification of T1 and T2 relaxation times for breast tissues.
Implications for Patient Care
■ Three-dimensional quantitative measurement of relaxation times can be obtained by using a tailored MR fingerprinting acquisition for quantitative evaluation of breast tumors.
■ MR fingerprinting–measured relaxation times may be useful in functional quantitative evaluation of breast tissue.
Introduction
With the rapid development of technologies in the past 2 decades, MRI has made a substantial impact in breast imaging for lesion detection and characterization (1). As our understanding of breast imaging advances, more goals for breast MR are being identified, which require more advanced functional and quantitative MRI techniques (2–7). T1 and T2 relaxation times are fundamental MRI-specific properties that are determined by intrinsic tissue composition. Significantly different relaxation times for breast tumors compared with normal tissues were reported in the early 1980s (8,9). Investigations using modern imagers also suggest that quantitative T1 and T2 information is beneficial for functional characterization of breast cancer (10,11). However, quantitative measurement of MR relaxation parameters can be technically challenging in some organs, including the breast. Hence, a quantitative imaging framework called MR fingerprinting was introduced (12), which can provide rapid and simultaneous quantification of both T1 and T2 relaxation times. With MR fingerprinting, variable acquisition parameters are used to create unique signal signatures for different tissue types based on differences in tissue properties such as T1 or T2. The acquired signals are then matched to a dictionary of signal evolutions generated with Bloch equation simulation to simultaneously quantify these tissue properties by using a pattern recognition algorithm. Compared with conventional quantitative imaging approaches, data acquisition in MR fingerprinting is performed by using variable acquisition parameters, not allowing the signal to settle into a steady state, as the goal of the experiment is parameter measurement and map production and not acquisition of qualitative images. The signal time course is allowed to take on configurations that would not be possible if direct fitting of the data were the goal. Because template matching is used, however, information-rich and complex signal evolutions can be used, which allow efficient mapping of the properties of interest. Spatial and temporal incoherence of the artifacts allows the creation of high-quality maps despite low-quality individual images, enabling high acceleration factors in data sampling compared with previous techniques (12). This technique has been successfully applied to characterize prostate cancers and brain tumors (12–15). However, to our knowledge, the development of an MR fingerprinting approach for breast imaging has not been previously explored because it poses technical challenges not encountered in other applications. Most current MR fingerprinting techniques generate two-dimensional tissue property maps (12–15). For breast imaging, an MR fingerprinting method with volumetric coverage is strongly preferred, as breast cancers can be multicentric and multifocal. Because of the high fat content in the breasts, major challenges from both static (B0) and transmit (B1) magnetic field inhomogeneities are also expected (16). The purpose of this study was to develop a fast three-dimensional method for simultaneous T1 and T2 quantification for breast imaging by using MR fingerprinting.
Materials and Methods
This prospective study was Health Insurance Portability and Accountability Act–compliant and approved by an institutional review board. Informed consent was obtained from all study participants prior to the MRI examinations.
Data Acquisition for Three-dimensional Breast MR Fingerprinting
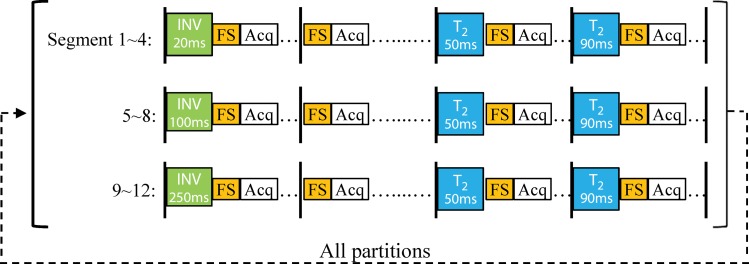
All experiments were performed with a 3.0-T Verio imager (Siemens Healthineers, Erlangen, Germany) by using a breast coil with eight receiver coils. A two-dimensional fast imaging with steady-state free precession–based MR fingerprinting acquisition was modified for three-dimensional breast imaging (14). As shown in Figure 1a, the three-dimensional MR fingerprinting data were acquired sequentially through partitions. For each partition, the pulse sequence was divided into 12 segments and each segment included a group of magnetization preparation modules, a data acquisition window, and a waiting period. In total, three inversion-recovery modules (inversion time of 20 msec, 100 msec, or 250 msec) and six T2-preparation modules (effective echo time, 50 msec or 90 msec) were applied within each partition. An adiabatic inversion pulse was used at the beginning of each inversion module to achieve a better performance in signal inversion. A Malcom-Levitt (MLEV) composite T2-preparation module was also used to further minimize the effect of inhomogeneous B1 field (17). The T2-preparation module consists of a 90°x excitation pulse followed by four composite 180°y pulses (90°x−180°y−90°x), and then a composite 90°−x pulse (270°x−360°−x). The phases of the four composite 180°y pulses were implemented based on a Malcom-Levitt pattern to reduce its sensitivity to B0 and B1 inhomogeneities. Finally, because breasts have a large amount of adipose tissues, a spectral-selective fat-saturation module was applied in each segment to suppress the fat signal.
Figure 1a:
(a) Diagram shows three-dimensional breast MR fingerprinting with multiple magnetization-preparation modules. Acq = data acquisition window, FS = fat suppression module, INV = inversion recovery module, T2 = T2-preparation module using Malcom-Levitt algorithm. (b) Graph shows flip angle pattern used in acquisition.
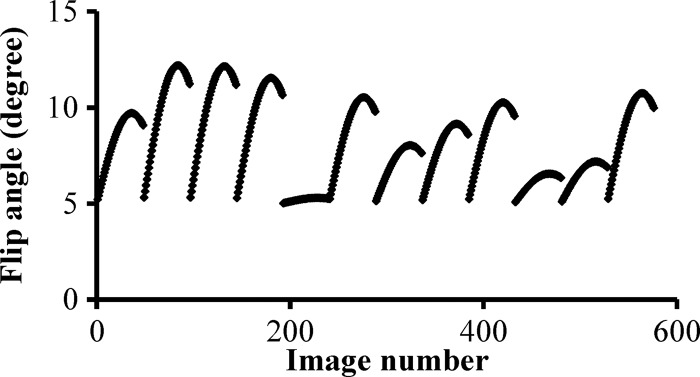
A data acquisition window was applied after the magnetization preparation modules in each segment. For each acquisition window, 48 uniform-density spiral arms were acquired in 48 repetition times with variable flip angles ranging from 5° to 12° (Fig 1b). As in the original MR fingerprinting technique, a high in-plane reduction factor of 48 was used, so only one spiral arm was acquired for each partition within a three-dimensional volume (12). With 12 segments, a total of 576 highly undersampled volumes were acquired in one three-dimensional MR fingerprinting measurement. A golden-angle rotation was used between the spirals to produce greater spatial inhomogeneity. At the end of each segment, a variable waiting time between 190 msec and 440 msec was applied to allow longitudinal recovery for better signal-to-noise ratio. The overall duration for each segment was approximately 700 msec.
Figure 1b:
(a) Diagram shows three-dimensional breast MR fingerprinting with multiple magnetization-preparation modules. Acq = data acquisition window, FS = fat suppression module, INV = inversion recovery module, T2 = T2-preparation module using Malcom-Levitt algorithm. (b) Graph shows flip angle pattern used in acquisition.
The same combination of acquisition parameters, such as the preparation modules and flip angle pattern, was repeated for each partition and a constant time delay of 2 seconds was applied between partitions for longitudinal recovery. Other imaging parameters included the following: field of view, 40 × 40 cm; matrix size, 256 × 256 (with an effective in-plane resolution of 1.6 mm); repetition time, 6.1 msec; echo time, 0.9 msec; section thickness, 3 mm; number of partitions, 48; partial Fourier imaging in the partition direction, 6/8. The overall acquisition time for 48 partitions was approximately 6 minutes.
Image Reconstruction and Processing
Data processing was performed off-line by using Matlab (version R2014b; Mathworks, Natick, Mass) on a standalone personal computer (Intel Xeon E5–2630, version 2, central processing units at 2.6 GHz and 64 GB of random access memory). To retrieve tissue properties (T1, T2, and proton density) from the MR fingerprinting measurement, a dictionary including the signal evolutions from a wide range of T1 and T2 values (T1, 60 msec to 5000 msec; T2, 10 msec to 500 msec) was first calculated by using Bloch equation simulations (12). In total, the dictionary contained 20 059 entries. The effect of incomplete longitudinal recovery due to the 2-second waiting time was also considered in the generation of MR fingerprinting dictionary. The longitudinal magnetization was set at 1 at the beginning of the Bloch equation simulations. The simulation of the MR fingerprinting acquisition of partitions was repeated until the longitudinal magnetization at the beginning of the partition acquisition reached a steady state. Further signal evolutions for the MR fingerprinting dictionary were then calculated under this steady-state condition. A singular value decomposition–based processing method was then implemented for efficient image reconstruction and template matching (18). The singular value decomposition algorithm was first applied to the MR fingerprinting dictionary in the time domain. A low-rank approximation was applied and 17 singular values with magnitude larger than 0.001 were retained. Because of the linear nature of Fourier transform, the singular value decomposition compression was applied to the raw k-space data before gridding and inverse Fourier transform. Afterward, 17 singular images instead of all 576 undersampled images were reconstructed by using a nonuniform fast Fourier transform toolbox, and these singular images were then matched to the compressed MR fingerprinting dictionary to retrieve the underlying tissue properties.
Phantom Validation
The accuracy of the proposed method was validated by using an agarose gel phantom containing 10 vials with different concentrations of gadolinium. Because of the size of the vials, an MR fingerprinting measurement with only 16 partitions (3-mm thickness) was performed with an in-plane resolution of 1.6 mm. The T1 and T2 relaxation times obtained with the proposed method were compared with reference T1 and T2 values acquired from the center of the vials by using a two-dimensional single-echo spin-echo sequence.
In Vivo Studies
Between March 2016 and April 2018, the proposed three-dimensional MR fingerprinting method was applied to 15 healthy female participants (mean age, 24.2 years ± 5.1 [standard deviation]; range, 18–35 years) and 14 female participants (mean age, 55.4 years ± 8.8; range, 39–66 years) (see Table 1 and Appendix E1 [online]) with biopsy-proven invasive ductal carcinoma (IDC). For both healthy participants and participants with breast cancer, a clinical fat-saturated T2-weighted image was first acquired with a spatial resolution of 0.8 × 0.8 × 1 mm3. The three-dimensional MR fingerprinting sequence was then used in the axial plane with a spatial resolution of 1.6 × 1.6 × 3 mm3. For all 14 participants with breast cancer, a clinical dynamic contrast material–enhanced MRI was also performed after the three-dimensional MR fingerprinting acquisition. Region-of-interest analysis was performed by one radiologist (A.P., with 8 years of experience in breast imaging) to extract T1 and T2 values from both healthy participants and participants with breast cancer (see Appendix E1 [online]).
Table 1:
Characteristics of Participants with Breast Cancer
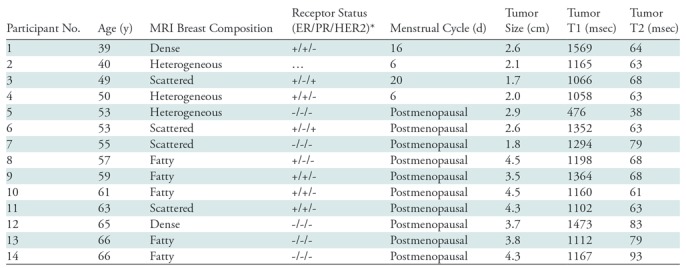
Note.—ER = estrogen receptor, HER2 = human epidermal growth factor receptor 2, PR = progesterone receptor.
*+ indicates positive and - indicates negative.
Statistical Analysis
The results are presented as means ± standard deviations in the current study. A two-tailed Student t test was used to compare the T1 and T2 values obtained from 15 healthy participants and 14 participants with IDCs. In participants with multiple lesions, the largest lesion was selected as index lesion and used for statistical analysis. A paired Student t test was also performed to compare the T1 and T2 results obtained with and without B1 map correction (see Appendix E1 [online]). A P value of less than .05 was deemed to indicate statistical significance.
Results
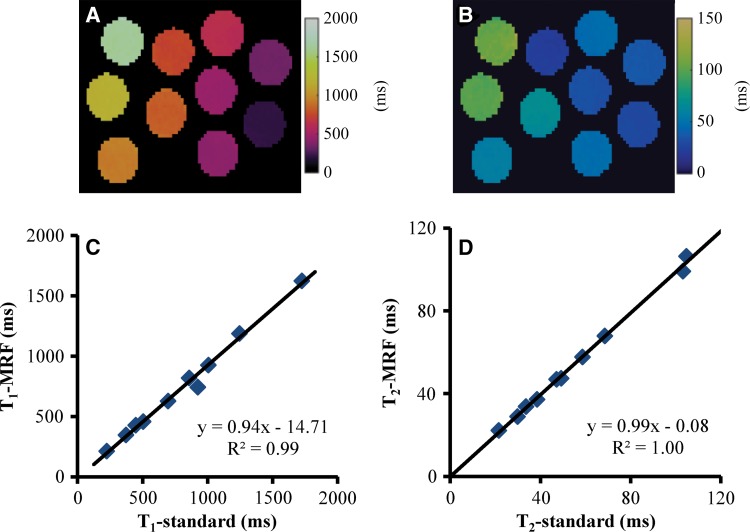
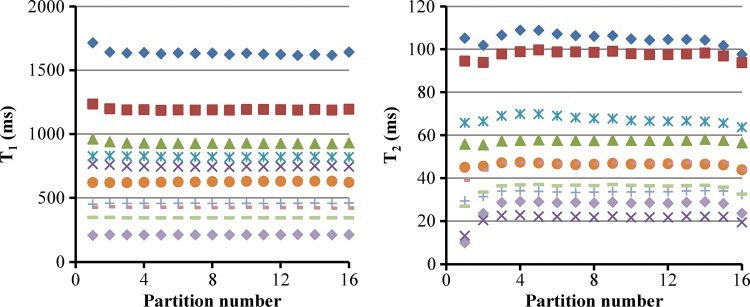
Figure 2 shows the results of T1 and T2 relaxation times acquired from the central partition in a phantom experiment. A close match to the results from the reference method was observed for a large range of T1 (200–1600 msec) and T2 (20–105 msec) values. Compared with the reference T1 and T2 values acquired with the single-echo spin-echo methods, the mean percentage difference was 7.8% ± 4.6 and 2.6% ± 1.8 for T1 and T2 values obtained with the three-dimensional MR fingerprinting method, respectively. Figure 3 shows the average T1 and T2 values measured from the 10 vials in all 16 partitions. Despite a small variation in T1 (2.6% ± 2.1) and T2 values (11.1% ± 14.1) at the end partitions, a consistent measurement was observed with a T1 variation of 0.8% ± 0.3 and a T2 variation of 3.5% ± 2.7 across the central 14 partitions.
Figure 2:
Images show, A, T1 and, B, T2 maps acquired from central partition in phantom study. C, D, Graphs show comparison of T1 and T2 values obtained from proposed method and reference methods by using two-dimensional single-echo spin-echo sequences. MRF = MR fingerprinting.
Figure 3:
Graphs show variation of phantom T1 (left) and T2 (right) values along partition direction. Each symbol represents relaxation measurements from one vial in the phantom experiments.
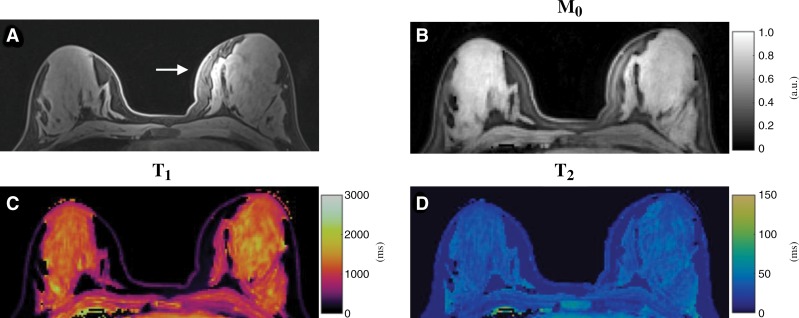
Figure 4 shows representative T1, T2, and proton density maps acquired from a healthy study participant. Compared with the clinical fat-saturated image (Fig 4, A), successful fat suppression was achieved in the quantitative maps obtained with MR fingerprinting. Although substantial signal variation in the left breast was observed in the clinical image due to B1 field inhomogeneity (Fig 4, A), no clear variation was noticed in the quantitative relaxation maps (Fig 4, C and D).
Figure 4:
Conventional and MR fingerprinting images in a 19-year-old healthy female participant. A, Standard clinical fat-saturated image. Substantial signal variation in left breast was observed (arrow), which is likely due to B1 field inhomogeneity. B, Proton density (M0), C, T1, and, D, T2 maps acquired from same section location as in A by using proposed three-dimensional MR fingerprinting method.
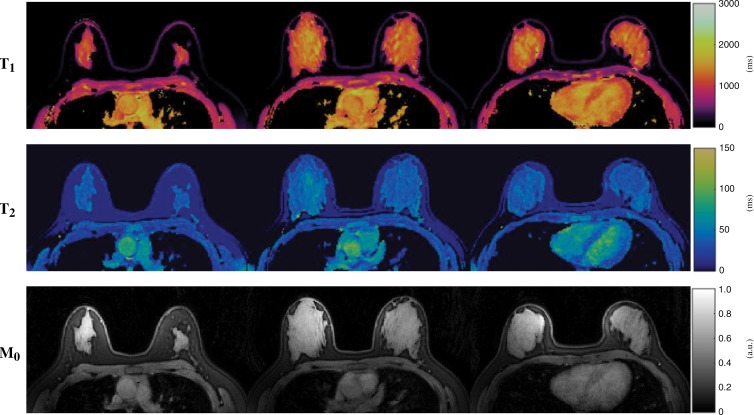
Representative three-dimensional quantitative maps obtained from another healthy participant are shown in Figure 5. Although only results from three partitions are depicted for ease of viewing, a total of 48 partitions were acquired in each MR fingerprinting examination, which provides nearly whole breast coverage for this participant. Quantitative measurement was performed in 15 healthy participants and an average T1 of 1256 msec ± 171 and T2 of 46 msec ± 7 for fibroglandular tissues were obtained, which agree well with the literature values obtained at 3.0 T (19).
Figure 5:
Images show simultaneously acquired T1 (top), T2 (middle), and proton density (M0) (bottom) maps in a 23-year-old healthy female participant. Three of 48 maps in total are presented for each tissue property. Whole breast coverage was achieved for this participant with total acquisition time of approximately 6 minutes.
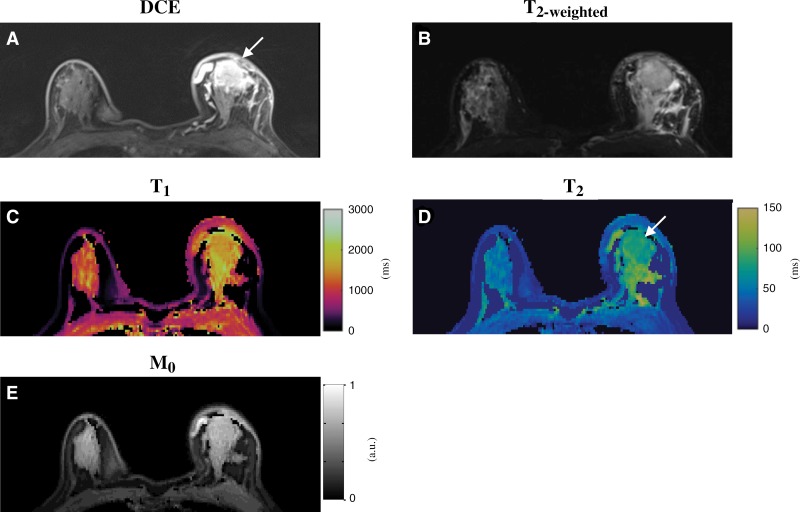
A total of 14 participants with biopsy-proven IDC lesions were also imaged with the three-dimensional MR fingerprinting technique. Figure 6 shows axial T2-weighted, dynamic, arterial phase postgadolinium images and precontrast quantitative MR fingerprinting maps from a participant with a tumor in the left breast. Compared with the results obtained from normal fibroglandular tissues in the right breast (T1, 1198 msec ± 99; T2, 40 msec ± 5), longer T1 and T2 relaxation times were observed for the tumor (T1, 1473 msec ± 103; T2, 83 msec ± 5). In addition, prolonged T1 and T2 relaxation times were also observed in the surrounding fibroglandular parenchyma that could be related to peritumoral tissue edema or postbiopsy changes.
Figure 6:
Conventional and MR fingerprinting images in a 65-year-old female participant with invasive ductal carcinoma in left breast. A, Clinical postcontrast and, B, T2-weighted images. C–E, T1, T2, and proton density (M0) maps acquired from similar position as in A and B. Longer T1 and T2 relaxation times were observed for tumor (T1, 1473 msec ± 103; T2, 83 msec ± 5) compared with normal fibroglandular tissues in right breast (T1, 1198 msec ± 99; T2, 40 msec ± 5). Prolonged T1 and T2 relaxation times were also observed in surrounding fibroglandular parenchyma, which could be due to peritumoral tissue edema or postbiopsy changes. DCE = dynamic contrast material–enhanced.
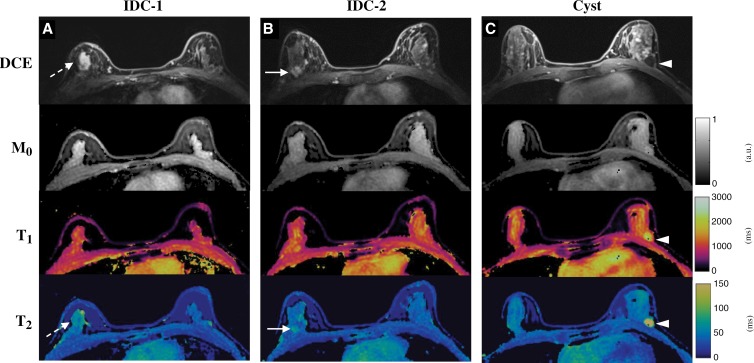
Figure 7 shows images and maps obtained from another participant with two IDCs in the upper outer quadrant of right breast and one benign cyst in the lower outer quadrant of left breast. All the lesions could be visualized in one scan with the three-dimensional MR fingerprinting measurement. Compared with the normal fibroglandular tissues in the left breast (T1, 1184 msec ± 91; T2, 42 msec ± 2), longer T2 values were observed for both IDC lesions (Fig 7, A, 62 msec ± 1; Fig 7, B, 63 msec ± 6). No apparent difference was observed in T1 values for the IDCs (Fig 7, A, 1062 msec ± 123; Fig 7, B, 1165 msec ± 77). However, much longer T1 (1998 msec ± 335) and T2 (189 msec ± 28) relaxation times were observed for the benign cyst in the left breast (Fig 7, C).
Figure 7:
Conventional and MR fingerprinting images in a 40-year-old female participant with, A, B, two invasive ductal carcinoma (IDC) lesions in right breast and, C, one cyst in left breast. Both dynamic postcontrast images and MR fingerprinting results are presented. Compared with values from normal fibroglandular tissues, longer T2 values were observed from both IDC lesions and cyst, whereas longer T1 value was only obtained with cyst.
A summary of all the T1 and T2 relaxation times obtained from both healthy participants and participants with breast cancer is presented in Table 2. A higher T2 relaxation time was observed for IDCs compared with the values for normal breast tissue in healthy participants (P < .001) and from contralateral unaffected breast in participants with breast cancer (P = .002). No statistical difference was noticed for T1 relaxation time in IDCs compared with normal breast tissue from healthy participants (P = .37) as well as participants with breast cancer (P = .33).
Table 2:
Summary of T1 and T2 Relaxation Times from Both Healthy Participants and Participants with IDC

Note.—Data are means ± standard deviations. IDC = invasive ductal carcinoma.
*In participants with breast cancer, the numbers for normal breast tissue were obtained from regions of interest drawn on contralateral nondiseased breast.
Discussion
In our study, a rapid and accurate volumetric relaxometry method was developed for breast tissue assessment by using the MR fingerprinting technique. The T1 and T2 relaxation times acquired with the proposed method are in good agreement with literature values. For example, Rakow-Penner et al (19) reported T1 values of 1445 msec ± 93 and T2 values of 54 msec ± 9 for normal fibroglandular tissue at 3.0 T, which match well to our findings from healthy study participants. In addition, Tan et al (11) measured T2 relaxation times in 37 study participants with IDCs by using both imaging and spectroscopic methods at 1.5 T. The T2 values of 75 msec ± 15 from imaging and 77 msec ± 17 from spectroscopy are both slightly higher than the results of our study, but this is likely because the measurements were performed at a lower field strength.
Although MRI has demonstrated superior performance in breast imaging compared with other imaging modalities, one big drawback is its high costs due to both MRI acquisition and associated reading time. Major efforts have therefore been spent to reduce the imaging time to only a few minutes per study participant while maintaining similar diagnostic accuracy (20). Our present work is designed to create a form of functional evaluation for the breast and would likely result in more table time. The two are different (and potentially complementary) developments with different goals. Further work is needed to determine what clinical role is to be played by functional technologies such as MR fingerprinting. Similar to other functional MRI techniques, the aim of MR fingerprinting is targeted at providing more comprehensive functional characterization of breast lesions. With the rapid T1 and T2 quantification, MR fingerprinting holds potential for early assessment of treatment response. Literature suggests that change in relaxation times could be useful in predicting early response to chemotherapy and may reflect changes in tumor tissue properties before a measurable decrease in tumor size (10,11,21,22). MR fingerprinting–relaxometry may potentially also be useful in further differentiation of benign and malignant lesions that show similar enhancement patterns with conventional imaging methods (23). Although all the T1 and T2 measurements in our current study were performed before contrast administration, MR fingerprinting can also be performed after contrast administration and the difference in pre- and postcontrast measurements could provide further information about breast lesions than those from precontrast measurements alone. The current spatial resolution for breast MR fingerprinting (1.6 × 1.6 × 3 mm3) is lower than that of contrast-enhanced clinical standard imaging (1-mm isotropic or better), and on the order of diffusion-weighted imaging (3). This could lead to partial volume effects such that region of interest drawn on glandular tissue could contain nonglandular tissue. Because acquisition time is linked to realistically obtainable spatial resolution, future development in combination with other acceleration techniques such as parallel imaging, along with deblurring techniques (24) to allow longer spiral readouts, could be explored to further improve resolution.
One challenge particular to breast imaging is the large amount of adipose tissue compared with other organs. The chemical shift between fat and water leads to image blurring when using a spiral readout trajectory, such as that used in MR fingerprinting, especially when long spiral readouts are used (25). To achieve good image quality with the desired spatial resolution for breast MR fingerprinting, fat suppression modules were applied to suppress fat signal in our current study. The application of fat suppression could also help improve detection of breast cancer with quantitative T2 maps such as those derived with MR fingerprinting. It is well known that fat has a longer T2 relaxation time than that of fibroglandular tissue, and it is within the range of T2 values for breast tumors. Removing fat information in the quantitative T2 maps could improve lesion conspicuity for better detection and characterization (11). No mask or threshold value was used to exclude fat signal in postprocessing. With multiple fat suppression modules applied during the acquisition, MR signal from adipose tissue tends to match to the dictionary entry with the lowest T1 and T2 values (60 msec for T1 and 10 msec for T2 in our current study), which appears to be dark (or suppressed) in the quantitative T1 and T2 maps.
There were several limitations in our study. First, the sample size of participants with breast cancer is small. Although the goal of our current study was to develop a robust three-dimensional MR fingerprinting technique for breast imaging, future studies are enabled and can be focused on larger cohorts for quantitative and noninvasive characterization of tumors. Substantial variations in T1 and T2 of the IDCs were observed in our study, which could be due to pathologic differences in the IDCs or partial volume effects with normal tissues. Advanced postprocessing methods, such as partial volume analysis by using MR fingerprinting, are required to address these questions with more participants with breast cancer (26). Second, the healthy participants in the control group were not age-matched to the participants with breast cancer, which should be considered when comparing the relaxometry results. In addition, the participants were not imaged at a specific phase of menstrual cycles. A few studies have been performed on T1 and T2 values in breast tissues and have shown mixed results on the effect of menstrual cycles on relaxation times, with some reporting an effect of cycle on these measurements and others reporting no effect (27–29). Further studies of these possible effects on MR fingerprinting measurements are needed to guide clinical studies. Third, although the accuracy of the proposed method was evaluated by using phantom experiments, no in vivo validation was performed due to prohibitively long acquisition times with the standard spin-echo method. Future work is needed to explore MR fingerprinting–relaxometry measurements in both healthy participants and participants with breast cancer. Fourth, as discussed above, further improvement in acquired resolution could aid in diminishing partial volume effects in the obtained measurements. Finally, the accuracy of T1 and T2 at the end of the slab is influenced by the section profile of the excitation pulse (two partitions at both ends in our current study). This can be further improved in the future by considering section profile in the Bloch equation simulations for MR fingerprinting processing.
In conclusion, a three-dimensional relaxometry method was developed for breast imaging by using the MR fingerprinting technique, allowing simultaneous and volumetric quantification of T1 and T2 relaxation times for breast tissues.
APPENDIX
Supported by Siemens Healthineers and National Institutes of Health (1R01DK098503, 1R01EB017219, 5R01EB016728, R01HL094, and 2KL2TR0004).
Disclosures of Conflicts of Interest: Y.C. Activities related to the present article: disclosed no relevant relationships. Activities not related to the present article: institution has grants/grants pending with Siemens. Other relationships: institution has patents (planned, pending, or issued). A.P. disclosed no relevant relationships. S.P. disclosed no relevant relationships. J.I.H. disclosed no relevant relationships. S.D. disclosed no relevant relationships. D.F.M. Activities related to the present article: disclosed no relevant relationships. Activities not related to the present article: disclosed no relevant relationships. Other relationships: author has patent (planned, pending, or issued) with Siemens Healthineers. D.M. Activities related to the present article: disclosed no relevant relationships. Activities not related to the present article: disclosed no relevant relationships. Other relationships: author has patents (planned, pending, or issued). J.B. disclosed no relevant relationships. N.S. Activities related to the present article: disclosed no relevant relationships. Activities not related to the present article: institution has grants/grants pending with the National Institutes of Health. Other relationships: author has patents (planned, pending, or issued) with Siemens Healthineers. M.A.G. Activities related to the present article: disclosed no relevant relationships. Activities not related to the present article: institution has grants/grants pending with Siemens. Other relationships: author has patents (planned, pending, or issued) with GE and Siemens. D.P. disclosed no relevant relationships. V.G. Activities related to the present article: disclosed no relevant relationships. Activities not related to the present article: institution has grants/grants pending with Siemens Healthineers; author received payment for travel/accommodations/meeting expenses unrelated to activities listed from Siemens Healthineers. Other relationships: author has patents (planned, pending, or issued) with Siemens Healthineers.
Abbreviation:
- IDC
- invasive ductal carcinoma
References
- 1.Kuhl CK. Current status of breast MR imaging. Part II. Clinical applications. Radiology 2007;244(3):672–691. [DOI] [PubMed] [Google Scholar]
- 2.Bonini RHM, Zeotti D, Saraiva LA, et al. Magnetization transfer ratio as a predictor of malignancy in breast lesions: preliminary results. Magn Reson Med 2008;59(5):1030–1034. [DOI] [PubMed] [Google Scholar]
- 3.Park SH, Moon WK, Cho N, et al. Diffusion-weighted MR imaging: pretreatment prediction of response to neoadjuvant chemotherapy in patients with breast cancer. Radiology 2010;257(1):56–63. [DOI] [PubMed] [Google Scholar]
- 4.Iacconi C, Giannelli M. Can diffusion-weighted MR imaging be used as a biomarker for predicting response to neoadjuvant chemotherapy in patients with locally advanced breast cancer? Radiology 2011;259(1):303–304. [DOI] [PubMed] [Google Scholar]
- 5.Sigmund EE, Cho GY, Kim S, et al. Intravoxel incoherent motion imaging of tumor microenvironment in locally advanced breast cancer. Magn Reson Med 2011;65(5):1437–1447. [DOI] [PMC free article] [PubMed] [Google Scholar]
- 6.Bolan PJ. Magnetic resonance spectroscopy of the breast: current status. Magn Reson Imaging Clin N Am 2013;21(3):625–639. [DOI] [PubMed] [Google Scholar]
- 7.Zaric O, Pinker K, Zbyn S, et al. Quantitative sodium MR imaging at 7 T: initial results and comparison with diffusion-weighted imaging in patients with breast tumors. Radiology 2016;280(1):39–48. [DOI] [PubMed] [Google Scholar]
- 8.Ross RJ, Thompson JS, Kim K, Bailey RA. Nuclear magnetic resonance imaging and evaluation of human breast tissue: preliminary clinical trials. Radiology 1982;143(1):195–205. [DOI] [PubMed] [Google Scholar]
- 9.McSweeney MB, Small WC, Cerny V, Sewell W, Powell RW, Goldstein JH. Magnetic resonance imaging in the diagnosis of breast disease: use of transverse relaxation times. Radiology 1984;153(3):741–744. [DOI] [PubMed] [Google Scholar]
- 10.Manton DJ, Chaturvedi A, Hubbard A, et al. Neoadjuvant chemotherapy in breast cancer: early response prediction with quantitative MR imaging and spectroscopy. Br J Cancer 2006;94(3):427–435 [Published correction appears in Br J Cancer 2006;94(10):1544.]. [DOI] [PMC free article] [PubMed] [Google Scholar]
- 11.Tan PC, Pickles MD, Lowry M, Manton DJ, Turnbull LW. Lesion T(2) relaxation times and volumes predict the response of malignant breast lesions to neoadjuvant chemotherapy. Magn Reson Imaging 2008;26(1):26–34. [DOI] [PubMed] [Google Scholar]
- 12.Ma D, Gulani V, Seiberlich N, et al. Magnetic resonance fingerprinting. Nature 2013;495(7440):187–192. [DOI] [PMC free article] [PubMed] [Google Scholar]
- 13.Yu AC, Badve C, Ponsky LE, et al. Development of a combined MR fingerprinting and diffusion examination for prostate cancer. Radiology 2017;283(3):729–738. [DOI] [PMC free article] [PubMed] [Google Scholar]
- 14.Hamilton JI, Jiang Y, Chen Y, et al. MR fingerprinting for rapid quantification of myocardial T1, T2, and proton spin density. Magn Reson Med 2017;77(4):1446–1458. [DOI] [PMC free article] [PubMed] [Google Scholar]
- 15.Chen Y, Jiang Y, Pahwa S, et al. MR fingerprinting for rapid quantitative abdominal imaging. Radiology 2016;279(1):278–286. [DOI] [PMC free article] [PubMed] [Google Scholar]
- 16.Azlan CA, Di Giovanni P, Ahearn TS, Semple SI, Gilbert FJ, Redpath TW. B1 transmission-field inhomogeneity and enhancement ratio errors in dynamic contrast-enhanced MRI (DCE-MRI) of the breast at 3T. J Magn Reson Imaging 2010;31(1):234–239. [DOI] [PubMed] [Google Scholar]
- 17.Brittain JH, Hu BS, Wright GA, Meyer CH, Macovski A, Nishimura DG. Coronary angiography with magnetization-prepared T2 contrast. Magn Reson Med 1995;33(5):689–696. [DOI] [PubMed] [Google Scholar]
- 18.McGivney DF, Pierre E, Ma D, et al. SVD compression for magnetic resonance fingerprinting in the time domain. IEEE Trans Med Imaging 2014;33(12):2311–2322. [DOI] [PMC free article] [PubMed] [Google Scholar]
- 19.Rakow-Penner R, Daniel B, Yu H, Sawyer-Glover A, Glover GH. Relaxation times of breast tissue at 1.5T and 3T measured using IDEAL. J Magn Reson Imaging 2006;23(1):87–91. [DOI] [PubMed] [Google Scholar]
- 20.Kuhl CK, Schrading S, Strobel K, Schild HH, Hilgers RD, Bieling HB. Abbreviated breast magnetic resonance imaging (MRI): first postcontrast subtracted images and maximum-intensity projection-a novel approach to breast cancer screening with MRI. J Clin Oncol 2014;32(22):2304–2310. [DOI] [PubMed] [Google Scholar]
- 21.Liu L, Yin B, Geng DY, Lu YP, Peng WJ. Changes of T2 relaxation time from neoadjuvant chemotherapy in breast cancer lesions. Iran J Radiol 2016;13(3):e24014. [DOI] [PMC free article] [PubMed] [Google Scholar]
- 22.Panda A, Ghodasara S, Chen Y, et al. Breast 3D magnetic resonance fingerprinting relaxometry: utility in measuring early response to neo-adjuvant chemotherapy in breast cancer [abstr]. In: Radiological Society of North America scientific assembly and annual meeting program. Oak Brook, Ill: Radiological Society of North America, 2018; accepted. [Google Scholar]
- 23.Liu L, Yin B, Shek K, et al. Role of quantitative analysis of T2 relaxation time in differentiating benign from malignant breast lesions. J Int Med Res 2018;46(5):1928–1935. [DOI] [PMC free article] [PubMed] [Google Scholar]
- 24.Ostenson J, Robison RK, Zwart NR, Welch EB. Multi-frequency interpolation in spiral magnetic resonance fingerprinting for correction of off-resonance blurring. Magn Reson Imaging 2017;41:63–72. [DOI] [PMC free article] [PubMed] [Google Scholar]
- 25.Börnert P, Stuber M, Botnar RM, Kissinger KV, Manning WJ. Comparison of fat suppression strategies in 3D spiral coronary magnetic resonance angiography. J Magn Reson Imaging 2002;15(4):462–466. [DOI] [PubMed] [Google Scholar]
- 26.McGivney D, Deshmane A, Jiang Y, et al. Bayesian estimation of multicomponent relaxation parameters in magnetic resonance fingerprinting. Magn Reson Med 2018;80(1):159–170. [DOI] [PMC free article] [PubMed] [Google Scholar]
- 27.Dean KI, Majurin ML, Komu M. Relaxation times of normal breast tissues: changes with age and variations during the menstrual cycle. Acta Radiol 1994;35(3):258–261. [PubMed] [Google Scholar]
- 28.Delille JP, Slanetz PJ, Yeh ED, Kopans DB, Garrido L. Physiologic changes in breast magnetic resonance imaging during the menstrual cycle: perfusion imaging, signal enhancement, and influence of the T1 relaxation time of breast tissue. Breast J 2005;11(4):236–241. [DOI] [PubMed] [Google Scholar]
- 29.Martin B, el Yousef SJ. Transverse relaxation time values in MR imaging of normal breast during menstrual cycle. J Comput Assist Tomogr 1986;10(6):924–927. [DOI] [PubMed] [Google Scholar]
Associated Data
This section collects any data citations, data availability statements, or supplementary materials included in this article.


