Abstract
Purpose
To investigate ferumoxytol-enhanced MRI as a noninvasive imaging biomarker of macrophages in adults with high-grade gliomas.
Materials and Methods
In this prospective study, adults with high-grade gliomas were enrolled between July 2015 and July 2017. Each participant was administered intravenous ferumoxytol (5 mg/kg) and underwent 3.0-T MRI 24 hours later. Two sites in each tumor were selected for intraoperative sampling on the basis of the degree of ferumoxytol-induced signal change. Susceptibility and the relaxation rates R2* (1/T2*) and R2 (1/T2) were obtained by region-of-interest analysis by using the respective postprocessed maps. Each sample was stained with Prussian blue, CD68, CD163, and glial fibrillary acidic protein. Pearson correlation and linear mixed models were performed to assess the relationship between imaging measurements and number of 400× magnification high-power fields with iron-containing macrophages.
Results
Ten adults (four male participants [mean age, 65 years ± 9 {standard deviation}; age range, 57–74 years] and six female participants [mean age, 53 years ± 12 years; age range, 32–65 years]; mean age of all participants, 58 years ± 12 [age range, 32–74 years]) with high-grade gliomas were included. Significant positive correlations were found between susceptibility, R2*, and R2’ and the number of high-power fields with CD163-positive (r range, 0.64–0.71; P < .01) and CD68-positive (r range, 0.55–0.57; P value range, .01–.02) iron-containing macrophages. No significant correlation was found between R2 and CD163-positive (r = 0.33; P = .16) and CD68-positive (r = 0.24; P = .32) iron-containing macrophages. Similar significance results were obtained with linear mixed models. At histopathologic analysis, iron particles were found only in macrophages; none was found in glial fibrillary acidic protein–positive tumor cells.
Conclusion
MRI measurements of susceptibility, R2*, and R2’ (R2* – R2) obtained after ferumoxytol administration correlate with iron-containing macrophage concentration, and this shows their potential as quantitative imaging markers of macrophages in malignant gliomas.
© RSNA, 2018
Summary
MRI measurements of susceptibility and R2* (1/T2*) obtained after ferumoxytol administration correlate with iron-containing macrophage concentration in high-grade gliomas in vivo.
Implications for Patient Care
■ Ferumoxytol-enhanced MRI with quantitative susceptibility and relaxation rate mapping shows potential as a noninvasive diagnostic tool for the detection and quantification of iron-containing macrophages in malignant gliomas in adults.
■ Ferumoxytol-associated iron particles localized to intratumoral macrophages and not to tumor cells or astrocytes at histopathologic examination, suggesting the role of this contrast agent for macrophage imaging in malignant gliomas in adults.
Introduction
Macrophages are a key component of the tumor microenvironment and play a substantial role in tumor angiogenesis, progression, and metastasis (1–4). An association between tumor-associated macrophages and poor prognosis has been shown in several cancers including glioblastoma (5). Macrophages also play an important role in tumor response to treatment, and studies (2,6,7) show a higher number of microglia and macrophages in brain tumors after chemotherapy and radiation therapy.
Because of the emergence of tumor-associated macrophage–targeted cancer immunotherapies and the identification of tumor-associated macrophages as a prognostic biomarker for overall survival, it is important to develop diagnostic tools that can detect and quantify tumor-associated macrophages in vivo. Beyond tissue sampling, to our knowledge, there is no clinically available test to assess tumor-associated macrophages in brain tumors. The current reference standard for assessing tumor response to therapy is to evaluate changes in tumor size at gadolinium chelate–enhanced MRI, but increased tumor size in the early phase after initiation of immunotherapy may not always indicate tumor progression.
Ferumoxytol, an iron oxide nanoparticle, has shown efficacy as a contrast agent for macrophage imaging in preclinical experiments (8–10). In tumors, ferumoxytol gradually crosses the disrupted blood-brain barrier and is phagocytosed by macrophages in the interstitium, producing a hypointense T2 and T2* signal, which can be measured at MRI (11). Quantitative imaging measurements of susceptibility, the relaxation rates R2* (1/T2*) and R2 (1/T2), and R2' (R2* – R2) have been used to quantify the amount of iron in the brain (12–17). Whereas the use of ferumoxytol for macrophage imaging has been studied extensively in animals, there are limited data in human brain tumors. We hypothesized that MRI-derived measurements of high-grade gliomas obtained 24 hours after administration of ferumoxytol would correlate with iron-containing macrophage concentration at histopathologic examination. The purpose of this study was to demonstrate the clinical feasibility and applicability of ferumoxytol-enhanced MRI for the detection and quantification of macrophages in adults with high-grade gliomas.
Materials and Methods
This prospective cohort study was approved by our institutional review board, and written informed consent with Health Insurance Portability and Accountability Act authorization was obtained for each study participant. There was no industry funding or support for this study. Authors maintained control of all data and information submitted for publication.
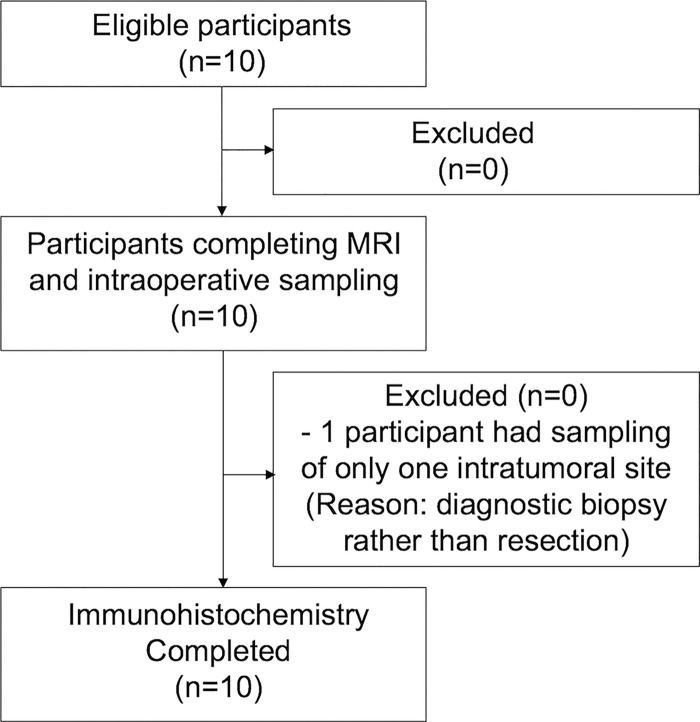
We evaluated adults with newly diagnosed and recurrent high-grade gliomas (World Health Organization grade III or IV gliomas) between July 2015 and July 2017. Inclusion criteria were as follows: age, 18 years or older; brain mass at diagnostic MRI suspicious for high-grade glioma; and subsequent tumor resection or biopsy as part of clinical care. Exclusion criteria included severe coexisting systemic disease, contraindication to MRI, hemosiderosis or hemochromatosis, hypersensitivity to iron products, and pregnancy. Ten study participants were consecutively enrolled (Fig 1). Clinical and pathologic information was obtained by the electronic medical record.
Figure 1:
Flowchart of study participants. Ten participants were consecutively enrolled and completed all study procedures. None were excluded.
MRI Protocol
Each participant received intravenous ferumoxytol infusion (5 mg/kg) over a 15-minute period by trained staff, and participants were subsequently monitored for signs of anaphylactic reaction for 30 minutes after infusion. After approximately 24 hours, each participant underwent the study MRI, which was performed on a single 3.0-T imager (Discovery 750; GE Healthcare, Milwaukee, Wis) equipped with an eight-channel head coil. Sequences, all performed after administration of ferumoxytol, were performed as follows: before administration of gadolinium chelate, axial three-dimensional T1-weighted brain volume (BRAVO; GE Healthcare) sequence; flow-compensated and parallel-imaging accelerated axial three-dimensional multiecho gradient-recalled echo sequence (six echo times, 3–35 msec; resolution, 0.6 × 0.9 × 1.5 mm3; acceleration factor of two; 5-minute imaging time); axial thin-section T2-weighted sequence (repetition time msec/echo time msec, 6820–9400/92.6–103.5; section thickness, 2 mm; 0-mm gap; 256 × 256 mm matrix; field of view, 240 mm); axial two-dimensional T2-weighted dual-echo fast-spin-echo sequence (4000–6000/38.2–43.8 and 100–110; section thickness, 4 mm; 0-mm gap; 384 × 256 mm matrix field of view, 220 mm); and axial three-dimensional T1-weighted brain volume (BRAVO; GE Healthcare) sequence performed after administration of gadolinium chelate (intravenous administration of 0.1 mmol/kg of gadobenate dimeglumine [Multihance; Bracco Diagnostics, Princeton, NJ]). After completion of MRI, raw data were automatically reconstructed by using a compiled and threaded Matlab code (version 9.3; MathWorks, Natick, Mass), and postprocessed images were immediately sent to the picture archiving and communication system. Quantitative susceptibility mapping images were generated from the multiecho gradient-recalled echo data by using a previously described (16,18,19) morphologic enabled dipole inversion algorithm. R2* and R2 maps were generated from multiecho gradient-recalled echo and T2 dual-echo fast-spin-echo data, respectively, by using monoexponential fit of echoes (Fig 2).
Figure 2:
Axial images in a 63-year-old female participant with right temporo-occipital glioblastoma. T2-weighted images of the glioblastoma, A, before and, B, after ferumoxytol administration. T2 hypointense signal is observed within the tumor (arrows) after delayed ferumoxytol infusion. Corresponding, C, quantitative susceptibility mapping, D, R2*, and, E, R2 images of the brain tumor.
Image Analysis
A board-certified neuroradiologist (M.I., with a certificate of added qualification and 8 years of experience in neuro-oncologic imaging) and board-certified neurosurgeon (G.L., with 8 years of experience in neurosurgical techniques) identified two different sites in the tumor of each participant at the study MRI for intraoperative sampling. One site was chosen in an area of T2 or T2* hypointense signal that reflected strong ferumoxytol-induced signal change. Another site was chosen in an area of less T2 or T2* hypointense signal that reflected less (ie, weaker) ferumoxytol-induced signal change. Selection of sites sought to avoid regions of brain eloquence and other regions deemed unsafe for sampling. In addition, areas of intratumoral hemorrhage, which were identified on T2-weighted and/or two-dimensional gradient-recalled echo images that were obtained as part of the before-study diagnostic MRI, were visually localized and avoided at the study MRI to mitigate the confounding effects of pre-existing blood.
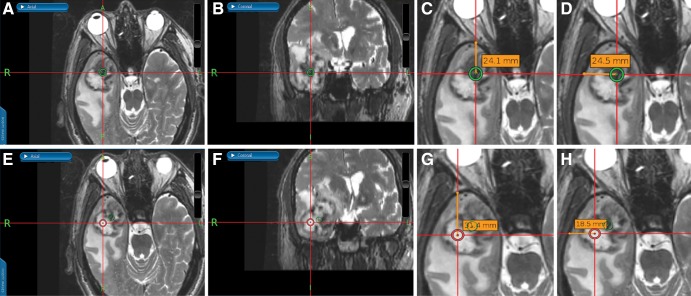
The target sites for intraoperative sampling were marked on thin-section T2-weighted images, which were then merged with T1-weighted brain volume (BRAVO; GE Healthcare) images obtained after administration of gadolinium chelate on the surgical navigation system (StealthStation S7 and S8; Medtronic, Minneapolis, Minn). These regions of interests (ROIs) were saved as image captures (Fig 3). Three samples were then acquired at operation from each of the two marked sites for a total of six samples per participant.
Figure 3:
Images from an intraoperative surgical navigation system in a 74-year-old male participant with right temporal gliosarcoma. Stereotactic ferumoxytol-enhanced, A, axial and, B, coronal thin-section T2-weighted images show a site of strong ferumoxytol-induced signal change (low signal) within the tumor that was chosen for sampling, as denoted by the green circle. C, D, G, H, During surgery, measured perpendicular lines were drawn from the center of the target region of interest (ROI) to the calvarium for localization of the ROI during image analysis. Stereotactic ferumoxytol-enhanced, E, axial and, F, coronal thin-section T2-weighted images show a site of weak ferumoxytol-induced signal change (high signal) within the same tumor, as denoted by the red circle, that was also sampled.
By using software (OsiriX MD version 7.0.4; Pixmeo Sarl, Bernex, Switzerland), circular ROIs with 3.5-mm diameter were manually reproduced at the sampled sites on the T2-weighted images. T2-based ROIs were then transferred onto automatically aligned quantitative susceptibility mapping, R2*, and R2 images. The values generated by an ROI on quantitative susceptibility mapping, R2*, and R2 images represented the mean susceptibility, R2*, and R2 values, respectively. R2’ values were obtained by taking the difference between R2* and R2. Susceptibility difference values were acquired by normalizing the target ROI to an ROI in the contralateral parietal white matter; normalization was necessary because the input gradient-recalled echo phase is a relative and not an absolute measure (13,14). R2* and R2 values did not require normalization because these maps provide absolute values (14). See Appendix E1 (online) for details of the ROI methodologic analysis.
Immunohistochemistry Techniques and Tissue Analysis
We used dual-staining immunohistochemistry techniques; see Appendix E1 (online) for details.
Two board-certified neuropathologists (P.S. and H.V., with 2 and 31 years of neuropathology-specific immunohistochemistry experience, respectively) were blinded to clinical and MRI results but not to the types of stained sections that were evaluated. Scoring was performed by consensus agreement in a single session, with the team providing only a single score for each sample. Because iron particles were not always uniformly distributed throughout the samples, the following semiquantitative scoring system for determining iron-containing macrophage concentration per sample was used: 0, no iron-containing macrophage on any 400× magnification high-power field across the entire sample; 1, one high-power field with iron-containing macrophages; 2, two high-power fields with iron-containing macrophages; and 3, three or more high-power fields with iron-containing macrophages.
Statistical Analysis
Pearson correlation analysis was used to determine the relationship between mean susceptibility, R2*, R2, and R2’ values and the number of high-power fields with iron-containing macrophages. In the majority of participants, three tissue specimens were obtained at each sampled site. Iron-containing macrophage load was reduced to a single score assessment for each sample site by taking the majority score of the three measurements. To account for having repeated samples from a given participant, we performed linear mixed models incorporating the participant as a random effect. To estimate the statistical significance of the effects, we fit null models in which imaging measurements were not included and compared them to the full models by performing likelihood ratio tests and using the analysis of variance function, as suggested by Bolker et al (20). For Pearson correlation and linear mixed models analyses, a P value less than .05 was considered to indicate statistical significance. Analyses were performed with software (R version 3.4.0; R Foundation for Statistical Computing, Vienna, Austria), with mixed models performed by using the lmer function in the lme4 package (version 1.1–17) in R.
Results
Ten participants (four men [mean age, 65 years ± 9 {standard deviation}; age range, 57–74 years] and six women [mean age, 53 years ± 12; age range, 32–65 years]; mean age of all participants, 58 years ± 12 [age range, 32–74 years]) with high-grade gliomas were included. Study participant demographics and clinical and pathologic information are shown in Table 1.
Table 1:
Study Participant Demographics and Clinical and Pathologic Information
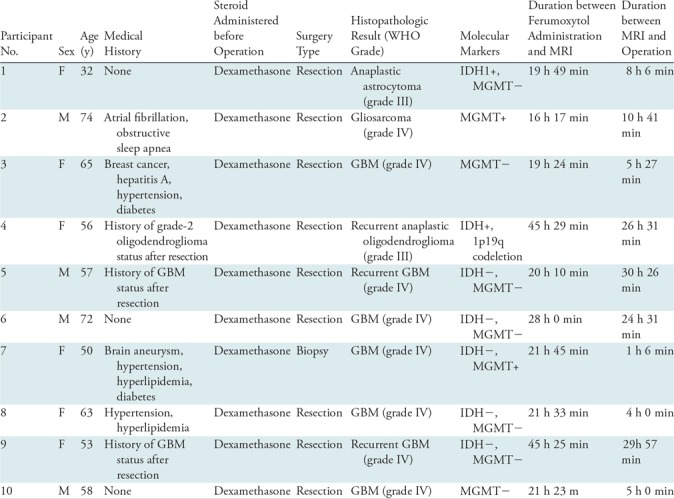
Note.—The mean duration between ferumoxytol infusion and study MRI was 25 hours 55 minutes; the mean duration between study MRI and operation was 14 hours 35 minutes. GBM = glioblastoma, IDH+ = isocitrate dehydrogenase-mutant, IDH– = isocitrate dehydrogenase-wildtype, MGMT+ = O-6-methylguanine-DNA methyltransferase-methylated, MGMT– = O-6-methylguanine-DNA methyltransferase-unmethylated, WHO = World Health Organization.
Six tissue specimens were acquired per participant in nine participants, with only one specimen obtained in participant 7 (who received a biopsy for diagnosis) because of safety reasons. In participant 4, only four tissue specimens could be successfully stained because of scant material at one site. No participants experienced any adverse reactions from ferumoxytol administration.
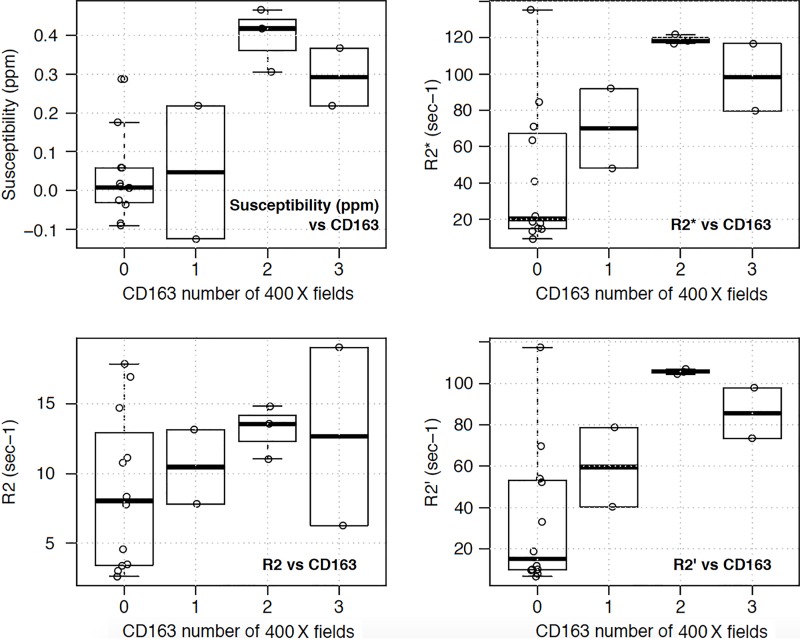
There were significant positive correlations between the susceptibility, R2*, and R2’ values and the number of high-power fields with CD163-positive (r range, 0.64–0.71; P < .01) (Table 2, Fig 4a) and CD68-positive (r range, 0.55–0.57; P value range, .01–.02) iron-containing macrophages (Table 2, Fig 4b). No significant correlation was found between R2 values and CD163-positive(r = 0.33; P = .16) (Table 2, Fig 4a) and CD68-positive (r = 0.24; P = .32) iron-containing macrophages (Table 2, Fig 4b). Linear mixed models also produced similar results, with statistical significance found between susceptibility, R2*, and R2’ values and CD163-positive (P < .001–.002) and CD68-positive (P = .006–.01) iron-containing macrophages but no significance found between R2 values and CD163-positive (P = .13) and CD68-positive (P = .29) iron-containing macrophages (Table 2). Tables E1 and E2 (online) show the raw quantitative MRI data and histopathologic scores, respectively.
Table 2:
Relationship between Imaging Measurements (Susceptibility, R2*, R2, and R2’) and CD163-positive and CD68-positive Iron-containing Macrophages

Note.—Linear mixed models incorporated the participant as a random effect to account for having multiple samples from a given participant. Statistical significance was assessed at P < .05 for both analyses. CD68+ = CD68 positive, CD163+ = CD163 positive, Fe+ = iron containing, R’ = R2* – R2.
*Data are ± standard error.
†P values from likelihood ratio test comparing fitted variables to null model for linear mixed models.
Figure 4a:
Box plots of relationship between imaging measurements (susceptibility, R2*, R2, and R2’) and number of 400× magnification high-power fields with (a) CD163 and (b) CD68 iron-containing macrophages. Significant positive correlations were found between the susceptibility, R2*, and R2’ (R2* – R2) values and the number of high-power fields with both CD163 (P < .01) and CD68 iron-containing macrophages (P value range, .01–.02). No significant correlation was found between R2 values and CD163 (P = .16) and CD68 (P = .32) iron-containing macrophages. Similar significance results were obtained with linear mixed models. Each open circle represents one tissue sample.
Figure 4b:
Box plots of relationship between imaging measurements (susceptibility, R2*, R2, and R2’) and number of 400× magnification high-power fields with (a) CD163 and (b) CD68 iron-containing macrophages. Significant positive correlations were found between the susceptibility, R2*, and R2’ (R2* – R2) values and the number of high-power fields with both CD163 (P < .01) and CD68 iron-containing macrophages (P value range, .01–.02). No significant correlation was found between R2 values and CD163 (P = .16) and CD68 (P = .32) iron-containing macrophages. Similar significance results were obtained with linear mixed models. Each open circle represents one tissue sample.
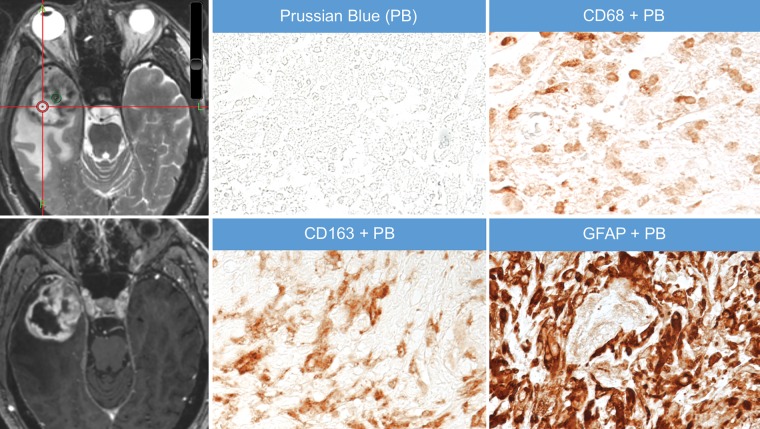
Mean size of the gross tissue specimens, measured in three dimensions by a neuropathologist (H.V.), was 9 × 6 × 3 mm (range, 5 × 4 × 2 mm to 25 × 10 × 4 mm). At histopathologic examination, iron particles were found only in CD68-positive and CD163-positive macrophages, although not all macrophages contained iron particles; no iron particles were found in glial fibrillary acidic protein–positive cells (Figs 5, 6).
Figure 5:
Images in a 65-year-old female participant with right temporal glioblastoma. Axial thin-section T2-weighted image obtained after administration of ferumoxytol shows an area of strong ferumoxytol-induced signal change within the tumor (green circle) that was sampled at surgery and stained for iron particles by using Prussian blue (PB) staining. Adjacent 5-μm-thick sections were dual stained with PB and antibodies to the macrophage marker CD68 or CD163; these stains show colocalization of the iron particles (blue particles) with CD163-positive and CD68-positive macrophages (brown cells). Finally, an adjacent section was dual-stained with PB and antibodies to the astrocyte marker glial fibrillary acidic protein (GFAP) to assess for iron in astrocytes (brown cells). Iron particles were not found not in GFAP-positive astrocytes. The bottom left image is gadolinium enhanced. Also shown is a corresponding axial T1-weighted brain volume image of the tumor obtained after administration of gadolinium chelate. A = anterior, L = left.
Figure 6:
Images in a 74-year-old male participant with right temporal gliosarcoma (same participant as in Fig 3). Axial thin-section T2-weighted image obtained after administration of ferumoxytol shows an area of weak ferumoxytol-induced signal change within the tumor (red circle) that was sampled at surgery and stained for iron particles by using Prussian blue (PB). The green circle represents marking for a site of strong ferumoxytol-induced signal change, which is not shown here. Adjacent 5-μm-thick sections were dual stained with PB and antibodies to the macrophage marker CD68 or CD163 or the astrocyte marker glial fibrillary acidic protein (GFAP). Although some CD68-positive and CD163-positive macrophages and abundant GFAP-positive astrocytes are present, no iron particles (blue particles observed in Fig 5) are seen. Corresponding axial T1-weighted brain volume image of the tumor obtained after administration of gadolinium chelate is also shown. Of note, the area of low ferumoxytol signal depicted in this figure corresponded to solid tumor at histopathologic examination even though the target region of interest was located in a necrotic-appearing area on MRI. A = anterior, L = left, P = posterior.
Discussion
Our results show significant moderate-to-strong positive correlations between delayed ferumoxytol-enhanced susceptibility, R2*, and R2’ values and the number of high-power fields containing CD163-positive and CD68-positive iron-containing macrophages in adults with high-grade gliomas. No significant correlation was found between R2 values and iron-containing macrophage concentration. Statistical significance comparisons between imaging parameters and iron-containing macrophage load did not change after accounting for multiple samples obtained from a given participant. At histopathologic examination, iron particles were found only in macrophages, and none were detected in glial fibrillary acidic protein–positive tumor cells or astrocytes.
Quantitative susceptibility mapping and R2* have been used to quantify the amount of iron present in the brains of healthy individuals and in patients with Parkinson disease, Alzheimer disease, and multiple sclerosis (13–17,21). Our results are consistent with these studies, two of which were postmortem examinations (14,17), and it shows a reliable correlation between both susceptibility and R2* and iron-rich regions in the brain. It is not surprising that R2’, a parameter that is associated with intrinsic tissue properties, also showed a significant correlation with iron-containing macrophages in our study because according to MR relaxation theory R2’ = R2* – R2 (17). However, whereas we did see higher R2 values with higher scores of iron-containing macrophages, this did not reach statistical significance. Although the exact explanation for this is unclear, this may relate to differences in concentration or distribution of free-water molecules in the measured tissue or differential influence by ferumoxytol or other paramagnetic ions (12,15). This may also not be entirely unexpected; Langkammer et al (17) found a higher sensitivity of R2* compared with R2 to variations in brain iron concentration in vivo. Finally, iron particles were found only in macrophages in our study, which suggests the applicability of quantitative susceptibility and relaxation rate mapping techniques for measuring iron-containing macrophage concentration in the neuro-oncology setting after administration of ferumoxytol.
The role of macrophages in malignant gliomas has yet to be fully elucidated, but there is growing evidence that tumor-associated macrophages influence overall survival (1,22), making macrophages an important target for treatment. Studies have shown positive tumor responses with macrophage-targeted immunotherapy agents, such as anti-CD47 in malignant pediatric brain tumors (23) and antistromal cell–derived factor-1 in glioblastoma (10). Recently, monoclonal antibodies with programmed cell death-1/programmed death ligand-1 blockade activity, which primarily targets T-cell regulation, have also been shown to promote macrophage phagocytosis in mice tumor models (24). The antitumor responses in these studies were associated with a significant influx of macrophages within the tumor, which can be potentially detected, quantified, and monitored with ferumoxytol-enhanced MRI.
Important limitations of this study should be considered. First, the sample size was small, limiting assessment of sensitivity, specificity, and diagnostic accuracy of ferumoxytol-enhanced MRI for helping to predict iron-containing macrophage infiltration. Second, as with any image-guided surgical procedure, sampling bias was unavoidable. To improve the likelihood of accurately sampling the target ROI, three samples were obtained at each site. Also to minimize errors resulting from ROI placement or intraoperative brain movement, we obtained tissue samples that were slightly larger than the image-based ROIs. Third, the presence of intratumoral hemorrhage may have affected quantitative susceptibility mapping and relaxation rate maps; whereas we did not have multiecho gradient-recalled echo images obtained before administration of ferumoxytol for comparison, we did use T2-weighted and two-dimensional gradient-recalled echo images at the MRI performed before the start of the study to avoid selecting areas of intratumoral susceptibility on the study MR image for sampling.
In conclusion, we showed the feasibility and applicability of ferumoxytol-enhanced MRI for measuring iron-containing macrophage concentration in high-grade gliomas in adults. Susceptibility and relaxation rate measurements (especially R2*) showed moderate-to-strong correlations with iron-containing macrophage load at histopathologic analysis. Accordingly, these MRI-based measurements show promise as quantitative imaging biomarkers of macrophages, particularly because ferumoxytol-associated iron particles were found only in macrophages in this study. A future prospective study with a larger sample size is needed to validate these results and confirm the predictive capability of ferumoxytol-enhanced MRI for the detection and quantification of macrophages in brain tumors, especially in the immunotherapy setting.
APPENDIX
Study supported by Stanford Department of Radiology Angel Grant. M.I. supported by RSNA Research and Education Foundation (Research Scholar Grant no. RSCH1515) and Musella Foundation for Brain Tumor Research and Information. S.C. and K.W.Y. supported by Dana Foundation. H.E.D.L. and M.M. supported by the National Institutes of Health (grant no. R21CA190196, R01HD081123).
Disclosures of Conflicts of Interest: M.I. disclosed no relevant relationships. P.S. disclosed no relevant relationships. S.H. disclosed no relevant relationships. A.G. disclosed no relevant relationships. P.R. disclosed no relevant relationships. G.H. disclosed no relevant relationships. G.L. disclosed no relevant relationships. R.T. disclosed no relevant relationships. M.M. disclosed no relevant relationships. H.E.D.L. disclosed no relevant relationships. H.V. disclosed no relevant relationships. M.W. Activities related to the present article: disclosed no relevant relationships. Activities not related to the present article: disclosed money paid to author for consultancies from MoreHealth, Magnetic Insight, Icometrix, and Nines. Other relationships: disclosed no relevant relationships. S.C. disclosed no relevant relationships. K.W.Y. disclosed no relevant relationships.
Abbreviation:
- ROI
- region of interest
References
- 1.Zhai H, Heppner FL, Tsirka SE. Microglia/macrophages promote glioma progression. Glia 2011;59(3):472–485. [DOI] [PMC free article] [PubMed] [Google Scholar]
- 2.Leblond MM, Pérès EA, Helaine C, et al. M2 macrophages are more resistant than M1 macrophages following radiation therapy in the context of glioblastoma. Oncotarget 2017;8(42):72597–72612. [DOI] [PMC free article] [PubMed] [Google Scholar]
- 3.Annovazzi L, Mellai M, Bovio E, Mazzetti S, Pollo B, Schiffer D. Microglia immunophenotyping in gliomas. Oncol Lett 2018;15(1):998–1006. [DOI] [PMC free article] [PubMed] [Google Scholar]
- 4.Nishie A, Ono M, Shono T, et al. Macrophage infiltration and heme oxygenase-1 expression correlate with angiogenesis in human gliomas. Clin Cancer Res 1999;5(5):1107–1113. [PubMed] [Google Scholar]
- 5.Pollard JW. Tumour-educated macrophages promote tumour progression and metastasis. Nat Rev Cancer 2004;4(1):71–78. [DOI] [PubMed] [Google Scholar]
- 6.Cohen JV, Alomari AK, Vortmeyer AO, et al. Melanoma Brain Metastasis Pseudoprogression after Pembrolizumab Treatment. Cancer Immunol Res 2016;4(3):179–182. [DOI] [PMC free article] [PubMed] [Google Scholar]
- 7.Ichihara E, Kiura K, Takigawa N, et al. Pseudoprogression of lung cancer after concomitant chemoradiotherapy. Jpn J Clin Oncol 2008;38(2):140–142. [DOI] [PubMed] [Google Scholar]
- 8.Moore A, Marecos E, Bogdanov A, Jr, Weissleder R. Tumoral distribution of long-circulating dextran-coated iron oxide nanoparticles in a rodent model. Radiology 2000;214(2):568–574. [DOI] [PubMed] [Google Scholar]
- 9.McConnell HL, Schwartz DL, Richardson BE, Woltjer RL, Muldoon LL, Neuwelt EA. Ferumoxytol nanoparticle uptake in brain during acute neuroinflammation is cell-specific. Nanomedicine (Lond) 2016;12(6):1535–1542. [DOI] [PMC free article] [PubMed] [Google Scholar]
- 10.Deng L, Stafford JH, Liu SC, et al. SDF-1 Blockade enhances anti-VEGF therapy of glioblastoma and can be monitored by MRI. Neoplasia 2017;19(1):1–7. [DOI] [PMC free article] [PubMed] [Google Scholar]
- 11.Daldrup-Link HE, Golovko D, Ruffell B, et al. MRI of tumor-associated macrophages with clinically applicable iron oxide nanoparticles. Clin Cancer Res 2011;17(17):5695–5704. [DOI] [PMC free article] [PubMed] [Google Scholar]
- 12.Girard OM, Ramirez R, McCarty S, Mattrey RF. Toward absolute quantification of iron oxide nanoparticles as well as cell internalized fraction using multiparametric MRI. Contrast Media Mol Imaging 2012;7(4):411–417. [DOI] [PMC free article] [PubMed] [Google Scholar]
- 13.Deistung A, Schäfer A, Schweser F, Biedermann U, Turner R, Reichenbach JR. Toward in vivo histology: a comparison of quantitative susceptibility mapping (QSM) with magnitude-, phase-, and R2*-imaging at ultra-high magnetic field strength. Neuroimage 2013;65:299–314. [DOI] [PubMed] [Google Scholar]
- 14.Langkammer C, Schweser F, Krebs N, et al. Quantitative susceptibility mapping (QSM) as a means to measure brain iron? A post mortem validation study. Neuroimage 2012;62(3):1593–1599. [DOI] [PMC free article] [PubMed] [Google Scholar]
- 15.Barbosa JH, Santos AC, Tumas V, et al. Quantifying brain iron deposition in patients with Parkinson’s disease using quantitative susceptibility mapping, R2 and R2. Magn Reson Imaging 2015;33(5):559–565. [DOI] [PubMed] [Google Scholar]
- 16.Langkammer C, Liu T, Khalil M, et al. Quantitative susceptibility mapping in multiple sclerosis. Radiology 2013;267(2):551–559. [DOI] [PMC free article] [PubMed] [Google Scholar]
- 17.Langkammer C, Krebs N, Goessler W, et al. Quantitative MR imaging of brain iron: a postmortem validation study. Radiology 2010;257(2):455–462. [DOI] [PubMed] [Google Scholar]
- 18.Liu T, Khalidov I, de Rochefort L, et al. A novel background field removal method for MRI using projection onto dipole fields (PDF). NMR Biomed 2011;24(9):1129–1136. [DOI] [PMC free article] [PubMed] [Google Scholar]
- 19.Liu J, Liu T, de Rochefort L, et al. Morphology enabled dipole inversion for quantitative susceptibility mapping using structural consistency between the magnitude image and the susceptibility map. Neuroimage 2012;59(3):2560–2568. [DOI] [PMC free article] [PubMed] [Google Scholar]
- 20.Bolker BM, Brooks ME, Clark CJ, et al. Generalized linear mixed models: a practical guide for ecology and evolution. Trends Ecol Evol 2009;24(3):127–135. [DOI] [PubMed] [Google Scholar]
- 21.Kim HG, Park S, Rhee HY, et al. Quantitative susceptibility mapping to evaluate the early stage of Alzheimer’s disease. Neuroimage Clin 2017;16:429–438. [DOI] [PMC free article] [PubMed] [Google Scholar]
- 22.Engler JR, Robinson AE, Smirnov I, et al. Increased microglia/macrophage gene expression in a subset of adult and pediatric astrocytomas. PloS One 2012;7(8):e43339. [DOI] [PMC free article] [PubMed] [Google Scholar]
- 23.Gholamin S, Mitra SS, Feroze AH, et al. Disrupting the CD47-SIRPα anti-phagocytic axis by a humanized anti-CD47 antibody is an efficacious treatment for malignant pediatric brain tumors. Sci Transl Med 2017;9(381):eaaf2968. [DOI] [PubMed] [Google Scholar]
- 24.Gordon SR, Maute RL, Dulken BW, et al. PD-1 expression by tumour-associated macrophages inhibits phagocytosis and tumour immunity. Nature 2017;545(7655):495–499. [DOI] [PMC free article] [PubMed] [Google Scholar]
Associated Data
This section collects any data citations, data availability statements, or supplementary materials included in this article.


