Abstract
Purpose
To assess the feasibility of four-dimensional (4D) flow MRI as a noninvasive imaging marker for stratifying the risk of variceal bleeding in patients with liver cirrhosis.
Materials and Methods
This study recruited participants scheduled for both liver MRI and gastroesophageal endoscopy. Risk of variceal bleeding was assessed at endoscopy by using a three-point scale: no varices, low risk, and high risk requiring treatment. Four-dimensional flow MRI was used to create angiograms for evaluating visibility of varices and to measure flow volumes in main portal vein (PV), superior mesenteric vein, splenic vein (SV), and azygos vein. Fractional flow changes in PV and SV were calculated to quantify shunting (outflow) from PV and SV into varices. Logistic analysis was used to identify the independent indicator of high-risk varices.
Results
There were 23 participants (mean age, 52.3 years; age range, 25–75 years), including 14 men (mean age, 51.7 years; age range, 25–75 years) and nine women (mean age, 53.2 years; age range, 31–72 years) with no varices (n = 8), low-risk varices (n = 8), and high-risk varices (n = 7) determined at endoscopy. Four-dimensional flow MRI–based angiography helped radiologists to view varices in four of 15 participants with varices. Independent indicators of high-risk varices were flow volume in the azygos vein greater than 0.1 L/min (P = .034; 100% sensitivity [seven of seven] and 62% specificity [10 of 16]) and fractional flow change in PV of less than 0 (P < .001; 100% sensitivity [seven of seven] and 94% specificity [15 of 16]).
Conclusion
Azygos flow greater than 0.1 L/min and portal venous flow less than the sum of splenic and superior mesenteric vein flow are useful markers to stratify the risk of gastroesophageal varices bleeding in patients with liver cirrhosis.
© RSNA, 2018
Summary
The quantitative flow measurements at four-dimensional flow MRI in the azygos vein and fractional flow change in the portal vein are indicators of gastroesophageal varices at high risk of bleeding.
Implication for Patient Care
■ By including four-dimensional flow MRI in the MR protocol for the patients with cirrhosis, it may be possible to reduce the frequency of endoscopic screening for gastroesophageal varices.
Introduction
Portal hypertension is observed in patients with end-stage chronic liver disease leading gastroesophageal varices. Rupture of the varices is a dreaded complication in patients with cirrhosis (1,2).
Hepatic venous pressure gradient, an invasive measurement of portal pressure, is an important marker for identification of patients at risk for variceal hemorrhage. Patients with hepatic venous pressure gradient greater than 12 mm Hg are known to be at elevated risk of variceal rupture with high sensitivity (3). However, the majority of patients with hepatic venous pressure gradient greater than 12 mm Hg do not bleed (4). This low specificity by hepatic venous pressure gradient is likely related to the fact that many different venous collateral pathways can develop with high hepatic venous pressure gradient. Whereas gastroesophageal pathways are at risk for rupture, others such as splenorenal shunts and paraumbilical collaterals do not pose a risk for rupture.
As a result, repeated endoscopy must be performed for patients with cirrhosis to detect the presence of and/or assess the severity of gastroesophageal varices. Variceal size and surface markers including red wale sign (ie, red patches or strips) and nipple sign (ie, platelet-fibrin plug protruding into the esophageal lumen) on the mucosal surface of the varices observed at endoscopy are subjective indicators used to determine the varices that are at a high risk for bleeding (5). At-risk varices would be treated by variceal ligation or sclerotherapy to prevent bleeding. However, patients with cirrhosis develop varices at a rate of only 7% per year (3). Therefore, the vast majority of endoscopic procedures are performed purely to confirm that there are no varices. Endoscopy is invasive and requires sedation with associated potential complications such as perforation, adverse reaction to sedation, infection, and bleeding (6). Consequently, a quantitative and noninvasive method for evaluation of at-risk varices could improve patient care by decreasing such complications.
Four-dimensional (4D) flow MRI has been developed for comprehensive mapping of blood flow to and from the liver (7,8). With this approach, three-directional velocity encoding is used to generate volumetric maps of the velocity field and a corresponding angiogram that is inherently coregistered. Four-dimensional flow MRI provides three-dimensional angiograms, which provides inherent coregistration of anatomic and functional hemodynamic information (9). Abdominal 4D flow has been shown to make reproducible flow measurements that are internally consistent and that agree with known literature values. Previous studies (10) validated the accuracy of radial 4D flow MRI in the abdominal vasculature in a porcine model. This technique can make visible the vascular tree including collaterals and possibly gastroesophageal varices, and quantify the flow in these vessels (11) and characterize alterations in collateral blood flow (12). Furthermore, it is known that portal hypertension increases the azygos flow, which can be measured at phase-contrast MRI (13). Hence, we hypothesized that 4D flow MRI can be a marker to predict portal hypertension, especially for stratifying the risk of varices.
The purpose of our study was to assess the feasibility of 4D flow MRI as a noninvasive imaging marker for stratifying the risk of variceal bleeding in participants with liver cirrhosis.
Materials and Methods
Study Participants
This prospective Health Insurance Portability and Accountability Act–compliant study was performed after obtaining approval from the local institutional review board between January 2014 and February 2015. Written informed consent was obtained from all participants.
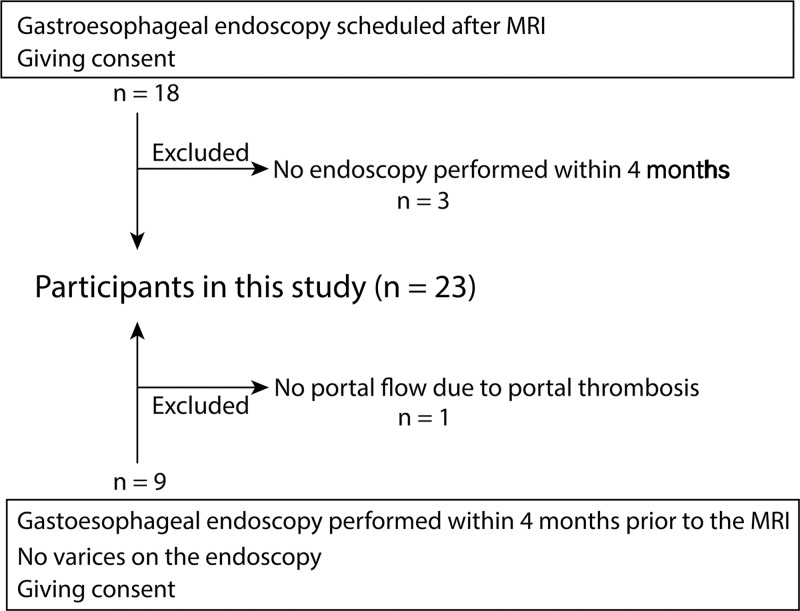
We recruited study participants with known liver cirrhosis who were scheduled for routine annual endoscopic screening for varices and also screening for hepatocellular carcinoma by using MRI within 4 months. Exclusion criteria included any contraindication to MRI, age younger than 18 years, and endoscopic treatment for varices within a year before MRI because we assumed that treatment of varices may affect the flow dynamics of collaterals and portal system (Fig 1).
Figure 1:
Flowchart shows participant inclusion and exclusion.
We successfully recruited 23 study participants with cirrhosis (mean age, 52.3 years; age range, 25–75 years), which included 14 men (mean age, 51.7 years; age range, 25–75 years) and nine women (mean age, 53.2 years; age range, 31–72). Fifteen participants were scheduled for both clinical liver MRI and gastroesophageal endoscopy to screen for varices. MRI was scheduled before endoscopy because treatment of the varices could be performed during the endoscopic procedure if there was a high risk of bleeding. For the other eight participants, endoscopy was performed before MRI, but no endoscopic procedure was performed before MRI (ie, no varices or only small varices were observed at endoscopy). There were median 0 days (range, −42 to 97 days) between endoscopy and MRI.
Four-dimensional Flow MRI
Four-dimensional flow MRI was performed on a clinical 1.5-T scanner (Optima MR450w or Signa HDxt; GE Healthcare, Waukesha, Wis) equipped with an 8- or 12-channel phased-array coil or a 3.0-T scanner (Discovery750; GE Healthcare) with a 32-channel phased array coil. Four-dimensional velocity mapping was achieved by using a radially undersampled phase-contrast acquisition (14) with comprehensive coverage of the upper abdomen and five-point velocity encoding for increased velocity sensitivity performance (15). MR parameters included the following: imaging volume, 32 × 32 × 24 cm; 1.25-mm acquired isotropic spatial resolution; repetition time msec/echo time msec, 6.4/2.2; and velocity encoding sensitivity, 30 cm/sec. Adaptive respiratory gating from bellow signals with 50% efficiency was used to minimize motion artifacts from breathing. A total of 10 000 unique projection angles was acquired, which resulted in a scan time of 10 minutes with slight variations on the basis of the respiratory pattern. A phase-contrast angiogram and all three components of the velocity vector field were generated by offline reconstruction.
All participants were administered 0.1 mmol/kg of gadobenate dimeglumine (Multihance; Bracco, Italy) as part of clinical MRI of the liver. Four-dimensional flow MRI was performed approximately 10 minutes after the administration of the contrast agent, which increased vascular signal.
Visual Assessment of Angiograms by 4D Flow MRI
A radiologist (P.B., with 10 years of experience in abdominal and cardiovascular radiology and interpretation of abdominal MRI) who was blinded to the endoscopic results independently reviewed all 4D flow MRI angiograms to determine visibility of gastroesophageal varices, main collaterals (coronary vein, and proper and short gastric vein) that are major components in the development of gastroesophageal varices, and the umbilical vein and splenorenal shunts.
Quantitative Analysis of 4D Flow MRI
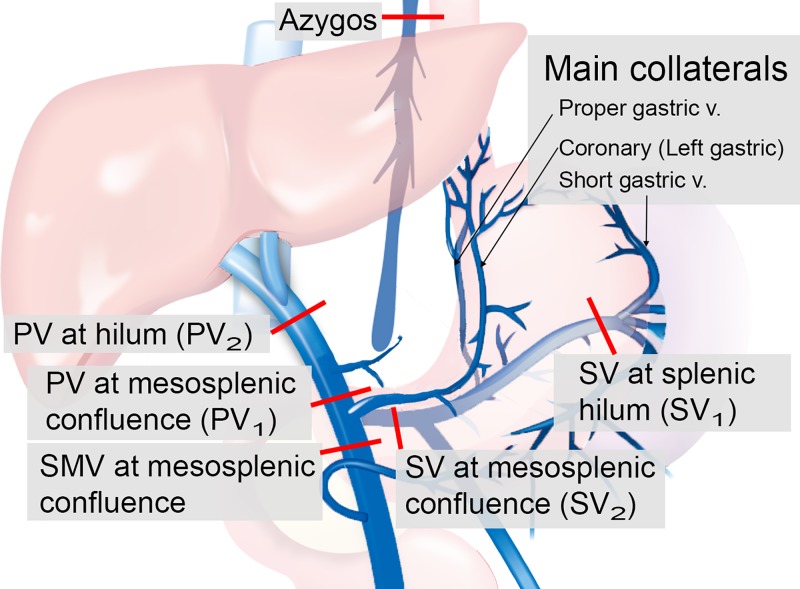
Cut planes were manually placed to perform blood flow measures in the targeted vessel segments (Fig 2) by using EnSight (CEI, Apex, NC). The places of those cut planes were defined as shown in Figure 2: the main portal vein (PV) is proximal to the mesosplenic confluence and liver hilum; the superior mesenteric vein is distal to the mesosplenic confluence; and the splenic vein (SV) is at the splenic hilum and just distal to the mesosplenic confluence, azygos vein, and, if measurable, the main collaterals including coronary vein, proper gastric vein, and short gastric vein.
Figure 2:
Points of flow measurement of the data from four-dimensional (4D) flow MRI. Portal blood stream flows toward the liver in healthy participants (ie, from main portal vein [PV] proximal to the mesosplenic confluence [PV1] toward the main PV at the liver hilum [PV2], and from the splenic vein [SV] at the splenic hilum [SV1] toward SV distal to the mesosplenic confluence [SV2]). Blood flow in the collaterals normally flows into the PV toward the liver. In patients without cirrhosis, PV2 should exceed superior mesenteric vein (SMV) + SV2. Red lines indicate cut planes.
To identify shunting from the PV into the coronary vein and subsequently into gastroesophageal varices, we calculated the fractional flow change in PV and SV with the following equations:
 |
and
 |
wherein PV1 is the PV at mesosplenic confluence, PV2 is liver hilum, SMV is superior mesenteric vein, SV1 is splenic hilum, and SV2 is SV at mesosplenic confluence. The fractional changes described in Equations 1 and 2 quantify the gain or loss of flow from the portal circulation while passing the target vessels (PV or SV). Portal blood stream flows toward the liver in healthy participants (ie, from mesosplenic confluence toward liver hilum, and from splenic hilum toward mesosplenic confluence). Blood flow in the collaterals normally flows into the PV toward the liver. In participants without cirrhosis, the sum of superior mesenteric vein and mesosplenic confluence should exceed liver hilum. However, in participants with portal hypertension, blood flow can reverse in the coronary vein, leading to a decreased flow volume in the PV at liver hilum compared with the PV at mesosplenic confluence (Movies E1 and E2 [online]). Similarly, mesosplenic confluence should exceed splenic hilum in healthy participants because collaterals (ie, proper gastric vein) flow into the SV that increases the blood volume.
Movie E1.
High-risk varices.
Movie E2.
No high-risk varices.
Assessment of Risks of Variceal Bleeding
Photos of varices evaluated during endoscopy were assessed independently by a gastroenterologist (S.K., with 3 years of experience) who was blinded to the MRI results to categorize the risk of variceal rupture (no varices: no varices found on endoscopy; low risk: varices that were small [≤5 mm] and had no mucosal surface markers; high risk: varices that were either large [>5 mm] or positive for surface markers, ie, red wale sign and/or nipple sign; Fig E1 [online]) (5). High-risk varices typically required endoscopic treatment because of an elevated risk of rupture.
Statistical Analysis
Demographics of the study participants were recorded that included age, sex, history of variceal treatment, and model for end-stage liver disease score. The trends toward risks of variceal bleeding was assessed according to participants’ demographics and the results of a visual assessment of 4D flow MRI by using the Cochran-Armitage trend test.
Quantitative results from 4D flow MRI were analyzed with Spearman correlation to assess a trend toward the risks of variceal bleeding. If correlation of 0.70 or greater was observed for the quantitative results, receiver operating characteristic curve analysis was performed to determine the performance of 4D flow MRI to distinguish participants with high-risk varices from participants with no varices or who were at low risk. Optimal cutoff values were calculated by Youden index to reveal whether those quantitative results were useful for the variceal risk stratification by using univariable (χ2) and multivariable (logistic regression) analyses.
Statistical analyses were performed by using software (JMP version 13, SAS Institute, Cary, NC; and R, R Core Team, Vienna, Austria). A P value of less than .05 was considered to indicate statistical significance. A multiple comparison adjustment was made by using the Hochberg procedure (16), which is a Bonferroni-based P value adjustment.
Results
Risk Assessment of Variceal Bleeding
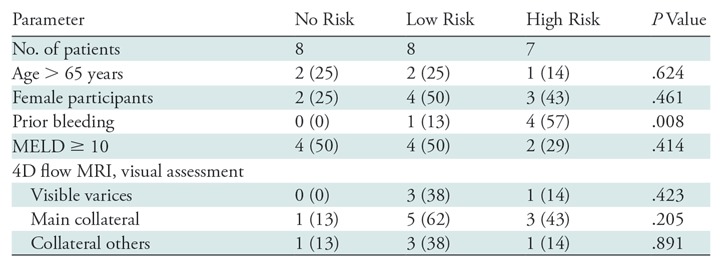
Endoscopy showed that 15 participants had gastroesophageal varices (any varices), whereas no varices were found in eight participants (no risk). Among the 15 participants with varices, seven participants were assigned to the high-risk group because of large (>5 mm) varices (n = 4) and mucosal surface markers (n = 5), whereas eight participants were low risk because the varices were small and had no surface marker (Table 1).
Table 1:
Trend of Patients’ Demographics/Qualitative Results by 4D Flow MRI toward Variceal Risk
Note.—Unless otherwise indicated, data are numbers of patients. Data in parentheses are percentages. 4D = four dimensional, MELD = model for end-stage liver disease.
Among the participants’ demographics, only the history of variceal treatment showed a trend toward an increased risk of high-risk varices (P = .008). (Table 1).
Visual Assessment of 4D Flow MRI Angiograms
Four-dimensional flow MRI–derived angiograms enabled direct anatomic viewing of varices in three of eight participants with low-risk (38%) and one of seven with high-risk (14%) varices. Main collaterals were visible in five of eight participants (62%) with low-risk varices, and in three of seven participants (43%) with high-risk varices. No significant trends toward the risk of variceal bleeding were observed in the results of visual assessments (Table 1).
Quantitative Analysis of 4D Flow MRI
We performed quantitative analysis of 4D flow MRI, and the resulting Spearman correlation coefficients between measured flows and variceal risk are in Table 2.
Table 2:
Correlations between Variceal Risk and Quantitative Results at 4D Flow MRI

Note.—Data are correlations unless otherwise indicated; data in parentheses are 95% confidence intervals. PV = portal vein, PV1 = PV at the mesosplenic confluence, PV2 = liver hilum, SMV = superior mesenteric vein, SV = splenic vein, SV1 = splenic hilum, SV2 = SV at mesosplenic confluence.
*P values are adjusted for multiple comparisons. Relatively higher correlation coefficients were observed in liver hilum, superior mesenteric vein, azygos vein, and fractional flow change in portal vein.
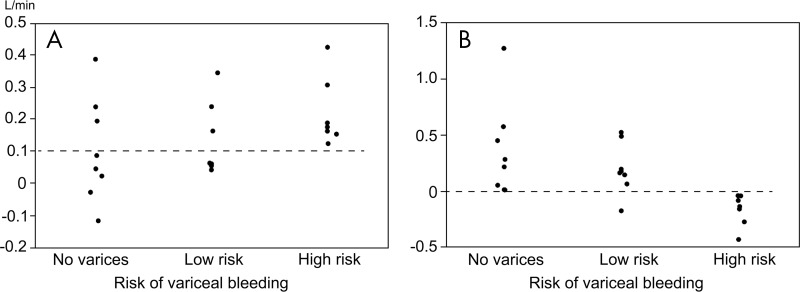
The areas under receiver operating characteristic curves to distinguish participants with high-risk varices from others were as follows: 0.723 (95% confidence interval: 0.326, 0.934) for PV at liver hilum, 0.955 (95% confidence interval: 0.720, 0.994) for fractional flow change in PV, 0.652 (95% confidence interval: 0.359, 0.862) for superior mesenteric vein, and 0.732 (95% confidence interval: 0.482, 0.889) for azygos vein. Results from univariable analyses showed that the participants with superior mesenteric vein flow less than 0.7 L/min (P = .008), azygos vein flow greater than 0.1 L/min (P = .001), and fractional flow change in PV less than 0 (P < .001) were higher in the high-risk varices group than in other groups (Table 3). Among these parameters, multivariable analysis demonstrated that azygos vein flow greater than 0.1 L/min (P = .034) and fractional flow change in PV less than 0 (P < .001) were associated with high-risk varices. To distinguish participants with high-risk varices from no varices or low-risk varices, a fractional flow change less than 0 yielded 100% sensitivity (seven of seven participants) and 94% specificity (15 of 16 participants), whereas azygos vein flow greater than 0.1 L/min yielded 100% sensitivity (seven of seven participants) and 62% specificity (10 of 16 participants) (Figs 3–5). By using the combination of these two criteria (ie, azygos flow > 0.1 L/min and fractional flow in PV of < 0), 4D flow MRI helped to identify participants with high-risk varices with 100% sensitivity (seven of seven participants) and 100% specificity (16 of 16 participants).
Table 3:
Quantitative Flow Measurement to Detect the Presence of High-Risk Varices

Note.—Data are numbers of patients; data in parentheses are the fraction of the total number of patients in each risk group. "Other" indicates low risk and no risk. The odds ratios given are the minimal detectable odds ratios for 80% power for an expected prevalence of 20% for superior mesenteric vein, 5% for portal vein at hilum and fractional flow change, and 30% for azygos vein. Blood flow volume in azygos vein and fractional flow change in portal vein were the independent indicators of high-risk varices. PV = portal vein, SMV = superior mesenteric vein.
Figure 3:
Scatterplots show flow volume in, A, the azygos vein and, B, fractional flow change in portal vein grouped by risk of variceal rupture. Dotted lines indicate the optimum cut-off value derived from receiver operating characteristic curve analyses to distinguish high-risk varices from no varices or low-risk varices. The threshold for azygos flow is 0.1 L/min and the threshold for fractional flow change in the portal vein is 0.
Figure 5:
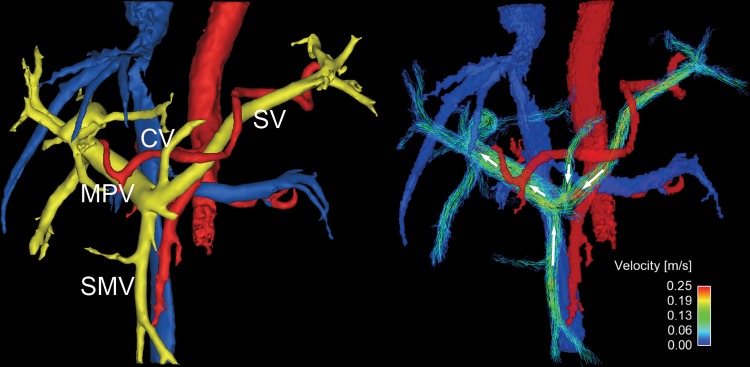
Four-dimensional flow MR images in a 69-year-old woman with low-risk varices (not seen on anatomic image). Flow direction in coronary vein (CV) is hepatopetal. The fractional flow change in the main portal vein (MPV) was 0.23, which provided no evidence of high-risk varices. White arrows show the flow direction. SMV = superior mesenteric vein; SV = splenic vein.
Figure 4:
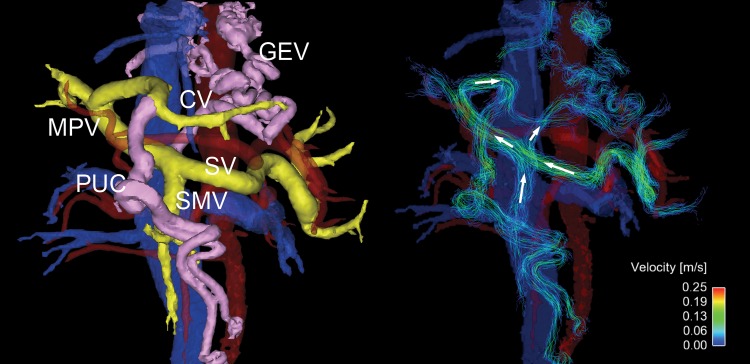
Oblique frontal view four-dimensional (4D) flow MR images in a 54-year-old woman with high-risk varices. Radial 4D flow MRI can depict both segmented anatomic images (left) and streamline reconstruction (right). Portal system is colored yellow, and abnormal collaterals (varices) are pink. In this patient, hepatofugal flow is observed in a large periumbilical collateral (PUC) arising from the left portal vein, and an enlarged coronary vein (CV) that supplies flow to prominent gastroesophageal varices (GEV). Hepatopetal flows are observed in splenic vein (SV) and superior mesenteric vein (SMV). In this patient, the fractional flow change in the main portal vein (MPV) was −0.14, which helped to predict the presence of high-risk varices that were observed at endoscopy.
A post hoc univariate power calculation was performed on the basis of a two-sided χ2 test of a 2 × 2 table. The parameters used in the power calculations are on the basis of the sample size and odds ratios obtained in the sample, and are provided in Table 3.
Discussion
The results of our pilot study showed that noninvasive quantitative assessment of 4D flow MRI can be used to help detect gastroesophageal varices with high diagnostic accuracy. In particular, flow measurement in the azygos vein and the fractional flow change in PV may be useful to distinguish patients with high-risk varices from patients with no varices or low-risk varices.
A previous study (17) showed that serum-based methods are the simplest indicator of the presence of varices but have relatively poor accuracy. Other approaches examined the stiffness of the liver (18–20) and spleen (21) by using elastography (22). However, not all patients with stiff liver or portal hypertension develop gastroesophageal varices that are at risk of bleeding, and these patients may develop other portosystemic collaterals that are not at an elevated risk of rupture. Therefore, the direct measurement of the blood flow alterations in the portal circulation is of interest to help predict the manifestation of high-risk varices.
Previously, two-dimensional phase-contrast MRI was used to identify gastroesophageal varices by measuring azygos flow (23–25) or portal flow (18,26). Although the results of portal flow in those studies were not matching, the azygos flow consistently increased in patients with high-risk varices in two previous studies (23,24). Our results further indicate that fractional flow change in PV had the highest diagnostic accuracy to identify high-risk varices. The coronary vein is the most common collateral vessel that supplies the blood flow into gastroesophageal varices; approximately 80% of varices are supplied by coronary veins (27,28). Although some collaterals, including the coronary vein, were too small to be directly viewed at 4D flow MRI, the decrease of flow in the PV because of hepatofugal shunting of blood was sufficient to help detect abnormal flow to the varices.
Previous studies showed that flow measurement by using US in the PV (29,30) or in the hepatic veins (31) can be used to predict the presence of varices. Although US-based flow measurement is simpler and less expensive than MRI, it is challenging to measure the flow in the hepatic vasculature at US because of the complexity of anatomy and limited field of view. In this regard, 4D flow MRI has an advantage. Importantly, the cost and practical barriers to perform 4D flow MRI in patients with portal hypertension is minimal for those patients who already present for hepatocellular carcinoma screening by using MRI (32). Adding 4D flow pulse sequence to hepatocellular carcinoma screening MRI may lead to substantial cost savings if the need or frequency for endoscopy can be reduced.
Our study had several limitations. First, the sample size was relatively small because of the challenging recruitment of study participants scheduled for both MRI and endoscopy. With only 23 participants, the results of the multivariable analysis can be exploratory because of the possibility of overfitting. All reported values of sensitivity and specificity may have been overestimates. An independent validation set is required for unbiased estimates of performance. Second, the time between endoscopy and MRI varied according to the schedule of procedures, leading to a potential difference due to any disease progression between MRI and endoscopy. Lack of assessment of reproducibility in measurement can be also a limitation. Assessment of the intra- and interreader variability of flow measurements made at 4D flow MRI is important when evaluating the performance of quantitative markers. Fortunately, the intra- and interreader variability of the radial 4D flow MRI method describing this work was extensively evaluated and previously reported by multiple authors (12,14,33). Another limitation is that we used only 4D flow MRI–based MR angiography for a morphologic assessment of varices. Conventional MR angiography after a bolus injection of gadolinium chelate may have higher accuracy to help detect small collaterals and varices around the stomach or esophagus. Whereas the velocity-encoding sensitivity was chosen on the basis of past optimization in the PV (9,34), optimization of the velocity-encoding sensitivity setting for direct quantification in varices was not performed. Future studies will include optimization of velocity-encoding sensitivity settings for viewing and direct quantification of flow in the coronary vein and gastroesophageal varices. The complexity of analysis at 4D flow MRI can be also a limitation. It requires double-oblique postprocessing planes. However, two-dimensional phase-contrast MRI also requires double-oblique cut planes during the MR examination. We note that 4D flow MRI has the important advantage over two-dimensional phase-contrast MRI in terms of simplicity of data acquisition because it does not require double-oblique acquisition planes. The acquisition time of 4D flow MRI is approximately 10 minutes. However, the postprocessing time for 4D flow MRI data may take approximately 0.5–1 hour per patient. The cost associated with human resource is not negligible. Automation of the analysis may solve this issue in the future.
In conclusion, our pilot study demonstrated that azygos vein flow greater than 0.1 L/min and portal venous flow less than the sum of splenic and superior mesenteric vein flow measured at 4D flow MRI are useful markers to stratify the risk of bleeding in gastroesophageal varices in patients with liver cirrhosis. The quantitative flow measurements at 4D flow MRI in the azygos vein and fractional flow change in the PV are useful indicators of gastroesophageal varices that are at high risk of bleeding.
SUPPLEMENTAL FIGURES
Acknowledgments
Acknowledgments
The authors acknowledge GE Healthcare for providing partial research support to UW-Madison. This project was also supported in part by the Departments of Radiology and Medical Physics, University of Wisconsin.
Study supported by the National Institutes of Health (R01 DK096169, K24 DK102595) and the Department of Radiology and Medical Physics, University of Wisconsin.
Disclosures of Conflicts of Interest: U.M. Activities related to the present article: disclosed no relevant relationships. Activities not related to the present article: disclosed money paid to author’s institution for grants from Bayer Healthcare and Fuji Pharma; disclosed money paid to author from Medinet Yamanashi. Other relationships: disclosed no relevant relationships. A.R.A. disclosed no relevant relationships. P.B. disclosed no relevant relationships. A.S. disclosed no relevant relationships. S.K. disclosed no relevant relationships. R.Z. disclosed no relevant relationships. O.W. disclosed no relevant relationships. S.B.R. disclosed no relevant relationships. X.X.X. Activities related to the present article: disclosed no relevant relationships. Activities not related to the present article: disclosed no relevant relationships. Other relationships: disclosed no relevant relationships.
Abbreviations:
- 4D
- four-dimensional
- PV
- portal vein
- SV
- splenic vein
References
- 1.Chalasani N, Kahi C, Francois F, et al. Improved patient survival after acute variceal bleeding: a multicenter, cohort study. Am J Gastroenterol 2003;98(3):653–659. [DOI] [PubMed] [Google Scholar]
- 2.D’Amico G, De Franchis R; Cooperative Study Group . Upper digestive bleeding in cirrhosis. Post-therapeutic outcome and prognostic indicators. Hepatology 2003;38(3):599–612. [DOI] [PubMed] [Google Scholar]
- 3.Garcia-Tsao G, Bosch J. Management of varices and variceal hemorrhage in cirrhosis. N Engl J Med 2010;362(9):823–832 [Published correction appears in N Engl J Med 2011;364(5):490. Dosage error in article text.] https://doi.org/ 10.1056/NEJMra0901512. [DOI] [PubMed] [Google Scholar]
- 4.D’Amico G, Garcia-Pagan JC, Luca A, Bosch J. Hepatic vein pressure gradient reduction and prevention of variceal bleeding in cirrhosis: a systematic review. Gastroenterology 2006;131(5):1611–1624. [DOI] [PubMed] [Google Scholar]
- 5.Hwang JH, Shergill AK, Acosta RD, et al. The role of endoscopy in the management of variceal hemorrhage. Gastrointest Endosc 2014;80(2):221–227. [DOI] [PubMed] [Google Scholar]
- 6.Leffler DA, Kheraj R, Garud S, et al. The incidence and cost of unexpected hospital use after scheduled outpatient endoscopy. Arch Intern Med 2010;170(19): 1752–1757. [DOI] [PubMed] [Google Scholar]
- 7.Roldán-Alzate A, Frydrychowicz A, Niespodzany E, et al. In vivo validation of 4D flow MRI for assessing the hemodynamics of portal hypertension. J Magn Reson Imaging 2013;37(5):1100–1108. [DOI] [PMC free article] [PubMed] [Google Scholar]
- 8.Stankovic Z, Fink J, Collins JD, et al. K-t GRAPPA-accelerated 4D flow MRI of liver hemodynamics: influence of different acceleration factors on qualitative and quantitative assessment of blood flow. MAGMA 2015;28(2):149–159. [DOI] [PubMed] [Google Scholar]
- 9.Roldán-Alzate A, Francois CJ, Wieben O, Reeder SB. Emerging Applications of Abdominal 4D Flow MRI. AJR Am J Roentgenol 2016;207(1):58–66. [DOI] [PMC free article] [PubMed] [Google Scholar]
- 10.Frydrychowicz A, Roldan-Alzate A, Winslow E, et al. Comparison of radial 4D Flow-MRI with perivascular ultrasound to quantify blood flow in the abdomen and introduction of a porcine model of pre-hepatic portal hypertension. Eur Radiol 2017;27(12):5316–5324. [DOI] [PMC free article] [PubMed] [Google Scholar]
- 11.Bannas P, Roldán-Alzate A, Johnson KM, et al. Longitudinal Monitoring of Hepatic Blood Flow before and after TIPS by Using 4D-Flow MR Imaging. Radiology 2016;281(2):574–582. [DOI] [PMC free article] [PubMed] [Google Scholar]
- 12.Roldán-Alzate A, Frydrychowicz A, Said A, et al. Impaired regulation of portal venous flow in response to a meal challenge as quantified by 4D flow MRI. J Magn Reson Imaging 2015;42(4):1009–1017. [DOI] [PMC free article] [PubMed] [Google Scholar]
- 13.Debatin JF, Zahner B, Meyenberger C, et al. Azygos blood flow: phase contrast quantitation in volunteers and patients with portal hypertension pre- and postintrahepatic shunt placement. Hepatology 1996;24(5):1109–1115. [DOI] [PubMed] [Google Scholar]
- 14.Gu T, Korosec FR, Block WF, et al. PC VIPR: a high-speed 3D phase-contrast method for flow quantification and high-resolution angiography. AJNR Am J Neuroradiol 2005;26(4):743–749. [PMC free article] [PubMed] [Google Scholar]
- 15.Johnson KM, Markl M. Improved SNR in phase contrast velocimetry with five-point balanced flow encoding. Magn Reson Med 2010;63(2):349–355. [DOI] [PMC free article] [PubMed] [Google Scholar]
- 16.Hochberg Y. A sharper Bonferroni procedure for multiple tests of significance. Biometrika 1988;75(4):800–802. [Google Scholar]
- 17.Giannini E, Botta F, Borro P, et al. Platelet count/spleen diameter ratio: proposal and validation of a non-invasive parameter to predict the presence of oesophageal varices in patients with liver cirrhosis. Gut 2003;52(8):1200–1205. [DOI] [PMC free article] [PubMed] [Google Scholar]
- 18.Morisaka H, Motosugi U, Ichikawa T, et al. MR-based measurements of portal vein flow and liver stiffness for predicting gastroesophageal varices. Magn Reson Med Sci 2013;12(2):77–86. [DOI] [PubMed] [Google Scholar]
- 19.Shin SU, Lee JM, Yu MH, et al. Prediction of esophageal varices in patients with cirrhosis: usefulness of three-dimensional MR elastography with echo-planar imaging technique. Radiology 2014;272(1):143–153. [DOI] [PMC free article] [PubMed] [Google Scholar]
- 20.Sun HY, Lee JM, Han JK, Choi BI. Usefulness of MR elastography for predicting esophageal varices in cirrhotic patients. J Magn Reson Imaging 2014;39(3):559–566. [DOI] [PubMed] [Google Scholar]
- 21.Morisaka H, Motosugi U, Ichikawa S, Sano K, Ichikawa T, Enomoto N. Association of splenic MR elastographic findings with gastroesophageal varices in patients with chronic liver disease. J Magn Reson Imaging 2015;41(1):117–124. [DOI] [PubMed] [Google Scholar]
- 22.Kim BK, Han KH, Park JY, et al. A liver stiffness measurement-based, noninvasive prediction model for high-risk esophageal varices in B-viral liver cirrhosis. Am J Gastroenterol 2010;105(6):1382–1390. [DOI] [PubMed] [Google Scholar]
- 23.Gouya H, Vignaux O, Sogni P, et al. Chronic liver disease: systemic and splanchnic venous flow mapping with optimized cine phase-contrast MR imaging validated in a phantom model and prospectively evaluated in patients. Radiology 2011;261(1): 144–155. [DOI] [PubMed] [Google Scholar]
- 24.Wu MT, Pan HB, Chen C, et al. Azygos blood flow in cirrhosis: measurement with MR imaging and correlation with variceal hemorrhage. Radiology 1996;198(2): 457–462. [DOI] [PubMed] [Google Scholar]
- 25.Gouya H, Grabar S, Vignaux O, et al. Portal hypertension in patients with cirrhosis: indirect assessment of hepatic venous pressure gradient by measuring azygos flow with 2D-cine phase-contrast magnetic resonance imaging. Eur Radiol 2016;26(7): 1981–1990. [DOI] [PubMed] [Google Scholar]
- 26.Burkart DJ, Johnson CD, Ehman RL, Weaver AL, Ilstrup DM. Evaluation of portal venous hypertension with cine phase-contrast MR flow measurements: high association of hyperdynamic portal flow with variceal hemorrhage. Radiology 1993;188(3): 643–648. [DOI] [PubMed] [Google Scholar]
- 27.Cho KC, Patel YD, Wachsberg RH, Seeff J. Varices in portal hypertension: evaluation with CT. RadioGraphics 1995;15(3):609–622. [DOI] [PubMed] [Google Scholar]
- 28.Hoevels J, Lunderquist A, Tylén U, Simert G. Porto-systemic collaterals in cirrhosis of the liver. Selective percutaneous transhepatic catheterization of the portal venous system in portal hypertension. Acta Radiol Diagn (Stockh) 1979;20(6): 865–877. [DOI] [PubMed] [Google Scholar]
- 29.Chiu KC, Sheu BS, Chuang CH. Portal venous flow pattern as a useful tool for predicting esophageal varix bleeding in cirrhotic patients. Dig Dis Sci 2005;50(6): 1170–1174. [DOI] [PubMed] [Google Scholar]
- 30.Kayacetin E, Efe D, Doğan C. Portal and splenic hemodynamics in cirrhotic patients: relationship between esophageal variceal bleeding and the severity of hepatic failure. J Gastroenterol 2004;39(7):661–667. [DOI] [PubMed] [Google Scholar]
- 31.Gorka W, al Mulla A, al Sebayel M, Altraif I, Gorka TS. Qualitative hepatic venous Doppler sonography versus portal flowmetry in predicting the severity of esophageal varices in hepatitis C cirrhosis. AJR Am J Roentgenol 1997;169(2):511–515. [DOI] [PubMed] [Google Scholar]
- 32.Chen N, Motosugi U, Morisaka H, et al. Added Value of a Gadoxetic Acid-enhanced Hepatocyte-phase Image to the LI-RADS System for Diagnosing Hepatocellular Carcinoma. Magn Reson Med Sci 2016;15(1):49–59. [DOI] [PubMed] [Google Scholar]
- 33.Schrauben EM, Johnson KM, Huston J, et al. Reproducibility of cerebrospinal venous blood flow and vessel anatomy with the use of phase contrast-vastly undersampled isotropic projection reconstruction and contrast-enhanced MRA. AJNR Am J Neuroradiol 2014;35(5):999–1006. [DOI] [PMC free article] [PubMed] [Google Scholar]
- 34.Frydrychowicz A, Landgraf BR, Niespodzany E, et al. Four-dimensional velocity mapping of the hepatic and splanchnic vasculature with radial sampling at 3 tesla: a feasibility study in portal hypertension. J Magn Reson Imaging 2011;34(3):577–584. [DOI] [PMC free article] [PubMed] [Google Scholar]
Associated Data
This section collects any data citations, data availability statements, or supplementary materials included in this article.


