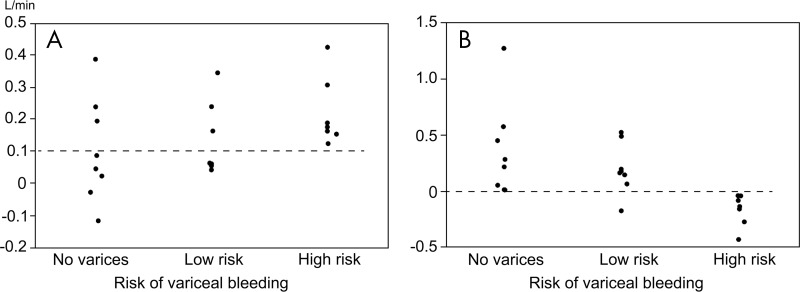
Figure 3:
Scatterplots show flow volume in, A, the azygos vein and, B, fractional flow change in portal vein grouped by risk of variceal rupture. Dotted lines indicate the optimum cut-off value derived from receiver operating characteristic curve analyses to distinguish high-risk varices from no varices or low-risk varices. The threshold for azygos flow is 0.1 L/min and the threshold for fractional flow change in the portal vein is 0.

