

Abstract
Human mesenchymal stem cells (hMSCs) promote endogenous tissue repair in part by coordinating multiple components of the host immune system in response to environmental stimuli. Recent studies have shown that hMSCs are metabolically heterogeneous and actively reconfigure metabolism to support the biochemical demands of tissue repair. However, how hMSCs regulate their energy metabolism to support their immunomodulatory properties is largely unknown. This study investigates hMSC metabolic reconfiguration during immune activation and provides evidence that the hMSC metabolic state significantly influences their immunomodulatory properties. Specifically, hMSC immune polarization by interferon‐gamma (IFN‐γ) treatment leads to remodeling of hMSC metabolic pathways toward glycolysis, which is required to sustain the secretion of immunosuppressive factors. IFN‐γ exposure also inhibited mitochondrial electron transport activity, and the accumulation of mitochondrial reactive oxygen species plays an important signaling role in this metabolic reconfiguration. The results also show that activation of the Akt/mTOR signaling pathway is required for metabolic reconfiguration during immune polarization and that interruption of these metabolic changes alters the immune response in IFN‐γ licensed hMSCs. The results demonstrate the potential of altering hMSC metabolism to enhance their immunomodulatory properties and therapeutic efficacy in various diseases. Stem Cells Translational Medicine 2019;8:93–106
Keywords: Mesenchymal stem cells, Immunosuppression, Stem cell plasticity, T cell, Cellular therapy
Significance Statement.
Immunomodulatory properties of human mesenchymal stem cells (hMSCs) have attracted significant interest in clinical applications. Understanding the mechanism underpinning hMSC immune polarization and secretory function is critical to enhance their therapeutic outcome. Results of this study showed that the immunomodulatory properties of hMSC are metabolically regulated and that metabolic preconditioning potentiates specific hMSC immunomodulatory properties. The study offers a strategy that has immediate translational potential for controlling specific immunomodulatory properties of hMSCs and therefore to improve their therapeutic efficacy.
Introduction
Human mesenchymal stem cells (hMSCs) have gained significant interest as an “off‐the‐shelf” product for cell therapy in various types of diseases. Recent findings suggest that instead of replacing damaged cells through differentiation, as initially thought, hMSCs promote endogenous tissue regeneration by coordinating multiple components of the host immune system via the release of immunomodulatory factors 1. Therefore, understanding and ultimately controlling the regulatory mechanism(s) that preserve and enhance these immunomodulatory properties are critical goals in further developing hMSCs for clinical translation.
Transplantation of culture‐expanded hMSCs from a nutrient rich in vitro environment to in vivo injury sites requires effective adaption to the local microenvironment for the hMSCs to assume their desired functional properties. Among these functions, the release of inflammatory factors, including various cytokines and chemokines, aids the early establishment of host immune response and is critical to the subsequent tissue repair and resolution of inflammation through their direct impacts on the host's adaptive immunity 2, 3, 4. The complex functional fates of hMSCs in response to environmental signals are intimately linked to and dependent on dynamic changes in metabolism that not only provide energy and substrates for cell survival and growth but may also regulate or instruct effector functions that generate specific secretory profiles and immune responses. As cellular metabolism underpins all aspects of cellular function, understanding the metabolic mechanisms that regulate hMSC adaptation to specific environmental cues and dictate their immunomodulatory functions is critical for developing strategies that preserve hMSCs therapeutic effects for the treatment of tissue degeneration and immune disorder diseases.
The importance of metabolic control of cellular responses is increasingly appreciated in immune cells. Recent studies show that immune cell function is a product of their metabolic state and that different metabolic phenotypes instruct different effector functions including the appropriate immune polarization of cells in innate and adaptive immunity 5. For example, activated T‐cells undergo a metabolic reprogramming that promotes aerobic glycolysis for the elevated demands of biosynthesis, including the production of lipids, proteins, nucleic acids, and other carbohydrates 6. Classically activated M1 macrophages depend on the M2 isoform of pyruvate kinase (PKM2) in glycolysis for production of the key proinflammatory cytokine, IL‐1β 7. Inflammatory cytokines interferon‐gamma (IFN‐γ) and tumor necrosis factor‐alpha (TNF‐α) are known to exert synergistic effects on the production of nitric oxide and inhibition of mitochondrial respiration in vascular smooth muscle cells 8. On the other hand, while it is well‐documented that hMSCs are sensitive to and switch their immunomodulatory functions depending on the degree of inflammation and types of cytokines presented at the microenvironment, the underlying metabolic mechanisms that support the plasticity of hMSCs in these changes is unknown.
Our previous studies show that hMSCs are metabolically plastic and that metabolic reconfiguration occurring in response to a changing environment plays a central role in regulating hMSC phenotype and adaptation to these environmental cues 9, 10. In response to inflammatory stimuli, hMSCs regulate a number of immune cells, including T cells, B cells, macrophages, dendritic cells (DC), and natural killer cells. Among these, the potency of suppressing T‐cell proliferation and function has been identified as the key indicator for the immunomodulatory properties of hMSCs in vivo 11. In vitro, comparing the results with both resting and licensed hMSCs following IFN‐γ treatment for 12–48 hours allows for the assessment of hMSC immunoregulatory functions as a standard criterion to evaluate hMSC immunomodulatory potency 12. Typically, hMSCs are treated by IFN‐γ to exert their immunomodulatory effect through the activation of the indoleamine 2,3‐dioxygenase (IDO) enzyme, the first enzymatic step in converting tryptophan into kynurenine 13, 14. While hMSC express both IDO1 and IDO2, IDO1 plays a dominant role in tryptophan metabolism in response to IFN‐γ treatment 15, 16. IDO exerts its immunosuppressive role on T cells by increasing the O2‐dependent catabolism of tryptophan and the production of toxic tryptophan metabolites (kynurenines), resulting in cell cycle arrest and apoptosis in T cells 11, 17, 18. A hMSC‐derived IDO is also associated with the reeducation of immune cells into immunosuppressive phenotypes, including M2 macrophage, regulatory T cells, and the switch among T helper cells 3, 4. IFN‐γ at concentrations from 5 ng/ml up to 100 ng/ml has been used to induce hMSC immune polarization with most of studies using IFN‐γ at concentrations between 20 ng/ml and 50 ng/ml 19. In addition to immune modulation, the influence of IFN‐γ on hMSC proliferation 20, trilineage differentiation 21, migration 22, transcriptome profile 23, and secretion of angiogenic and other tropic factors 24, 25 has been extensively reported.
In the present study, we investigate whether metabolic remodeling underpins the phenotypic transition of hMSCs from the resting state to an active, immunosuppressive state and whether metabolic preconditioning could potentiate specific hMSC immunomodulatory properties. We tested the hypothesis that IFN‐γ licensing of hMSCs induces specific remodeling of hMSC metabolism toward an enhanced glycolytic phenotype that sustains IDO production. We found that exposure to IFN‐γ induced metabolic changes characterized by increased glycolysis, reduced mitochondrial electron transport activity, and increased production of mitochondrial reactive oxidative species (ROS). We found that IFN‐γ activation of Akt/ mammalian target of rapamycin (mTOR) signaling is required for metabolic remodeling and for IDO and Prostaglandin E2 (PGE2) production in hMSCs. We also found that hypoxic culture or rotenone and AmA preconditioning to reduce the activity of oxidative phosphorylation further enhanced IFN‐γ‐induced IDO production. Our findings demonstrate the metabolic demands, integrated with molecular signaling, regulate hMSC immune polarization, and offer a strategy that has immediate translational potential for controlling specific immunomodulatory properties of hMSCs and therefore to improve their therapeutic efficacy.
Materials and Methods
Culture of hMSCs
Frozen hMSCs at passage 1 in freezing media (1 × 10⁶ cell/mL per vial in α‐MEM containing 2 mM L‐glutamine, 30% fetal bovine serum [FBS], and 5% DMSO) were obtained from the Tulane Center for Stem Cell Research and Regenerative Medicine and cultured following the methods described previously 26, 27. The hMSCs were isolated from the bone marrow of healthy donors (age: 21 to 25 years and body mass index: 21 to 25) based on plastic adherence, being negative for CD34, CD45, CD117 (all less than 2%) and positive for CD29, CD44, CD49c, CD90, CD105, and CD147 markers (all greater than 95%), and possessing tri‐lineage differentiation potential upon in vitro induction 28. Briefly, hMSCs at passage 1 were expanded and maintained in complete culture media (CCM) containing α‐MEM supplemented with 10% FBS (Atlanta Biologicals, Lawrenceville, GA) and 1% Penicillin/Streptomycin (Life Technologies, Carlsbad, CA) with media changes every 3 days. Cells were grown to 70%–80% confluence and then harvested by incubation with 0.25% trypsin/EDTA (Invitrogen). Harvested cells were replated at a density of 1,500 cells/cm2 and subcultured up to Passage 5 in a standard CO2 incubator (37°C and 5% CO2).
For immune polarization experiments, hMSCs were plated in six‐well plates at a density of 8,000 cells/cm2 and incubated overnight. The following day cells were pretreated with AmA (6 μM), rotenone (2 μM), rapamycin (50 nM), or DMSO as vehicle control (DMSO: CCM = 1:5,000) for 2 hours and then either stimulated with IFN‐γ (40 ng/ml) or left unstimulated and incubated at 37°C and 5% CO2 for 24 hours until sample collection. Supernatant was collected at this time for cytokine or metabolite analysis. For experiments requiring hypoxic conditions, hMSCs were seeded at 8,000 cells/cm2 and incubated overnight. The next day cells were transferred to a hypoxic chamber (BioSpherix, Lacona, NY) flushed with 2% O2, 5% CO2, and balanced N2 in the presence and absence of IFN‐γ (40 ng/ml) for 24 hours. hMSCs from three different donors were used in the study. All reagents were purchased from Sigma Aldrich (St. Louis, MO) unless otherwise noted.
IDO Activity and PGE2 Measurement
IDO enzymatic activity, including both IDO1 and IDO2 (both convert Tryptophan to Kynurenine) was assessed by measuring Kynurenine level in cell culture supernatant. A 400 μl supernatant from hMSCs culture was clarified by mixing with trichloroacetic acid (200 μl, 30% by weight; Sigma Aldrich, St. Louis, MO) by vortex, followed by centrifugation at 8,000xg for 5 minutes. An equal volume of Ehrlich reagent (2% p‐dimethylaminobenzaldehyde in glacial acetic acid) was added to the clarified supernatant, and optical density at 490 nm was measured. Secreted PGE‐2 in clarified cell culture supernatant was quantified using a PGE‐2 Parameter Assay Kit (R&D Systems, Minneapolis, MN). Total secreted PGE‐2 was determined by subtracting cytokine concentrations in culture media controls and normalized to cell number.
Cell Number and Measurement of Cell Metabolism
Cell number was determined following the methods reported previously 28, 29. Briefly, cells were pelleted and lysed overnight using proteinase K. Picogreen (Molecular Probes, Eugene, OR) was added to the samples to allow quantitation of cellular DNA. Fluorescence signals were read using a Fluror Count (PerkinElmer, Boston, MA). Cell number was calculated from the amount of DNA detected. Glucose and lactate concentration in culture medium were measured using a YSI 2500 Biochemistry Select Analyzer (Yellow Spring, OH). The metabolic rates were calculated based on total amount of glucose consumed or lactate release normalized by total cell number and the time of culture.
Oxygen consumption rate (OCR) and extracellular acidification rate (ECAR) were determined using Agilent Seahorse XF Extracellular Flux Analyzer XFp (Seahorse Biosciences, MA). All tests were performed in accordance with manufacture's instruction. Briefly, hMSCs were seeded onto Seahorse XFp Cell Culture Miniplate (Seahorse Biosciences) at 10,000 cells per well the day before analyzed. Cells were equilibrated in a non‐CO2 incubator with Seahorse calibrant buffer for 60 minutes prior to assay. Using the Seahorse XFp Cell Energy Phenotype Test Kit (Seahorse Biosciences), OCR and ECAR under baseline and stressed conditions were measured 30.
13C‐Glucose Labeling and Metabolite Extraction and Derivatization
13C‐glucose labeling, metabolite extraction and chemical derivatization followed methods established in our prior publications 28, 31. Briefly, glucose‐free DMEM medium (Life Technologies, Carlsbad, CA) supplemented with a 2:3 mixture of unlabeled and U‐13C‐labeled glucose (Cambridge Isotopes Laboratories, Andover, MA) at the same concentration was used for hMSC expansion (1.0 g/L glucose). Cells were seeded and cultured for 2 days in DMEM with unlabeled medium, at which time the culture medium was replaced with isotope‐enriched medium and cultured for additional 3 days. Cell collection started by washing with PBS, and addition of a 4:1 solution of methanol: water at −80°C directly to the culture plate to quench metabolism and lyse the cells. This was followed by addition of the internal standard (norleucine 28 μg/ml solution) and incubation of the plate at −80°C for 10 minutes. Following scraping of the plates, the extract was then centrifuged at 5,000× g for 5 minutes at 4°C, and the supernatant was collected and transferred to a silanized Reacti‐Vial (Wheaton) and stored at −80°C. Prior to derivatization, frozen extracts were dried under vacuum overnight and dissolved in 20 μl pyridine and 20 μl N‐methyl‐N‐(tert‐butyldimethylsilyl) trifluoro‐acetamide containing 1% tert‐butyldimethylchlorosilane (Thermo Scientific, Rockford, IL). The reaction was performed under a stream of argon. Reacti‐vials were closed under argon and heated to 75°C for 60 minutes and then cooled to room temperature. Injection of derivatized extracts in the gas chromatography–mass spectrometry (GC–MS) was completed within 24 hours of derivatization.
GC–MS Analysis of Derivatized Extracts
Derivatized samples (1 μl) were injected in splitless mode at 230°C in an HP Agilent 6,890 series gas chromatograph coupled with an HP Agilent 5,973 mass selective detector and separated on a 30 m DB5 column (J&W Scientific, Folsom, CA). The GC oven temperature was held at 70°C for 1 minute after injection, increased to 120°C at 15°/min and finally to 325°C at 10°/min. Mass spectra were collected over m/z 50–650 at a rate of 2 Hz with MS source set at 260°C. Metabolites were identified by comparison with standards. Peak areas were calculated from the [M‐57] + • and [M‐159] + • ions for amino acids and [M‐57] + • and [M‐189] + • ions for carboxylic acids by fitting the elution profile of each isotopomer to a Gaussian, eliminating the baseline, and summing over all isotope peaks for each specific ion 32, 33. The area was then normalized to the peak area of the internal standard norleucine, which was calculated in the same way, and divided by the cell count. Mass isotope distribution vectors and isotope incorporation was determined using methods described in detail elsewhere 28.
Immunocytochemistry, ROS, Mitochondrial ROS, and Mitochondrial Membrane Potential (MMP) by Flow Cytometry
Cells were harvested from monolayer culture by incubation with 0.25% trypsin–EDTA solution for 5–7 minutes at 37°C. Suspended hMSCs were washed in phosphate‐buffered saline (PBS), and fixed at 4% paraformaldehyde (PFA) at room temperature for 15 minutes. Cells were then permeabilized in 0.2% triton X‐100 PBS for 10 minutes at room temperature (RT). Nonspecific binding sites were blocked in PBS with 1% bovine serum albumin, 10% goat serum, 4% nonfat dry milk for 15 minutes at room temperature (RT). After washing with PBS, cells were incubated with specific primary antibodies for human IDO, phosphorylated Akt, and phosphorylated S6K (R&D systems, Minneapolis, MN) at RT for 2 hours, followed by 1 hours incubation with FITC‐conjugated secondary antibody (Molecular Probe, Eugene, OR) at RT. Labeled samples were washed in PBS followed by flow cytometry analysis with isotype control run in parallel. hMSCs without any treatment were used as control in flow cytometry analysis.
For ROS measurement, aliquots of cell suspension were incubated with 25 μM 6‐carboxy‐2′,7′‐dichlorodihydrofluorescein diacetate (carboxy‐H2DCFDA) (Molecular Probes, Eugene, OR) at 37°C for 30 minutes and the fluorescent product was measured by flowcytometry (BD Biosciences, San Jose, CA). Carboxy‐H2DCFDA is an improved version of the cell‐permeant H2DCFDA and is commonly used to detect the generation of reactive oxidative species in cells 34. For mitochondrial transmembrane potential (MMP) measurements, aliquots of cell suspension were washed by centrifugation in warm Hank's Balanced Salt Solution (HBSS). Cell suspension was incubated with tetramethylrhodamine, methyl ester (TMRM) (Molecular Probe, Eugene, OR) at 37°C, then washed with HBSS, and analyzed by flow cytometry (BD Biosciences, San Jose, CA). For mitochondrial ROS (mROS) measurement, aliquots of cell suspension were incubated with 5 μM MitoSOX Red (Molecular Probe, Eugene, OR) at 37°C for 10 minutes and analyzed using flow cytometry (BD Biosciences, San Jose, CA).
Mitochondrial Complex I Activity
Activity of mitochondrial complex I was determined using the Complex I Enzyme Activity Microplate Assay Kit (Abcam, Cambridge, MA) according to the kit instructions.
Real‐Time Reverse Transcriptase‐Polymerase Chain Reaction (RT‐PCR)
Total RNA was isolated using the RNeasy Plus kit (Qiagen, Valencia, CA) following vendor's instructions. Reverse transcription was carried out using 2 μg of total RNA, anchored oligo‐dT primers (Operon, Louisville, KY) and Superscript III (Invitrogen, Grand Island, NY). Primers for specific target genes were designed using the software Oligo Explorer 1.2 (Genelink, Hawthorne, NY). β‐actin was used as an endogenous control for normalization. Real‐time reverse transcriptase‐polymerase chain reaction (RT‐PCR) reactions were performed on an ABI7500 instrument (Applied Biosystems, Foster City, CA), using SYBR Green PCR Master Mix. The amplification reactions were performed and the quality and primer specificity were verified. hMSCs without any treatment were used as control group to determine relative fold‐increase. Fold variation in gene expressions were quantified using the comparative Ct method: 2‐(CtTreatment‐CtControl), which is based on the comparison of the expression of the target gene (normalized to β‐actin).
T Cell Suppression Assay
hMSCs were seeded at the density of 6,000/cm2 in 12‐well plate and pretreated with AmA (6 μM), 2‐DG (5 mM) and rotenone (2 μM) as described above. Human peripheral blood mononuclear cells (hPBMCs) were incubated with carboxyfluorescein succinimidyl ester (CFSE) at 5 μM for 20 minutes at a cell concentration of 106 cells/ml, protected from light. hPBMCs were then stimulated with anti‐CD3/CD28 antibodies (BD bioscience) in T‐cell culture medium (RPMI medium supplemented with 10% FBS, 1% penicillin, and 1% glutamine) and cocultured with or without pretreated hMSCs (hMSCs: hPBMC ratio = 1:10) in a standard CO2 incubator (37°C and 5% CO2). After 4 days of coculture, hPBMCs were collected and CD3+ and CD45+ T‐cell proliferation was measured by flow cytometry as a decrease in CFSE intensity as of cell division from the original population. APC‐CD3 and BV421‐CD45 antibodies were purchased from BD Biosciences.
Statistics/Data Analysis
Unless otherwise noted, all experiments were performed at least in triplicate (n = 3), and representative data are reported. Experimental results are expressed as means ± SD of the samples. Mean fluorescence intensity (MFI) of all histogram were summarized in Supporting Information (SI). Statistical comparisons were performed by one‐way ANOVA and Tukey's post hoc test for multiple comparisons, and significance was accepted at p < .05. NS: p > .05; *: p < .05; **: p < .01.
Results
IFN‐γ Treatment Increases Production of IDO and PGE2 in hMSCs
To generate the immunosuppressive phenotype, hMSC were incubated for 24 hours in CCM containing 40 ng/ml IFN‐γ. In vitro, short‐term treatment of 24 hours by IFN‐γ at concentrations ranging from 5 ng/ml to 50 ng/ml is typically used to polarize hMSC toward an anti‐inflammatory phenotype 19, 21, 67. In our hands, IFN‐γ at concentration of 5 ng/ml, 10 ng/ml, and 40 ng/ml induced robust upregulation of IDO secretion compared to nonstimulated control with no significant difference among these treatment groups (Supporting Information Fig. S1). Similar to the approach used in a prior study 21, a high IFN‐γ concentration at 40 ng/ml was used in all subsequent experiments to ensure sufficient hMSC immune polarization and metabolic reconfiguration. We observed increased IDO expression at both the mRNA and protein level after 24 hours of IFN‐γ treatment (Fig. 1A and 1B). Consistent with this, IFN‐γ treatment also increased the level of kynurenine, which is the product of tryptophan oxidation by IDO and is widely used as a proxy to measure IDO enzymatic activity (Fig. 1C). IFN‐γ treatment also increased the secretion of PGE2 and upregulated expression of mRNA for prostaglandin‐endoperoxide synthase 2 (COX2) (Fig. 1D and 1E), which is responsible for PGE2 synthesis. Collectively, these results confirmed that IFN‐γ treatment induced the transformation of hMSCs into the immunosuppressive phenotype 1.
Figure 1.
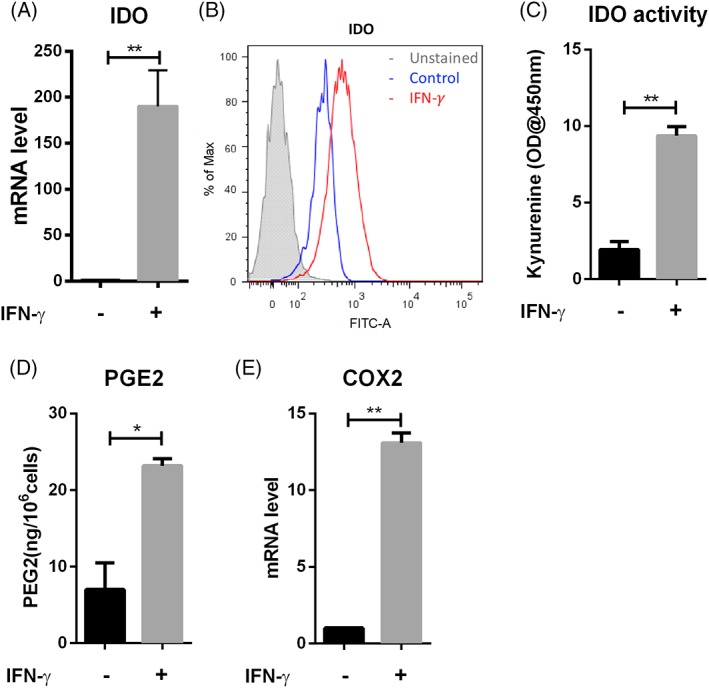
IFN‐γ treatment induced the secretion of multiple anti‐inflammatory factors in hMSCs. (A): qRT‐PCR measurement of IDO mRNA level in hMSCs in the presence and absence of IFN‐γ; (B): Flow‐cytometric measurement of IDO expression and (C): IDO activity of hMSCs in the presence and absence (as control) of IFN‐γ; (D): PGE2 level in hMSCs cell culture supernatant in the presence and absence of IFN‐γ normalized by cell number; (E): qRT‐PCR measurement of COX2 mRNA level in hMSCs in the presence and absence of IFN‐γ. *, p < .05; **, p < .01.
IFN‐γ Treatment Induces Global Changes of hMSC Metabolism and Reconfiguration toward Glycolysis
To understand the impact of IFN‐γ treatment on hMSCs central energy metabolism, levels of specific metabolites and enzymes were analyzed. Intracellular level of lactate, citrate, and succinate was increased after IFN‐γ treatment (Fig. 2A–2C). Increased consumption of glucose and conversion into lactate could account for the increased glycolysis observed upon IFN‐γ treatment (Fig. 2D and 2E). IFN‐γ treatment also increased expression of glucose transporter 1 (GLUT1) and hexokinase isoform 2 (HK2), the key enzymes in glycolysis (Fig. 2F). We also observed decreased mitochondrial complex I activity, increased total ATP amount, and decreased mitochondrial transmembrane potential in response to the IFN‐γ treatment (Fig. 2G–2I). The coupling of glycolysis to TCA cycle following IFN‐γ treatment was analyzed by measuring the absolute total molar percent enrichment (ATMPE) of lactate and citrate in cells exposed to media containing 13C‐glucose. The ATMPE is the mole fraction of all labeled isotopomers in a given metabolite. Interestingly, even though the intracellular lactate levels increased following IFN‐γ treatment as shown in Fig. 2A, the ATMPE of lactate and citrate decreased following the treatment, with the ATMPE of lactate decreasing more significantly than that of citrate (16% vs. 9%, respectively) (Fig. 2J), suggesting reduced coupling of glucose‐derived carbons in glycolysis into TCA cycle.
Figure 2.
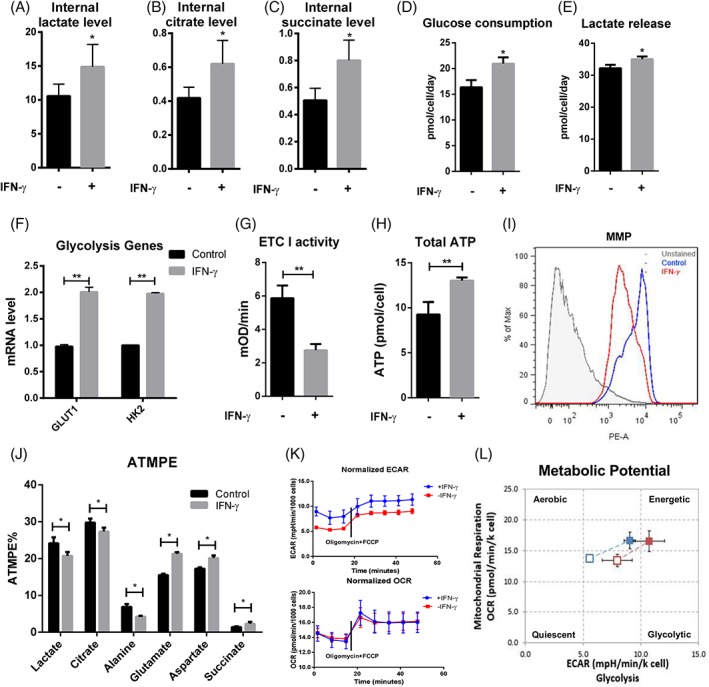
Exposure of hMSC to IFN‐γ reconfigures energy metabolism toward glycolysis. GC–MS normalized peak area for (A): Lactate, (B): Citrate, and (C): succinate in the presence and absence of IFN‐γ; (D): glucose and (E): lactate amount in spent medium normalized to cell number and culture duration in the presence and absence of IFN‐γ; (F): qRT‐PCR measurement of GLUT1 and HK2 mRNA level in the presence and absence of IFN‐γ; (G): Mitochondrial electron transport chain complex I activity and (H): total ATP amount of hMSCs in the presence and absence of IFN‐γ; (I): Flow‐cytometric measurement of hMSCs mitochondrial membrane potential (MMP) in the presence and absence (as control) of IFN‐γ; (J): Absolute‐total molar percent enrichment of 13C‐glucose atoms in metabolites involved in glycolysis and TCA cycle in the presence and absence of IFN‐γ; (K): OCR and ECAR in culture or treatment with 1 μM oligomycin a and 1uM FCCP in the presence (blue) and absence (red) of IFN‐γ; and (L): hMSC energy phenotype profile in the presence and absence of IFN‐γ. *, p < .05; **, p < .01.
Additional information on IFN‐γ effects on central energy metabolism was monitored in real‐time by the measurement of the oxygen consumption rate (OCR) and extracellular acidification rate (ECAR) using a Seahorse noninvasive flux analyzer 30. IFN‐γ treatment significantly increased the basal ECAR compared with the unstimulated group, whereas the OCR was relatively unaffected by IFN‐γ (Fig. 2K), confirming the reconfiguration of energy metabolism toward glycolysis and uncoupling of glycolysis and TCA cycle. Simultaneous addition of oligomycin, which inhibits ATP synthase, and FCCP, which uncouples respiration from ATP synthesis by dissipating the proton gradient, increased the OCR and the ECAR in treatment and control groups (Fig. 2K). However, hMSCs with IFN‐γ treatment showed higher maximum glycolytic capacity, while the maximum respiratory capacity was comparable to the unstimulated hMSCs (Fig. 2L). These results demonstrate that IFN‐γ enhances glycolysis and increases the metabolic potential in hMSCs and also suggest the increased incorporation of other potential nutrients in place of glucose to maintain metabolism activities in response to IFN‐γ treatment.
Aerobic Glycolysis Is Required for the Secretion of IDO and PGE2 in hMSCs
To determine whether the increased glycolysis metabolism following IFN‐γ treatment is functionally required for the transition to the immunosuppressive phenotype, hMSCs were cultured in medium containing varying concentrations of glucose and pyruvate in the absence and presence of IFN‐γ, assaying for kynurenine levels as a marker for the immunosuppressive phenotype. In the absence of glucose and pyruvate, IFN‐γ treatment results in increased kynurenine, which may be due to existing intracellular metabolites utilized for IDO production. However, addition of 2 mM sodium pyruvate alone did not increase kynurenine concentration compared with glucose‐free and pyruvate‐free media. Furthermore, addition of glucose at 1, 2, or 20 mM for 48 hours culture without addition of pyruvate resulted in a significant, concentration‐dependent increase in the level of kynurenine, suggesting glycolysis rather than pyruvate metabolism is responsible for IDO production (Fig. 3A). In agreement with the data on glycolysis, culturing at 20 mM glucose while inhibiting glycolysis with 2‐deoxyglucose (2‐DG) reduced the kynurenine level, again in a 2‐DG dose‐dependent manner (Fig. 3B). The effect of 2‐DG was also observed in reduced IDO protein and mRNA levels (Fig. 3C and 3D), reduced PGE2 and COX2 mRNA levels, and reduced PGE2 secretion (Fig. 3E and 3F). These results demonstrate that, instead of pyruvate metabolism, glycolysis provides the carbon source and energy metabolism for IDO and PGE2 production in immunosuppressive hMSCs.
Figure 3.
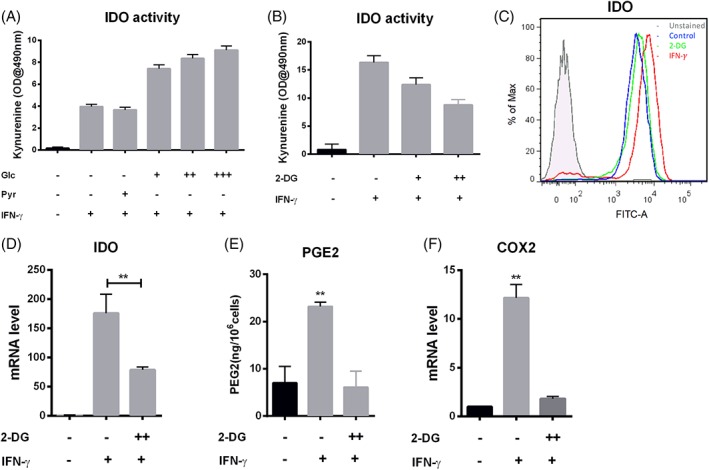
Glycolysis is required for the secretion of IDO and PGE2 in hMSCs. (A): IDO activity as a function of carbon source and IFN‐γ licensing; pyruvate (Pyr) at 2 mM, or glucose at 1 (+), or 2 (++), or 20 (+++) mM in the presence and absence of IFN‐γ; (B): IDO activity with or without glycolytic inhibition; 2‐DG treatment at 2 mM (+) or 5 mM (++) in the presence of IFN‐γ; (C): Flow‐cytometric measurement of IDO expression with or without 5 mM 2‐DG in the presence of IFN‐γ, hMSCs without any treatment were used as control; (D): qRT‐PCR measurement of IDO mRNA level in hMSCs with or without 2‐DG treatment in the presence of IFN‐γ. (E): PGE2 level in cell culture supernatant from 2‐DG at 5 mM (++) in the presence of IFN‐γ, normalized by cell number; (F): qRT‐PCR measurement of COX2 mRNA level with or without 2‐DG at 5 mM (++) treatment in the presence of IFN‐γ. *, p < .05; **, p < .01.
Mitochondrial ROS Is Required for Glycolysis and IDO Activation
Both mROS (Fig. 4A) and total ROS levels (Fig. 4B) were increased in IFN‐γ treated hMSCs, which is consistent with increased glycolytic and reduced mitochondrial electron transport activity in response to IFN‐γ. To determine whether mROS are functionally important for activation of hMSC immunosuppressive properties, cells were treated with the mitochondria‐targeted antioxidant mitoquinone (MitoQ) in the presence of IFN‐γ. MitoQ partitions into the mitochondrial membrane where it is reduced by Complex II, generating a pool of molecules that are available to neutralize ROS 35. As expected, MitoQ treatment prevented the IFN‐γ‐induced mROS increase (Fig. 4A), and reduced both IDO expression and activity (Fig. 4C and 4D). Importantly, the reduction in mROS level with MitoQ treatment was also associated with decreased GLUT1 expression (Fig. 4E), suggesting that mROS may function to “instruct” the glucose transport and activation of glycolysis in hMSCs in response to IFN‐γ licensing.
Figure 4.
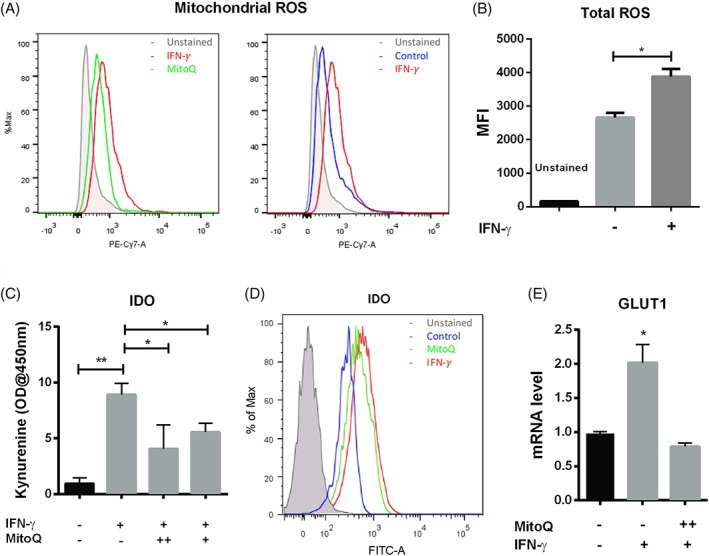
Mitochondrial ROS are required for IDO activation following IFN‐γ licensing. (A): Flow‐cytometric measurement of hMSCs mitochondrial ROS with or without MitoQ (1.0 μM) treatment in the presence of IFN‐γ, hMSCs without any treatment were used as control; (B): Mean fluorescent intensity (MFI) of Carboxy‐H2DCFDA for total ROS measurement in the presence and absence of IFN‐γ; (C): IDO activity with or without MitoQ treatment at 0.5 μM (+), or 1.0 μM (++) in the presence of IFN‐γ; (D): Flow‐cytometric measurement of IDO expression of hMSCs with MitoQ (1.0 μM) treatment in the presence of IFN‐γ, hMSCs without any treatment were used as control; (E): qRT‐PCR measurement of GLUT1 mRNA level in hMSCs with MitoQ treatment at 1.0 μM (++) in the presence of IFN‐γ. *, p < .05; **, p < .01.
Inhibition of Complex I and III Promotes Secretion of Immunosuppressive Cytokines and Suppression on T‐Cell Proliferation
To determine the role of mitochondrial electron transport in hMSC immune activation, cells were pretreated with inhibitors of mitochondrial Complex I (2 μM rotenone) or Complex III (6 μM Antimycin A) followed by incubation with IFN‐γ for 24 hours. As expected, inhibiting oxidative phosphorylation with rotenone, AmA (Fig. 5A), or by hypoxia (Fig. 5B) strongly increased both IDO activity and expression (Fig. 5C) following IFN‐γ treatment compared with the IFN‐γ treatment control group. IFN‐γ activation in the presence of the electron transport inhibitors or hypoxia resulted in significantly increased consumption of glucose and release of lactate (Fig. 5D), consistent with increased glycolytic activity. Of interest, cell permeable diethyl butylmalonate (DEBM), which inhibits mitochondrial succinate transport and accumulates endogenous succinate, did not increase IDO activity (Fig. 5E), suggesting a differential role for the mitochondrial complexes in regulating immuno‐activation in hMSCs. T‐cell proliferation assay also confirmed the regulation of hMSCs immuno‐activation via mitochondrial electron transport inhibition. CD3+ and CD45+ T‐cells proliferation was analyzed by the dilution of CFSE intensity via flow cytometry. Co‐culture with hMSC inhibited stimulated T‐cell proliferation characterized by reduced division compared with the non co‐culture groups (Fig. 6A). The inhibitory effect was attenuated by 2‐DG pretreatment as division peak number increased (Fig. 6B). However, the immunomodulatory capacity of hMSCs was enhanced by AmA and rotenone pretreatment. The T‐cell division peak number was further decreased after coculture with pretreated hMSCs, as rotenone‐treated cells had slightly stronger effect compared to AmA pretreatment (Fig. 4C and 4D, Supporting Information Fig. S3). Together, mitochondrial electron transport inhibition upon IFN‐γ treatment appears to reconfigure hMSC metabolism toward a glycolytic phenotype, thereby enhancing hMSCs immunosuppressive properties.
Figure 5.
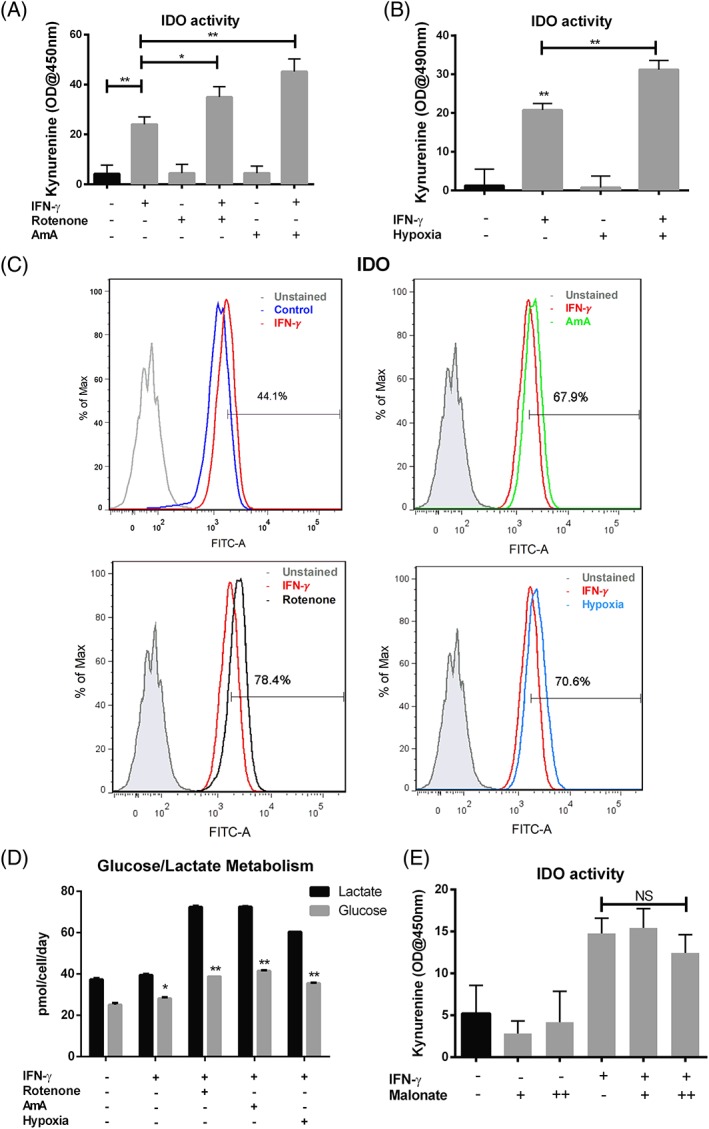
Inhibition of mitochondrial electron transport chain complex I or III promotes anti‐inflammatory cytokine secretion via activation of glycolysis. (A): IDO activity with or without AmA (6 μM), rotenone (2 μM) and (B): Hypoxia treatment (24 h) in the presence and absence of IFN‐γ; (C): Flow‐cytometric measurement of IDO expression with or without AmA (6 μM), rotenone (2 μM), and hypoxia treatment (24 hours) in the presence of IFN‐γ, hMSCs without any treatment were used as control; (D): Normalized lactate and glucose amount in spent medium with or without AmA (6 μM), rotenone (2 μM) or hypoxia treatment (24 hours) in the presence and absence of IFN‐γ; (E): IDO activity with or without diethyl butylmalonate (DEBM) treatment at 1 mM (+) or 2 mM (++) in the presence and absence of IFN‐γ. NS, p > .05; *, p < .05; **, p < .01.
Figure 6.
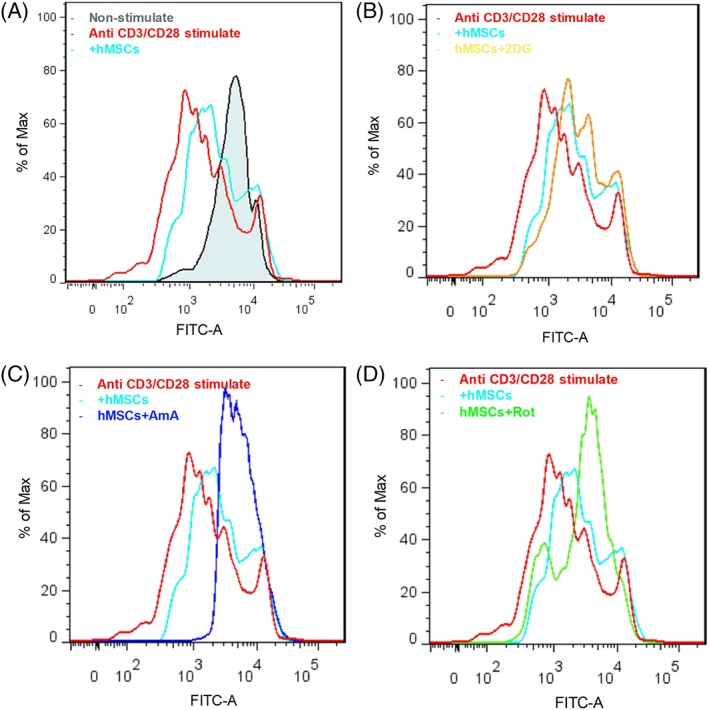
Anti‐CD3/CD28 stimulated T cells proliferation as measured by carboxyfluorescein succinimidyl ester (CFSE) in the presence and absence of hMSCs coculture. CD3+ and CD45+ T‐cells were gated. (A): Anti‐CD3/CD28 stimulated T‐cells cultured alone or co‐cultured with hMSCs. (B): Anti‐CD3/CD28 stimulated T cells cocultured with hMSCs or 2‐DG pretreated hMSCs, or (C): AmA pretreated hMSCs, or (D): Rotenone pretreated hMSCs.
mTORC1 Positively Regulates ROS Level and Glycolysis in IFN‐γ (40 ng/ml) Treated hMSCs
To investigate the regulation of energy metabolism in the production of immunosuppressive cytokines, the expression of pAkt and the effects of rapamycin treatment on PGE2 secretion and IDO activity were analyzed. The PI3‐kinase/Akt signaling cascade and its downstream effector mTORC1 are well‐characterized regulators of metabolic pathways, including glycolysis and mitochondrial metabolism in many cell types, and are known to play a significant role in macrophage classic polarization and T‐cell activation. We found increased phosphorylation of Akt and mTORC1 effector protein S6K in hMSCs with IFN‐γ treatment compared with nontreated cells (Fig. 7A and 7B). Rapamycin (50 nM), an inhibitor of mTOR, reduced the IFN‐γ–dependent increase in kynurenine and PGE2 (Fig. 7C and 7D), reduced the IFN‐γ–dependent increase in mROS (Fig. 7E), and lowered glucose consumption (Fig. 7F). These results show that IFN‐γ treatment activates the Akt and mTORC1 signaling cascade in hMSCs, which then alters the metabolic profile to support the increased IDO production associated with enhanced immunosuppressive function. Our results show that Akt / mTOR cascade plays a central role in nutrient sensing and regulates the secretion of immunosuppressive cytokines.
Figure 7.
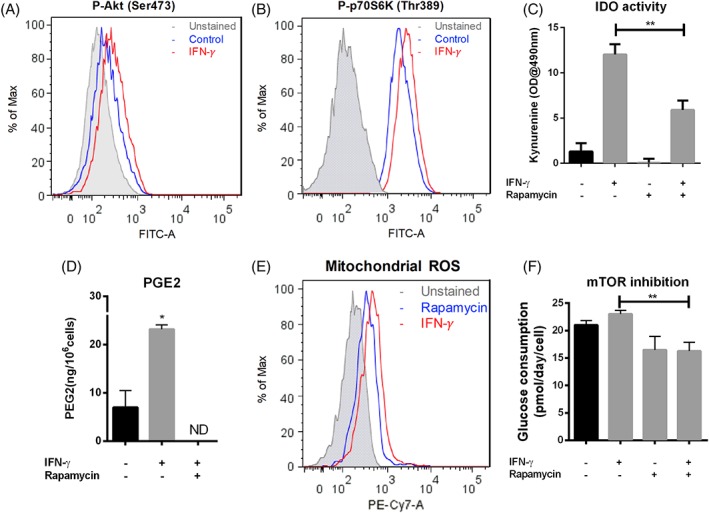
mTORC1 positively regulates ROS level and glycolysis in IFN‐γ (40 ng/ml) treated hMSCs. (A): Flow‐cytometric measurement of phosphorylated Akt at Ser 473 of hMSCs in the presence and absence (as control) of IFN‐γ; (B): Flow‐cytometric measurement of phosphorylated S6K at Thr89 in the presence and absence (as control) of IFN‐γ; (C): IDO activity with or without rapamycin treatment at (50 nM) in the presence and absence of IFN‐γ; (D): PGE2 level in cell culture supernatant from rapamycin (50 nM) treated or non‐treated cells in the presence of IFN‐γ, normalized by cell number; (E): Flow‐cytometric measurement of MitoSox red stained hMSCs with rapamycin treatment (50 nM) in the presence of IFN‐γ; (F): Normalized extracellular glucose as a function of rapamycin (50 nM) and IFN‐γ treatment. *, p < .05; **, p < .01.
Discussion
There is intense interest in understanding the regulatory mechanisms that preserve and enhance the clinically relevant functional properties of hMSC, the most commonly tested adult stem cells in cell therapy, to overcome existing barriers to effective, reproducible clinical translation. As the primary function of hMSCs in this regard is to empower host cells to facilitate endogenous tissue repair, the current lack of knowledge about the molecular mechanisms that regulate hMSC immunomodulatory properties presents a critical barrier to identifying new molecular targets or engineering strategies to manipulate and enhance these therapeutic functions 1. It is clearly established that central energy metabolism plays a critical role in modulating and potentially dictating immune cell function 1; here we investigated whether energy metabolism plays a similar role in underpinning the IFN‐γ‐induced immunomodulation in hMSCs. We found that IFN‐γ licensing increases glycolysis and reduces TCA cycle metabolism, essentially reconfiguring energy metabolism toward a primarily glycolytic phenotype. We also showed that these metabolic changes are required to support the production of the key immunosuppressive cytokines such as IDO and PGE2. Mechanistically our data suggest a critical role for mROS and the involvement of Akt / mTOR signaling in initiating this metabolic reconfiguration in response to inflammatory stimuli.
Glycolysis Sustains hMSC Immunosuppressive Property
The extraordinary immunomodulatory properties of hMSCs largely depend on secreted factors such as IDO, PGE‐2, TGF‐β, and PD‐L1 1, 12, 36, 37. Naïve hMSCs do not secrete these factors and must be activated or “licensed” by exposure to the inflammatory cytokine IFN‐γ to exert their immunomodulatory effects 38. The current study showed that IFN‐γ increased glycolytic activity as evidenced by increased levels of lactate, increased glucose consumption and extracellular acidification rate, increased expression of GLUT1 and HK2, reduced the fraction of glucose‐derived carbons introduced into the TCA cycle, and reduced electron transport and oxidative phosphorylation (Fig. 2). At the same time, IFN‐γ treatment increased the secretion of kynurenine and PGE2 and increased the level of mRNA for IDO and COX2 (Fig. 1). A similar shift in energy metabolism toward aerobic glycolysis and away from oxidative phosphorylation is seen during activation of anti‐inflammatory immune cells in response to environmental stimuli such as migration and antigen presentation, where this metabolic profile is required to fuel the increased anabolic activity associated with increased biomolecule synthesis 39. For example, the activation of dendritic cells (DCs) by toll‐like receptor (TLR) results in a robust increase in glycolytic flux, which provides metabolites for lipid and protein synthesis to support the stable antigen presentation and the production of regulatory chemokines and cytokines 40, 41. Importantly, we observed that the IFN‐γ‐induced increase in IDO activity was dependent on the concentration of glucose in the culture medium, and that the increase in IDO and COX2 activity was blocked by 2‐DG. By comparison, pyruvate, the “product” of glycolysis that readily enters the TCA cycle under normal aerobic conditions, was unable to support increased IDO activity in response to IFN‐γ licensing (Fig. 3). Together, these results directly support the idea that aerobic glycolysis sustains the production of immunomodulatory factors in response IFN‐γ treatment.
Mitochondrial Signaling in hMSC Immune Polarization
Mitochondria are popularly known as the “powerhouse” of the cells, but numerous studies provide evidence that mitochondria actively participate in cell signaling and play essential roles in immunity 42, 43. Mitochondria constantly communicate with the cytosol and regulate cell fate through anterograde and retrograde signaling to either maintain homeostasis or initiate biological responses to external stress. For example, influx of cytosolic calcium into the mitochondrial matrix activates multiple enzymes of the TCA cycle and the electron transport chain, whereas TCA cycle intermediates, such as succinate, fumarate and citrate, are themselves signaling molecules that regulate immunity and inflammation in both innate and adaptive immune cells 6, 43, 44, 45, 46. In multiple immune cells, including CD4+ T cells and classically activated macrophages, disruption of mitochondrial Complex I and III by inhibitors or reduced oxygen conditions enhances mROS generation, which has been shown to promote glycolysis and the immune response 46, 47. Additionally, it has been suggested that the commitment to glycolysis during activation of DCs and macrophages is mechanistically attributed to the interruption of the mitochondrial respiratory chain and the corresponding release of mROS and TCA cycle metabolites including citrate and succinate 41, 46, 47. Similarly, the dynamics of mitochondrial fusion and fission is a signaling mechanism that controls T‐cell fate through metabolic reprogramming 48.
We previously established that mitochondria also play important signaling roles in hMSCs. For example, inhibition of the mitochondrial electron transport chain using small molecule inhibitors was sufficient to alter expression of genes related to glycolysis and stem cell pluripotency 9. In the current study, we observed that IFN‐γ treatment reduced mitochondrial respiration, as evidenced by reduced mitochondrial transmembrane potential and mitochondrial complex I activity (Fig. 2). Furthermore, we identified that the release of mROS resulting from the inhibition of mitochondrial electron transport is mechanistically linked to the increased glycolysis and IDO production and activity following IFN‐γ treatment (Fig. 4). We propose that hMSC immunosuppressive properties induced by IFN‐γ treatment require effective metabolic reconfiguration toward glycolysis, which can be potentiated by suppression of mitochondrial functions. Indeed, we demonstrated that inhibition of mitochondrial electron transport complexes I or III by rotenone or AmA in the presence of IFN‐γ enhanced IDO production beyond that induced by IFN‐γ treatment alone (Fig. 5). This is similar to what has been reported in the case of classically activated macrophages, namely that treatment by lipopolysaccharides (LPS) impairs mitochondrial function and generates ROS, which then governs the production of proinflammatory cytokines, including IL‐6 and TNF‐α 49.
In addition to mROS, other mitochondrial metabolites such as citrate and succinate have been suggested as intracellular signaling molecules that directly regulate cell fate, including the emergence of cancer stem cells and inflammatory response of immune cells 50, 51. In the current study, we observed accumulation of intracellular citrate, ATP, and succinate in IFN‐γ‐treated hMSCs (Fig. 2). In macrophages, accumulation of succinate as a result of mitochondrial electron transport complex II impairment induced the glycolytic phenotype via induction of HIF‐1α, and eventually primed M1 immune polarization and IL‐1β secretion 52, 53. The disruption of the TCA cycle as a result of repressed isocitrate dehydrogenase leads to a re‐routing of citrate into fatty acid synthesis in activated DCs to support the expansion of endoplasmic reticulum (ER) and Golgi that is required for the production of secreted proteins that are integral to DC activation 41. Nutrient‐responsive metabolites such as ATP and acetyl‐CoA regulate cellular signaling and epigenetic control of transcription programs governing autophagy and rejuvenations 51, 54. Whether any or all of these mechanisms operate in IFN‐γ licensing of hMSCs is an area of active investigation in our laboratory.
Akt and mTOR Signaling Is Required for IDO Production
The mTOR proteins and its effector Akt play central roles in nutrient sensing and maintaining cellular and metabolic homeostasis in response to external stimuli 55. Our data establish that mTOR signaling pathways are activated following IFN‐γ treatment and its inhibition reduces hMSC IDO and PGE2 secretion, highlighting mTOR's central role between hMSC energy metabolism and immunomodulatory properties (Fig. 7). Akt is a major downstream target of PI3K and plays an important role in promoting glycolysis by stimulating the expression of GLUT1 and activating HK2 and phosphofructokinase (PFK), the enzymes that provide overall control of glycolytic activity. Mounayar et al., have shown that IFN‐γ activates the PI3K pathway followed by PI3K‐mediated phosphorylation of STAT1 in the regulation of hMSC IDO production 56. The mTORC1 activation is directly or indirectly associated with increased translation of glycolytic enzymes and their transcriptional regulators through its nutrient‐sensing complex downstream of PI3K/Akt signaling 57. Akt/mTOR signaling coordinates with many aspects of stem cell events including cell proliferation, senescence, migration, and hypoxia sensing 58. The impact of mTOR on hMSC glucose uptake and IDO production is relevant through its broad nutrient‐sensing effects on de novo protein synthesis. Indeed, serum/glucose starvation is sufficient to inhibit mTORC1 activity, correlated with reduced IFN‐γ production in CD8+ effector T cells, an event that can also be recapitulated by treatment of protein synthesis inhibitor cycloheximide 59, and as shown here for hMSC (Fig. 3).
The current study showed that inhibition of mTOR activity by rapamycin inhibited IFN‐γ‐induced IDO production in hMSCs with concurrent reduction in glucose consumption (Fig. 7). The inhibitory effect of rapamycin on hMSC IDO production is of particular interest given that rapamycin is a widely prescribed drug for immune suppression. This raises the possibility that the therapeutic use of hMSCs with immune suppression drugs, such as rapamycin or the AMPK‐targeting drug metformin, may cause metabolic stress in hMSCs, potentially exerting a negative effect on the ability of hMSCs to stimulate endogenous host tissue repair 60.
Implication of Metabolic Regulation of hMSCs Immunosuppressive Property on Chronic Inflammation Diseases
The desired immunomodulatory effects of hMSC transplantation therapy in inflammatory disease are not always realized due to an absence of effective means to manipulate and control hMSC immuno‐plasticity. The immunosuppressive action of hMSCs requires stimulation by proinflammatory mediators, such as M1 macrophages or effector T cells, to form a negative feedback loop via the secretion of IFN‐γ or TNF‐α 61. The low amount of IFN‐γ present in chronic inflammation or the presence of immunosuppressive cytokine TGF‐β during the remission stage of inflammation may not only abolish the secretion of immunomodulatory factors by hMSCs 62, but may actually cause the hMSCs to contribute to the inflammation response by releasing chemokines that induce T‐cell chemotaxis and proliferation 1, 63. Indeed, administration of hMSCs for the treatment of graft‐versus‐host disease (GvHD) is much less effective when MSCs are infused prior to the onset of inflammation compared with infusion during acute inflammation 64. Many studies have attempted to address the inadequate immunomodulatory potency of hMSCs by artificially imposing a more robust inflammatory environment on hMSCs using biocompatible materials 65, 66. However, these approaches involve the delivery of either proinflammatory cytokines or exogenous particles in vivo that themselves appear to be inflammatory to host defense system. Thus, understanding the metabolic mechanism and identification of potential molecular target(s) in hMSC‐mediated immune regulation is important for identification of hMSC subset and the development of strategies that sustain proper immune polarization in clinical applications.
The present study focused on the metabolic regulation of hMSC immune polarization by characterization of secreted immunomodulatory factors and its impact on T‐cell proliferation. However, hMSCs also modulate the progress of inflammation via the engagement of programmed cell death protein 1 (PD‐1) and its ligands PD‐L1 and PD‐L2 through cell–cell contact or as secreted factors 37, 67 and how hMSC metabolism influences these interactions remains unknown. Future studies are also required to investigate the effects of hMSC metabolism on plasticity of hMSC in immunomodulation, T‐cell chemotaxis, and the specific T‐cell functions, such as the generation of cytotoxic T‐cells and T‐cell effector function. Nevertheless, the current work demonstrates the feasibility of metabolic preconditioning of hMSCs to potentiate their immunomodulatory properties. This simple approach has significant potential for clinical application as it does not require coinjection of materials that may be inflammatory to the host defense system or involve gene modifications such as Akt overexpression that may be tumorigenic.
Conclusion
The results of the current study showed that the immunosuppressive properties of hMSCs in response to licensing by the inflammatory cytokine IFN‐γ depends on an Akt/mTOR‐mediated metabolic reconfiguration toward aerobic glycolysis. This glycolysis enhancement is initiated or accompanied by the inhibition of mitochondrial electron transport activity and the release of mROS. The study revealed the metabolic basis of hMSC immunomodulation and demonstrated the potential of targeted metabolic manipulations designed to enhance and control hMSC's immunomodulatory properties.
Author Contributions
Y.J.L.: conception and design, collection and/or assembly of data, data analysis, and interpretation, manuscript writing; X.G.Y., N.M: collection and/or assembly of data, data analysis, and interpretation; T.M.L.: conception and design, financial support, data analysis and interpretation, and manuscript writing; T.M.: conception and design, financial support, administrative support, data analysis and interpretation, manuscript writing, and final approval of manuscript.
Disclosure of Potential Conflicts of Interest
The authors indicated no potential conflicts of interest.
Supporting information
Appendix S1: Supporting Information.
Acknowledgments
The authors would like to thank Ruth Didier of FSU Department of Biomedical Sciences for her help in flow cytometry and Dr. Brian Washburn and Kristina Poduch of FSU Department of Biomedical Sciences for performing qRT‐PCR experiments. This work was supported by National Science Foundation Award (CBET #1743426).
References
- 1. Wang Y, Chen X, Cao W et al. Plasticity of mesenchymal stem cells in immunomodulation: pathological and therapeutic implications. Nat Immunol 2014;15:1009–1016. [DOI] [PubMed] [Google Scholar]
- 2. Luz‐Crawford P, Kurte M, Bravo‐Alegria J et al. Mesenchymal stem cells generate a CD4+CD25+Foxp3+ regulatory T cell population during the differentiation process of Th1 and Th17 cells. Stem Cell Res Therapy 2013;4:65. [DOI] [PMC free article] [PubMed] [Google Scholar]
- 3. Ge W, Jiang J, Arp J et al. Regulatory T‐cell generation and kidney allograft tolerance induced by mesenchymal stem cells associated with indoleamine 2,3‐dioxygenase expression. Transplantation 2010;90:1312–1320. [DOI] [PubMed] [Google Scholar]
- 4. Francois M, Romieu‐Mourez R, Li MY et al. Human MSC Suppression Correlates With Cytokine Induction of Indoleamine 2,3‐Dioxygenase and Bystander M2 Macrophage Differentiation. Mol Ther 2012;20:187–195. [DOI] [PubMed] [Google Scholar]
- 5. Mirlekar B, Gautam D, Chattopadhyay S. Chromatin Remodeling Protein SMAR1 Is a Critical Regulator of T Helper Cell Differentiation and Inflammatory Diseases. Front Immunol 2017;8:72. [DOI] [PMC free article] [PubMed] [Google Scholar]
- 6. Pearce EL, Pearce EJ. Metabolic pathways in immune cell activation and quiescence. Immunity 2013;38:633–643. [DOI] [PMC free article] [PubMed] [Google Scholar]
- 7. Palsson‐McDermott Eva M, Curtis Anne M, Goel G et al. Pyruvate kinase M2 regulates Hif‐1α activity and IL‐1β induction and is a critical determinant of the Warburg effect in LPS‐activated macrophages. Cell Metab 2015;21:65–80. [DOI] [PMC free article] [PubMed] [Google Scholar]
- 8. Geng Y, Hansson GK, Holme E. Interferon‐gamma and tumor necrosis factor synergize to induce nitric oxide production and inhibit mitochondrial respiration in vascular smooth muscle cells. Circ Res 1992;71:1268–1276. [DOI] [PubMed] [Google Scholar]
- 9. Liu Y, Munoz N, Tsai AC et al. Metabolic reconfiguration supports reacquisition of primitive phenotype in human mesenchymal stem cell aggregates. Stem Cells 2017;35:398–410. [DOI] [PubMed] [Google Scholar]
- 10. Liu Y, Ma T. Metabolic regulation of mesenchymal stem cell in expansion and therapeutic application. Biotechnol Prog 2015;31:468–481. [DOI] [PubMed] [Google Scholar]
- 11. Plumas J, Chaperot L, Richard MJ et al. Mesenchymal stem cells induce apoptosis of activated T cells. Leukemia 2005;19:1597–1604. [DOI] [PubMed] [Google Scholar]
- 12. Galipeau J, Krampera M, Barrett J et al. International Society for Cellular Therapy perspective on immune functional assays for mesenchymal stromal cells as potency release criterion for advanced phase clinical trials. Cytotherapy 2016;18:151–159. [DOI] [PMC free article] [PubMed] [Google Scholar]
- 13. Sheng HM, Wang Y, Jin YQ et al. A critical role of IFN gamma in priming MSC‐mediated suppression of T cell proliferation through up‐regulation of B7‐H1. Cell Res 2008;18:846–857. [DOI] [PubMed] [Google Scholar]
- 14. Ren G, Su J, Zhang L et al. Species variation in the mechanisms of mesenchymal stem cell‐mediated immunosuppression. Stem Cells 2009;27:1954–1962. [DOI] [PubMed] [Google Scholar]
- 15. Croitoru‐Lamoury J, Lamoury FM, Caristo M et al. Interferon‐gamma regulates the proliferation and differentiation of mesenchymal stem cells via activation of indoleamine 2,3 dioxygenase (IDO). PloS One 2011;6:e14698. [DOI] [PMC free article] [PubMed] [Google Scholar]
- 16. Mbongue JC, Nicholas DA, Torrez TW et al. The role of indoleamine 2, 3‐dioxygenase in immune suppression and autoimmunity. Vaccine 2015;3:703–729. [DOI] [PMC free article] [PubMed] [Google Scholar]
- 17. Meisel R, Zibert A, Laryea M et al. Human bone marrow stromal cells inhibit allogeneic T‐cell responses by indoleamine 2,3‐dioxygenase‐mediated tryptophan degradation. Blood 2004;103:4619–4621. [DOI] [PubMed] [Google Scholar]
- 18. Glennie S, Soeiro I, Dyson PJ et al. Bone marrow mesenchymal stem cells induce division arrest anergy of activated T cells. Blood 2005;105:2821–2827. [DOI] [PubMed] [Google Scholar]
- 19. Liang C, Jiang E, Yao J et al. Interferon‐gamma mediates the immunosuppression of bone marrow mesenchymal stem cells on T‐lymphocytes in vitro. Hematology 2018;23:44–49. [DOI] [PubMed] [Google Scholar]
- 20. Yi JZ, Chen ZH, Xu FH et al. Interferon‐gamma suppresses the proliferation and migration of human placenta‐derived mesenchmal stromal cells and enhances their ability to induce the generation of CD4(+)CXCR5(+)Foxp3(+)Treg subset. Cell Immunol 2018;326:42–51. [DOI] [PubMed] [Google Scholar]
- 21. Klinker MW, Marklein RA, Lo Surdo JL et al. Morphological features of IFN‐gamma‐stimulated mesenchymal stromal cells predict overall immunosuppressive capacity. Proc Natl Acad Sci U S A 2017;114:E2598–E2607. [DOI] [PMC free article] [PubMed] [Google Scholar]
- 22. Hemeda H, Jakob M, Ludwig AK et al. Interferon‐gamma and tumor necrosis factor‐alpha differentially affect cytokine expression and migration properties of mesenchymal stem cells. Stem Cells Dev 2010;19:693–706. [DOI] [PubMed] [Google Scholar]
- 23. Sivanathan KN, Rojas‐Canales D, Grey ST et al. Transcriptome profiling of IL‐17A preactivated mesenchymal stem cells: a comparative study to unmodified and IFN‐gamma modified mesenchymal stem cells. Stem Cells Int 2017;2017:1025820. [DOI] [PMC free article] [PubMed] [Google Scholar]
- 24. Yang KQ, Liu Y, Huang QH et al. Bone marrow‐derived mesenchymal stem cells induced by inflammatory cytokines produce angiogenetic factors and promote prostate cancer growth. BMC Cancer 2017;17:878. [DOI] [PMC free article] [PubMed] [Google Scholar]
- 25. Liu Y, Han ZP, Zhang SS et al. Effects of inflammatory factors on mesenchymal stem cells and their role in the promotion of tumor angiogenesis in colon cancer. J Biol Chem 2011;286:25007–25015. [DOI] [PMC free article] [PubMed] [Google Scholar]
- 26. Zhao F, Ma T. Perfusion bioreactor system for human mesenchymal stem cell tissue engineering: Dynamic cell seeding and construct development. Biotechnol Bioeng 2005;91:482–493. [DOI] [PubMed] [Google Scholar]
- 27. Grayson WL, Ma T, Bunnell B. Human mesenchymal stem cells tissue development in 3D PET matrices. Biotechnol Prog 2004;20:905–912. [DOI] [PubMed] [Google Scholar]
- 28. Munoz N, Kim J, Liu Y et al. Gas chromatography‐mass spectrometry analysis of human mesenchymal stem cell metabolism during proliferation and osteogenic differentiation under different oxygen tensions. J Biotechnol 2014;169:95–102. [DOI] [PubMed] [Google Scholar]
- 29. Kim J, Ma T. Bioreactor strategy in bone tissue engineering: Pre‐culture and osteogenic differentiation under two flow configurations. Tissue Eng Part A 2012;18:2354–2364. [DOI] [PMC free article] [PubMed] [Google Scholar]
- 30. Solis MA, Wei YH, Chang CH et al. Hyaluronan upregulates mitochondrial biogenesis and reduces adenoside triphosphate production for efficient mitochondrial function in slow‐proliferating Human mesenchymal stem cells. Stem Cells 2016;34:2512–2524. [DOI] [PubMed] [Google Scholar]
- 31. Liu Y, Munoz N, Bunnell BA et al. Density‐dependent metabolic heterogeneity in human mesenchymal stem cells. Stem Cells 2015;33:3368–3381. [DOI] [PMC free article] [PubMed] [Google Scholar]
- 32. Mawhinney TP, Robinett RSR, Atalay A et al. Analysis of amino‐acids as their tert‐butyldimethylsilyl derivatives by gas‐liquid‐chromatography and mass‐spectrometry. J Chromatogr 1986;358:231–242. [DOI] [PubMed] [Google Scholar]
- 33. Mawhinney TP, Robinett RSR, Atalay A et al. Gas‐liquid‐chromatography and mass‐spectral analysis of monocarboxylates and dicarboxylates and tricarboxylates as their tert‐butyldimethylsilyl derivatives. J Chromatogr 1986;361:117–130. [DOI] [PubMed] [Google Scholar]
- 34. Ohkouchi S, Block GJ, Katsha AM et al. Mesenchymal stromal cells protect cancer cells from ROS‐induced apoptosis and enhance the Warburg effect by secreting STC1. Molecular Therapy 2012;20:417–423. [DOI] [PMC free article] [PubMed] [Google Scholar]
- 35. James AM, Sharpley MS, Manas AR et al. Interaction of the mitochondria‐targeted antioxidant MitoQ with phospholipid bilayers and ubiquinone oxidoreductases. J Biol Chem 2007;282:14708–14718. [DOI] [PubMed] [Google Scholar]
- 36. Prockop DJ, Oh JY. Mesenchymal stem/stromal cells (MSCs): Role as guardians of inflammation. Mol Ther 2012;20:14–20. [DOI] [PMC free article] [PubMed] [Google Scholar]
- 37. Davies LC, Heldring N, Kadri N et al. Mesenchymal stromal cell secretion of programmed death‐1 ligands regulates T cell mediated immunosuppression. Stem Cells 2017;35:766–776. [DOI] [PMC free article] [PubMed] [Google Scholar]
- 38. Waterman RS, Tomchuck SL, Henkle SL et al. A new mesenchymal stem cell (MSC) paradigm: polarization into a pro‐inflammatory MSC1 or an Immunosuppressive MSC2 phenotype. PloS One 2010;5:e10088. [DOI] [PMC free article] [PubMed] [Google Scholar]
- 39. Peng M, Yin N, Chhangawala S et al. Aerobic glycolysis promotes T helper 1 cell differentiation through an epigenetic mechanism. Science 2016;354:481–484. [DOI] [PMC free article] [PubMed] [Google Scholar]
- 40. Everts B, Amiel E, van der Windt GJW et al. Commitment to glycolysis sustains survival of NO‐producing inflammatory dendritic cells. Blood 2012;120:1422–1431. [DOI] [PMC free article] [PubMed] [Google Scholar]
- 41. Everts B, Amiel E, SC‐C H et al. TLR‐driven early glycolytic reprogramming via the kinases TBK1‐IKK supports the anabolic demands of dendritic cell activation. Nat Immunol 2014;15:323–332. [DOI] [PMC free article] [PubMed] [Google Scholar]
- 42. Chandel NS. Evolution of mitochondria as signaling organelles. Cell Metab 2015;22:204–206. [DOI] [PubMed] [Google Scholar]
- 43. Mills EL, Kelly B, O'Neill LAJ. Mitochondria are the powerhouses of immunity. Nat Immunol 2017;18:488–498. [DOI] [PubMed] [Google Scholar]
- 44. Butow RA, Avadhani NG. Mitochondrial signaling: the retrograde response. Mol Cell 2004;14:1–15. [DOI] [PubMed] [Google Scholar]
- 45. Brookes PS, Yoon Y, Robotham JL et al. Calcium, ATP, and ROS: a mitochondrial love‐hate triangle. Am J Physiol Cell Physiol 2004;287:C817–C833. [DOI] [PubMed] [Google Scholar]
- 46. Tannahill GM, Curtis AM, Adamik J et al. Succinate is an inflammatory signal that induces IL‐1 beta through HIF‐1 alpha. Nature 2013;496:238–242. [DOI] [PMC free article] [PubMed] [Google Scholar]
- 47. Murphy MP, Siegel RM. Mitochondrial ROS fire up T cell activation. Immunity 2013;38:201–202. [DOI] [PubMed] [Google Scholar]
- 48. Buck MD, O'Sullivan D, Geltink RIK et al. Mitochondrial dynamics controls T cell fate through metabolic programming. Cell 2016;166:63–76. [DOI] [PMC free article] [PubMed] [Google Scholar]
- 49. Bulua AC, Simon A, Maddipati R et al. Mitochondrial reactive oxygen species promote production of proinflammatory cytokines and are elevated in TNFR1‐associated periodic syndrome (TRAPS). J Exp Med 2011;208:519–533. [DOI] [PMC free article] [PubMed] [Google Scholar]
- 50. Zhang J, Nuebel E, Daley GQ et al. Metabolic regulation in pluripotent stem cells during reprogramming and self‐renewal. Cell Stem Cell 2012;11:589–595. [DOI] [PMC free article] [PubMed] [Google Scholar]
- 51. Moussaieff A, Kogan NM, Aberdam D. Concise review: Energy metabolites: Key mediators of the epigenetic state of pluripotency. Stem Cells 2015;33:2374–2380. [DOI] [PubMed] [Google Scholar]
- 52. Koivunen P, Hirsila M, Remes AM et al. Inhibition of hypoxia‐inducible factor (HIF) hydroxylases by citric acid cycle intermediates: possible links between cell metabolism and stabilization of HIF. J Biol Chem 2007;282:4524–4532. [DOI] [PubMed] [Google Scholar]
- 53. Selak MA, Armour SM, MacKenzie ED et al. Succinate links TCA cycle dysfunction to oncogenesis by inhibiting HIF‐alpha prolyl hydroxylase. Cancer Cell 2005;7:77–85. [DOI] [PubMed] [Google Scholar]
- 54. Wellen KE, Thompson CB. A two‐way street: reciprocal regulation of metabolism and signalling. Nat Rev Mol Cell Biol 2012;13:270–276. [DOI] [PubMed] [Google Scholar]
- 55. Efeyan A, Comb WC, Sabatini DM. Nutrient‐sensing mechanisms and pathways. Nature 2015;517:302–310. [DOI] [PMC free article] [PubMed] [Google Scholar]
- 56. Mounayar M, Kefaloyianni E, Smith B et al. PI3k and STAT1 interplay regulates human mesenchymal stem cell immune polarization. Stem Cells 2015;33:1892–1901. [DOI] [PMC free article] [PubMed] [Google Scholar]
- 57. Duvel K, Yecies JL, Menon S et al. Activation of a metabolic gene regulatory network downstream of mTOR complex 1. Mol Cell 2010;39:171–183. [DOI] [PMC free article] [PubMed] [Google Scholar]
- 58. Lee HJ, Ryu JM, Jung YH et al. Novel pathway for hypoxia‐induced proliferation and migration in human mesenchymal stem cells: Involvement of HIF‐1alpha, FASN, and mTORC1. Stem Cells 2015;33:2182–2195. [DOI] [PubMed] [Google Scholar]
- 59. Cham CM, Gajewski TF. Glucose availability regulates IFN‐gamma production and p70S6 kinase activation in CD8+ effector T cells. J Immunol 2005;174:4670–4677. [DOI] [PubMed] [Google Scholar]
- 60. O'Neill LA, Hardie DG. Metabolism of inflammation limited by AMPK and pseudo‐starvation. Nature 2013;493:346–355. [DOI] [PubMed] [Google Scholar]
- 61. Prockop DJ. Concise review: Two negative feedback loops place mesenchymal stem/stromal cells at the center of early regulators of inflammation. Stem Cells 2013;31:2042–2046. [DOI] [PubMed] [Google Scholar]
- 62. Nasef A, Chapel A, Mazurier C et al. Identification of IL‐10 and TGF‐beta transcripts involved in the inhibition of T‐lymphocyte proliferation during cell contact with human mesenchymal stem cells. Gene Expr 2007;13:217–226. [DOI] [PMC free article] [PubMed] [Google Scholar]
- 63. Waterman RS, Tomchuck SL, Henkle SL et al. A new mesenchymal stem cell (MSC) paradigm: polarization into a pro‐inflammatory MSC1 or an immunosuppressive MSC2 phenotype. PloS One 2010;5:e10088. [DOI] [PMC free article] [PubMed] [Google Scholar]
- 64. Sudres M, Norol F, Trenado A et al. Bone marrow mesenchymal stem cells suppress lymphocyte proliferation in vitro but fail to prevent graft‐versus‐host disease in mice. J Immunol 2006;176:7761–7767. [DOI] [PubMed] [Google Scholar]
- 65. Zimmermann JA, Hettiaratchi MH, McDevitt TC. Enhanced immunosuppression of T cells by sustained presentation of bioactive interferon‐gamma within three‐dimensional mesenchymal stem cell costructs. Stem Cells Translational Medicine 2017;6(1):223–237. [DOI] [PMC free article] [PubMed] [Google Scholar]
- 66. Ankrum JA, Dastidar RG, Ong JF et al. Performance‐enhanced mesenchymal stem cells via intracellular delivery of steroids. Sci Rep 2014;4:4645. [DOI] [PMC free article] [PubMed] [Google Scholar]
- 67. Chinnadurai R, Copland IB, Patel SR et al. IDO‐independent suppression of T cell effector function by IFN‐gamma‐licensed human mesenchymal stromal cells. J Immunol 2014;192:1491–1501. [DOI] [PubMed] [Google Scholar]
Associated Data
This section collects any data citations, data availability statements, or supplementary materials included in this article.
Supplementary Materials
Appendix S1: Supporting Information.