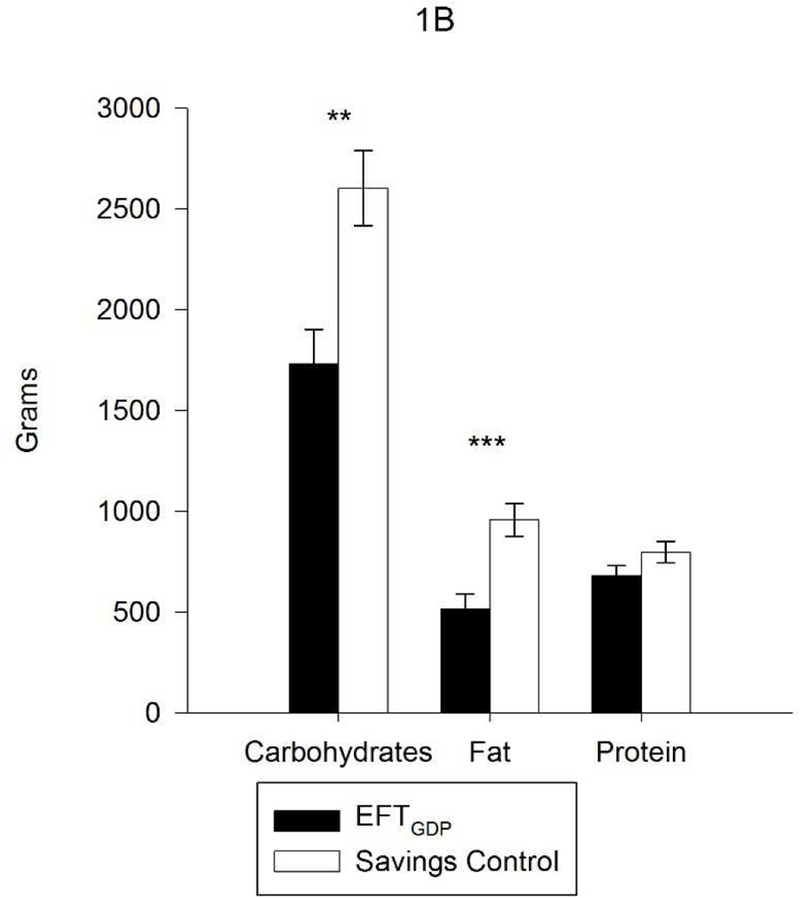
Fig. 1B.

Grams of macronutrients purchased (mean ± SE) for one week of groceries per person in the family. Participants randomized to the EFTGDP group purchased fewer grams of carbohydrates (p = .002) and fat (p = .001) than those who were randomized to the savings control group, but similar grams of protein (p = .12). * p ≤ .05 ** p ≤ .01 *** p ≤.001
