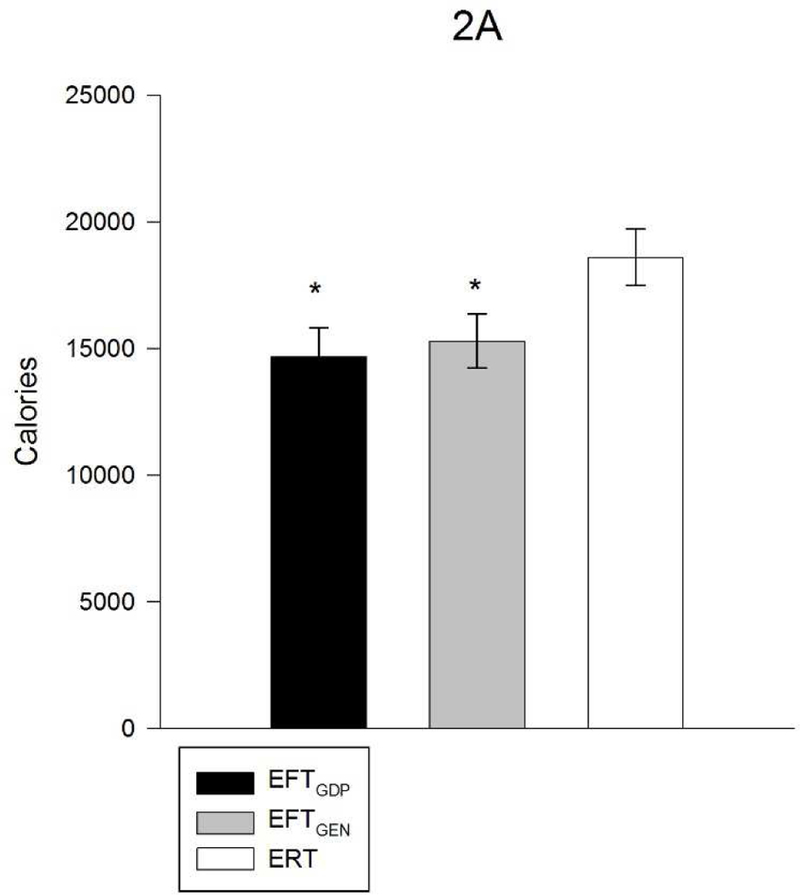
Fig. 2A.

Calories purchased (mean ± SE) for one week of groceries per person in the family. Participants randomized to the EFTGDP group and EFTGEN group purchased fewer calories than those who were randomized to the ERT games control group (p = .04), but the two EFT groups were not significantly different from each other (p = .69). * p ≤ .05 ** p ≤ .01 *** p ≤.001
