

Abstract
Key points
Newborn mice produce ultrasonic vocalization to communicate with their mother.
The neuronal glycine transporter (GlyT2) is required for efficient loading of synaptic vesicles in glycinergic neurons.
Mice lacking GlyT2 develop a phenotype that resembles human hyperekplexia and the mice die in the second postnatal week.
In the present study, we show that GlyT2‐knockout mice do not acquire adult ultrasonic vocalization‐associated breathing patterns.
Despite the strong impairment of glycinergic inhibition, they can produce sufficient expiratory airflow to produce ultrasonic vocalization.
Because mouse ultrasonic vocalization is a valuable read‐out in translational research, these data are highly relevant for a broad range of research fields.
Abstract
Mouse models are instrumental with respect to determining the genetic basis and neural foundations of breathing regulation. To test the hypothesis that glycinergic synaptic inhibition is required for normal breathing and proper post‐inspiratory activity, we analysed breathing and ultrasonic vocalization (USV) patterns in neonatal mice lacking the neuronal glycine transporter (GlyT2). GlyT2‐knockout (KO) mice have a profound reduction of glycinergic synaptic currents already at birth, develop a severe motor phenotype and survive only until the second postnatal week. At this stage, GlyT2‐KO mice are smaller, have a reduced respiratory rate and still display a neonatal breathing pattern with active expiration for the production of USV. By contrast, wild‐type mice acquire different USV‐associated breathing patterns that depend on post‐inspiratory control of air flow. Nonetheless, USVs per se remain largely indistinguishable between both genotypes. We conclude that GlyT2‐KO mice, despite the strong impairment of glycinergic inhibition, can produce sufficient expiratory airflow to produce ultrasonic vocalization.
Keywords: acoustic communication, breathing pattern, neonatal vocalization
Key points
Newborn mice produce ultrasonic vocalization to communicate with their mother.
The neuronal glycine transporter (GlyT2) is required for efficient loading of synaptic vesicles in glycinergic neurons.
Mice lacking GlyT2 develop a phenotype that resembles human hyperekplexia and the mice die in the second postnatal week.
In the present study, we show that GlyT2‐knockout mice do not acquire adult ultrasonic vocalization‐associated breathing patterns.
Despite the strong impairment of glycinergic inhibition, they can produce sufficient expiratory airflow to produce ultrasonic vocalization.
Because mouse ultrasonic vocalization is a valuable read‐out in translational research, these data are highly relevant for a broad range of research fields.
Introduction
The neuronal mechanisms of network activity that underlie the fundamental process of breathing are still not completely understood. Although it is accepted that excitatory neurons in the preBötzinger complex (preBötC) are indispensable for generation of the underlying rhythm (Gray et al. 2001; Tan et al. 2008; Vann et al. 2016), the role of inhibitory neurons is disputed (Richter & Smith, 2014; Feldman & Kam, 2015). Pharmacological blockade of synaptic inhibition has produced contradictory results, ranging from complete loss of rhythmic activity (Pierrefiche et al. 1998) or major perturbations of respiratory rhythm and pattern (Marchenko et al. 2016) to only subtle alterations of frequency and amplitude (Janczewski et al. 2013; Cui et al. 2016; Baertsch et al. 2018).
To investigate the role of inhibition for normal breathing without influence of anaesthetic agents, transgenic animal models with mutations in cellular components critical for synaptic inhibition have been widely used. Mice with substantial impairment of both GABAergic and glycinergic transmission are not viable (Feng et al. 1998; Wojcik et al. 2006; Fujii et al. 2007; Rahman et al. 2015). By contrast, mice with a selective reduction of glycinergic transmission develop a phenotype that resembles human hyperekplexia (Schaefer et al. 2013) but can survive the first week of life. For example, in mice lacking the adult isoform of the glycine receptor (Glra1) as a result of a frameshift mutation (Oscillator; Glra1spd‐ot; Buckwalter et al. 1994; Kling et al. 1997; Graham et al. 2003), the respiratory phenotype is very mild (Markstahler et al. 2002) with subtle changes of respiratory neuron activity (Busselberg et al. 2001). Because the deficit in glycinergic transmission in Glra1spd‐ot mice depends on the downregulation of the neonatal Glra2 subunit after 2 weeks of life (Becker et al. 1992), alterations of breathing in the first week of life have not yet been addressed.
Mice lacking the neuronal glycine transporter (GlyT2; slc6a5) develop the hyperekplexia‐like phenotype earlier than Glra1spd‐ot mice (Gomeza et al. 2003). Moreover, glycinergic synaptic transmission is already affected at birth in GlyT2‐knockout (KO) mice (Latal et al. 2010). We therefore reconsidered GlyT2‐KO mice as a model for the analysis of the impact of impaired glycinergic synaptic transmission on breathing behaviour during the first 2 weeks of postnatal development. Because glycinergic inhibition is considered to be required for post‐inspiratory activity and thus vocalization (Dutschmann et al. 2014; Richter & Smith, 2014), we extended our analysis to assess the postnatal development of ultrasonic vocalization (USV).
The present study aimed to identify potential alterations of breathing pattern related to the reduction of synaptic glycinergic inhibition in GlyT2‐KO mice. Because vocalization and respiration are closely linked motor activities, we also investigated, for the first time, how the interdependence of vocalizations and breathing patterns develops during the first 2 weeks of postnatal development.
Methods
Ethical approval
All experiments were performed in accordance with the directives for the welfare of experimental animals issued by the European Communities Council 86/609/EEC and 2010/63/EU and the German Protection of Animals Act (TierSchG). All procedures were conducted in agreement with § 4 Abs. 3 TierSchG (German Animal Protection Act) and were approved and registered (T12/11) by the animal welfare office and commission of the University Medical Centre Göttingen. All investigators understand the ethical principles of The Journal of Physiology and the work complies with the animal ethics checklist (Grundy, 2015).
Handling of animals
Mice were bred in the animal facility of the University Medical Centre Göttingen and kept under a 12:12 h light/dark cycle. Adult mice had access to food and water ad libitum and neonatal mice were fed by their mothers. After measurement of breathing using unrestrained whole‐body plethysmography or a piezoelectric (PZT) transducer (see below), mice were deeply anaesthetized with isoflurane (1–2 mL in a 4 L chamber) until loss of their paw withdrawal reflex and decapitated rapidly, followed by removal of the brain for the preparation of acute brain slices (see below). Mice that were not used for brain slices received an overdose of the anaesthetic before decapitation.
Experimental design
Blinding of the experiments was not possible because GlyT2‐deficient mice (GlytT2‐KO) had a white fur and therefore were readily recognizable (Fig. 1 A). This mouse line was generated on a 129/OLA background (Gomeza et al. 2003). The KO genotype and the fur colour are linked because both the GlyT2 (slc6a5) gene (Bogdanik et al. 2012) and coat colour genes (Simpson et al. 1997) are located on chromosome 7. We also cross‐bred the line with a transgenic line (Tg(Slc6a5‐EGFP)1Uze) that expressed enhanced green fluorescent protein (EGFP) under the GlyT2‐promoter (Zeilhofer et al. 2005). This allowed us to identify inhibitory neurons in the slice preparations (see below). Heterozygous mice were excluded from further analysis after genotyping.
Figure 1. Analysis of breathing and mouse ultrasonic vocalization (USV).
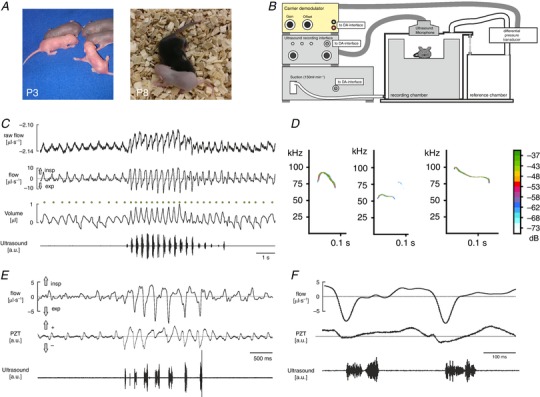
A, appearance of GlyT2‐KO mice (white fur) and WT and heterozygous littermates (black fur) at postnatal day 3 (P3) and 8 (P8). Note the growth deficit of GlyT2‐KO mice compared to littermates at P8. B, experimental set‐up for unrestrained whole body plethysmography and US recording. C, example traces from a neonate: first trace raw signal of the pressure sensor; second trace: band pass filtered raw signal removes offset defined zero crossing; third trace: integrated signal, conversion into volume information; fourth trace: US recording (40 Hz sampling rate) to define timing of the USV calls. D, example spectra of pup isolation calls. E, comparison of breathing (flow‐through configuration chamber) and the abdominal movements of mice during USV. Recordings of the flow signal (upper trace) and the signal of a piezoelectric transducer (PZT; middle trace) together with USV signal (lower trace) from a GlyT2‐KO mouse (P6). F, same recording at a higher temporal resolution showing the coincidence of a drop in the PZT signal and the expiratory peak of the flow signal, which is compatible with the concept that the expiratory flow during USV is produced by contraction of the abdominal muscles (Hernandez‐Miranda et al. 2017). [Color figure can be viewed at wileyonlinelibrary.com]
Genotyping
GlyT2‐EGFP transgenic mice (Zeilhofer et al. 2005) were genotyped by PCR using the primers 5′‐GCCGCTACCCCGACCAC‐3′ and 5′‐AGCATACGTGCACCCGCCAGG‐3′ spanning from the GlyT2 sequence to the EGFP open reading frame. GlyT2‐KO animals (Gomeza et al. 2003) were genotyped as described using the primers WT1 5′‐CCTCTTCTGCCTTTTTTGAGACTG‐3′ and WT2 5′‐ATAGCCCCCACAGCATTCATCCTG‐3′ for detection of the wild‐type (WT) allele, as well as the primers KO1 5′‐CAGCTCATTCCTCCCACTCATGAT‐3′ and KO2 5′‐AGCATGCCTAGTACAACTCGA‐3′ for the KO allele. However, because the exon, which is deleted in GlyT2‐KO mice, is present in the GlyT2‐EGFP BAC construct, this strategy could not be used to genotype GlyT2‐KO mice in the presence of the GlyT2‐EGFP transgene. Therefore, these mice were genotyped using quantitative PCR by quantifying the number of neo‐cassettes of the KO allele present in the genome to discriminate GlyT2+/− from GlyT2−/− mice. Genomic DNA was isolated from tail tips of mice using the Invisorb® Spin Tissue Mini Kit (Stratec, Edmonton, Canada). Purified DNA (50 ng) was subjected to a quantitative PCR in triplicate, using the primers: GlyT2‐KO‐s: 5′‐GCTTGGGTGGAGAGGCTATT‐3′, GlyT2‐KO‐as: 5′‐CATCAGAGCAGCCGATTGT‐3′. The gene of neuregulin‐1 was used as a reference (primer NR‐s: 5′‐GTGTGCGGAGAAGGAGAAAACT‐3′; NR‐as: 5′‐AGGCACAGAGAGGAATTCATTTCTTA‐3′). Real‐time PCR was performed on a LightCycler 480 (Roche, Basel, Switzerland) using the LightCycler 480 SYBR Green I Master (Roche). Data were evaluated using the E‐method (Roche) based on ΔΔC t method and comparison with samples of known genotype.
Unrestrained whole‐body plethysmography
Breathing and vocalization was measured within 60 min after removal from the litter. Mice could freely move and remained in the chamber (volume 280 mL; Fig. 1 B) during the measurement (3 min). Whole‐body plethysmography utilizes the pressure changes resulting from the warming of the inspired air and cooling during expiration (Drorbaugh & Fenn, 1955). Here, we used a chamber in the so called flow‐through configuration, which utilizes the principle of a pneumotach (Zhang et al. 2014; Hülsmann et al. 2016). In detail, the pressure difference between the recording chamber (280 mL) and a reference chamber was captured using a DP103‐12 pressure transducer (Validyne Engineering, Northridgw, CA, USA) and passed through a sine wave carrier demodulator (CD‐15; Validyne Engineering) for digitization (sampling rate of 1 kHz) with an analogue‐digital interface (PowerLab/4s) and LabChart software (ADInstruments, Sydney, Australia). The pressure sensor can detect very small pressure changes (±0.008 psid). The time constant of the pressure decay from the system was 10 ms. A negative bias flow of 150 mL min−1 was introduced using a CO2/O2 sensor (AdInstruments) to calibrate the flow signal at room temperature (two point calibration; LabChart). Because chamber temperature and humidity was not measured, we did not perform further corrections for these parameters. The raw flow signal was band pass filtered off‐line (0.5–20 Hz), to remove movement artefacts and noise, and then integrated for the estimation of tidal volume. We used the standard integral settings of the ‘Integral Channel Calculation module’ of LabChart (use of all data points, reset each cycle, such that the integral is reset each time the source signal passes through zero to a positive value).
The peak detection module of LabChart was used to identify respiratory parameters, including time of peak, tidal volume (integrated flow), and peak expiratory and inspiratory flow (Table 1), which were analysed offline. The respiratory rate was calculated as the reciprocal of the averaged peak to peak interval. Intervals that were longer than 750 ms were considered as pauses (calculated as pauses min−1). Irregularity scores (IrrScore) were calculated to assess the cycle‐to‐cycle variability of the interval (int) as IrrScoreInt = 100·|(Int(n) − Int(n−1))/Int(n−1)| and of the tidal volume (V T) as IrrScoreVT = 100·|(V T(n) − V T(n−1))/V T(n−1)| (Barthe & Clarac, 1997; Wegener et al. 2014; Mesuret et al. 2018). To estimate the overall variability of the breathing, the coefficients of variation (CV) were calculated for V T and respiratory cycle length (interval).
Table 1.
Summary of breathing parameters
| Significant interaction/violation of GLM test assumptions | |||||||
|---|---|---|---|---|---|---|---|
| P0–3 | P4–P7 | P8–12 | |||||
| WT | KO | WT | KO | WT | KO | ||
| Number of animals | (n = 9) | (n = 7) | (n = 6) | (n = 12) | (n = 12) | (n = 17) | |
| Neonate vocalization‐like cycles (%) | 16.5 (11.1–20.1) | 6.4 (5.5–13)* | 3.2 (2.5–7.8) | 26.1 (10–31)* | 3.2 (1.4–3.9)# | 24.3 (13.7–28.3)*# | Yes |
| Respiratory rate (fR) (min −1) | 163 (143–167) | 148 (141–157) | 286 (214–310) | 177 (168–192)* | 319 (279–336)# | 171 (149–205)*# | Yes |
| Tidal volume (V T) (μL) | 0.25 (0.23–0.3) | 0.11 (0.12–0.15)* | 0.63 (0.43–8.88) | 0.47 (0.35–1.2) | 1.1 (0.85–1.36)# | 0.69 (0.46–0.83)*# | Yes |
| Pauses >750 ms (min−1) | 5.5 (0.02–7.8) | 2.5 (2–11.7) | 0.0 (0.0–0.0) | 0.46 (0.01–4.3)* | 0.0 (0.0–0.0)# | 0.65 (0.2–2.7)* | Yes |
| Minute ventilation (V e) (μL min−1) | 39.6 (34.5–44.1) | 21.6 (18.3–26.2)* | 178 (115–237) | 86.8 (60.7–209) | 309 (262–464)# | 120 (79.1–182)*# | Yes |
| Peak inspiratory flow (μL s−1) | 3.2 (2.7–3.4) | 1.9 (1.6–2.2)* | 11.4 (7.5–17.6) | 5.3 (3.9–14) | 21.5 (17.2–28.8)# | 8.3 (5.5–11.7)*# | Yes |
| Peak expiratory flow (μL s−1) | 2.5 (2.1–3.2) | 1.2 (0.76–1.5)* | 8.3 (5.5–11.9) | 5.8 (3.4–15.2) | 13.6 (11–21)# | 9.3 (4.6–11.2)*# | Yes |
| CV tidal volume | 1.8 (1.4–2.5) | 1.6 (1–1.8) | 3.7 (3–4.6) | 1.3 (1.1–1.5)* | 3.5 (3–4.2)# | 1.5 (1.2–2)* | Yes |
| CV Interval | 2.9 (2.4–4.8) | 2.9 (2.3–4.4) | 9.2 (7.6–10.3) | 3.1 (1.9–5.6)* | 6.7 (6.1–7.3)# | 3.9 (2–4.7)* | Yes |
| IrrScoreTV | 0.52 (0.37–2) | 0.71 (0.6–1.3) | 0.15 (0.12–0.19) | 0.56 (0.33–1.3)* | 0.2 (0.17–0.22)# | 0.34 (0.22–0.47)*# | Yes |
| IrrScoreInt | 0.31 (0.19–0.43) | 0.3 (0.21–0.45) | 0.07 (0.06–0.09) | 0.21 (0.15–0.44)* | 0.1 (0.09–0.11)# | 0.18 (0.1–0.32)* | Yes |
| Body weight (BW) (g) | 1.9 (1.6–2.2) (n = 6) | 1.6 (1.2–2.3) (n = 5) | 4.7 (4.3–6.2) (n = 4) | 2.3 (2.1–2.7)* (n = 5) | 6.7 (5.9–7.2)# (n = 9) | 3 (2.7–3.7)*# (n = 15) | Yes |
| fR/BW (min−1 g−1) | 89.1 (71.8–101) | 97.4 (68.3–117) | 53 (40–69.9) | 72.1 (62.9–84.3) | 49.7 (43–52.9)# | 57.7 (53–63.1)*# | Yes |
| V T/BW (μL g−1) | 0.14 (0.13–0.15) | 0.08 (0.06–0.1)* | 0.1 (0.09–0.13) | 0.16 (0.11–0.53) | 0.15 (0.14–0.18)# | 0.22 (0.2–0.27)*# | Yes |
| V e/BW (μL min−1 g−1) | 22.7 (20.2–27) | 11.9 (10–14.4)* | 26.8 (19.7–38.2) | 34 (18–91) | 45.6 (41–61.2)# | 43.5 (35.1–51.8)# | Yes |
Data are shown as median and IQR. Statistical tests comprised a two‐way ANOVA (see Methods). Significant differences (P < 0.05) between genotype per age categories are marked with an asterisk (*) (Mann–Whitney U test). Significant differences (P < 0.05) between age categories are marked with a hash symbol (#) (Kruskal–Wallis one‐way ANOVA). The number of animals refers to the number of animals tested from each strain and age group. Apnoeas (>750 ms) are calculated per minute.
Offline calculations were performed using Excel (Microsoft Corp., Redmond, WA, USA). To quantify the relative number of breathing cycles with augmented expiratory flow that are characteristic for the neonatal vocalization, an algorithm in Excel was developed, which defines a respiratory cycle as neonatal vocalization‐like (NVL) if (i) the peak amplitude was increased (>1.2 times average peak amplitude) and (ii) the expiratory flow measured at least 80% of the peak inspiratory flow of the same respiratory cycle.
Recording of ultrasonic vocalization
For simultaneous measurement of vocalization and breathing, an ultrasound (US) microphone (UltraSoundGate 116H; Avisoft Bioacoustics, Glienicke, Germany) was incorporated into the lid of the plethysmography chamber (Fig. 1 B). US signals were recorded and digitized using chart software (40000 Hz sampling rate) to determine their timing with respect to the respiratory cycle and Avisoft recorder software (Avisoft Bioacoustics) for detailed spectral analysis. The distance between the animal and the US microphone was ∼20 mm, whereas the distance to the pressure sensor was ∼200 mm causing a short delay of pressure signal (0.5 ms). With respect to a respiratory cycle length of ∼200 ms (at 300 breaths min−1) and filtering, we refrained from correction of timing during our data analysis.
Brainstem slice preparations
WT and GlyT2‐KO mice (P1–P9) were deeply anaesthetized with isoflurane (1–2 mL in a 4 L chamber) until loss of their paw withdrawal reflex and decapitated rapidly to remove the brain. The brainstem was isolated, mounted on an agar block and transferred to a vibratom (VT1200S; Leica Microsystems, Wetzlar, Germany). In carbogenated (95% O2, 5% COs) artificial cerebrospinal fluid (containing in mm: 118 NaCl, 3 KCl, 1.5 CaCl2, 1 MgCl2, 1 NaH2PO4, 25 NaHCO3 and 30 d‐glucose; 330 mosmol L−1; pH 7.4), transversal slices were cut until the level of the principle nucleus of the inferior olive was reached. Then, a thick slice (550–600 μm) containing the preBötC was cut. This slice was transferred to the recording chamber to be superfused with artificial cerebrospinal fluid. The temperature was raised to 28°C and the external potassium‐concentration increased to 8 mm. The local field potential was recorded with borosilicate glass electrodes from the preBötC (Zhao et al. 2006). Recordings were amplified 5000–10,000 times, bandpass filtered (0.25–1.5 kHz), rectified and integrated (Paynter filter with a time constant of 40–70 ms). The digitized signal (at 10 kHz; Digidata 1440; Axon Instruments, Union City, CA, USA) was visualized and stored using pCLAMP 10 (Molecular Devices, Sunnyvale, CA, USA).
Two‐photon excitation microscopy and calcium imaging
We used a two‐photon microscope (TriMScope; LaVision BioTec, Bielefeld, Germany) in conjunction with non‐descanned detection using GaAsP photomultipliers (Hamamatsu Photonics, Shizuoka, Japan). Settings were controlled using ImSpector Pro software (LaVision BioTec). Excitation was achieved with a Ti:Sapphire Laser (MaiTai BB; SpectraPhysics, Santa Clara, CA, USA) at 800 nm for OGB‐1‐AM and 900 nm for EGFP. As described previously (Winter et al. 2009; Schnell et al. 2011), fluorescence signals of EGFP were detected through a 475/50 nm band pass filter, whereas OGB‐1‐AM was excited with detected through a 531/40 nm bandpass filter (AHF Analysentechnik AG, Tübingen, Germany).
For labelling cells with calcium indicator dye (Oregon green BAPTA‐1 AM; OGB1‐AM), multicell bolus loading was used (Stosiek et al. 2003). Briefly, AM‐ester of OGB1 (50 μg; Molecular Probes, Carlsbad, CA, USA) was dissolved in 40 μL of DMSO containing 20% Pluronic F‐127 (Molecular Probes) as OGB‐stock solution and stored at −20°C until usage. A pipette solution for injection was prepared containing in (mm): 150 NaCl, 2.5 KCl and 10 Hepes (pH 7.4). Then, 4 μL of the OGB‐stock solution was added to 16 μL of injection solution, resulting in a final dye concentration of 200 μm. Approximately 2 μL of the final injection‐solution was introduced into a patch‐pipette (resistance 3–5MΩ) and pressure‐injected (0.7 bar for 60 s) into the slice. Calcium imaging of neuronal activity was performed on the same side of the slice where the local preBötC field potentials were recorded. To estimate the number of respiratory neurons, rhythmic calcium signalling was recorded in different depths of the slice (between 20 and 120 μm, at a step size of 10 μm). Time lapse images (250 × 250 μm) were acquired at a rate of 10 Hz. For each imaging plane, the number of EGFP‐positive glycinergic neurons and the fraction of rhythmic EGFP‐positive glycinergic neurons were determined. For each slice, the averaged number per plane was calculated. Data were then stored for offline analysis. Calculation of cross‐correlation maps and cycle triggered averaging was performed using customized macros in Matlab (MathWorks Inc., Natick, MA, USA) (Winter et al. 2010; Schnell et al. 2011).
Analysis of USV
The sampling frequency of 250 kHz resulted in a frequency range of 125 kHz. We used the whistle tracking algorithm of Avisoft‐SASLab Pro 5.2 (Avisoft Bioacoustics) with settings: monotonic, maximum change per step 8 pix = 3.9 kHz, minimum continuity = 8 ms, hold time = 15 ms. Because sound energy outside the frequency range of the produced USVs can have a negative influence on the estimations, we applied a high‐pass finite impulse response filter of 35 kHz. In addition, we checked visually the outcome of the whistle tracking procedure because, in some cases, the software selected other sounds such as toe clicking, sniffing or high frequency background sounds erroneously as USVs. These criteria were compared with previous studies of pup vocalizations (Hammerschmidt et al. 2012, 2015). Based on these settings, we calculated the number of given call elements and the latency to start calling.
For an in‐depth acoustic characterization of USVs, we calculated high‐resolution spectrograms from the stored call elements (fast Fourier transform = 1024, frequency range = 125 kHz, frequency resolution = 244 Hz, time resolution = 0.26 ms) and submitted the resulting spectrograms to the custom software LMA 2017 (K. Hammerschmidt, DPZ, Göttingen, Germany) to extract characteristic acoustic parameters (Fischer et al. 2013; Hammerschmidt et al. 2015). Because mice typically concentrate the energy into one small frequency band, comprising so‐called ‘whistles’ or ‘pure tone‐like sounds’, we focused our estimations on the peak frequency (PF), the frequency with the highest amplitude in the spectra (Fig. 1 D). Often, mice produce soft USVs and already minor head movements can lead to amplitude fluctuations. Therefore, we visually controlled the acoustic parameters and excluded incorrectly estimated calls from the analysis. For each element, we estimated the duration. We defined the start of an element if the sound energy of a time segment exceeds 10% of the mean maximum amplitude of this element. We used the same threshold (10%) to determine the end of an element. In addition, we calculated parameters describing the level and modulation of PF (Hammerschmidt et al. 2012). Because many of these parameters could show high correlation, we used a stepwise discriminant function analysis (SPSS, version 24; IBM Corp., Armonk, NY, USA) to reveal those parameters most helpful for distinguishing between KO and WT littermates. Because two of the 39 subjects did not produce any USVs, we could include 3622 USVs from 37 subjects in this comparison.
USVs in relation to respiratory flow
To estimate differences in the respiratory flow between cycles with and without USVs, we marked every cycle with USVs. In addition, for a subset with clear loud vocalization, we marked the exact start time of the vocalization in relation to the respiratory flow. To make this comparison, we used the channel with the additional recording of the US signal at 40 kHz sampling frequency (Fig. 1 C). Only those animals producing more than 10 calls during the 3 min window were used for this analysis.
Video capture and recordings of abdominal movements
During USV, forced abdominal movements can be observed (see Supporting information, Video S1). The video capture feature of LabChart 8 was used together with a USB WEB‐camera (30 Hz frame rate; SPC520NC; Philips, Eindhoven, The Netherlands). Synchronization between camera and analogue input signals was adjusted manually using LabChart 8 and tested by light pulses from a LED (470 nm; KSL 70; Rapp OptoElectronic, Hamburg, Germany). An additional USV signal from the US microphone (UltraSoundGate 116H; Avisoft Bioacoustics) was recorded with LabChart 8 at a sampling rate of 40 Hz (lower trace in the Supporting information, Video S1).
Because the video rate of our camera was relatively low, we had to consider aliasing problems when interpreting the video. To overcome this problem, we combined the video capture with direct recordings of abdominal movements, using a PZT (FT31T1.3A1472; KEPO, Ningbo, China). Therefore, pups were placed with their belly on the PZT element. An increase of the pressure on the PZT is recorded as an upstroke of the recording trace. PZT signals (upper trace in the video) were collected at a sampling rate of 40 kHz using LabChart 8 without amplification via a PowerLab 4/35 interface that connected to a Q704 computer (Fujitsu, Tokyo, Japan). The final video is a screen recording using the Windows 10 (Microsoft Corp.) onboard video capture option.
Calibration of the PZT recordings of abdominal movements and the plethysmography flow signal
To calibrate the timing of the PZT recordings of abdominal movements and the plethysmography signal, the mouse was placed on the PZT within the plethysmography chamber and flow signal (Fig. 1 E and F, upper trace) and the PZT signal (middle trace) were recorded together with the USV signal (Fig. 1 E and F, lower trace) at 40 Hz sampling rate (LabChart 8; PowerLab 4/35).
Statistical analysis
To test for differences in relation to genotype and age, we first used the general linear model (GLM univariate analysis of variance) of SPSS, version 24, with genotype (WT, GlyT2‐KO) and age (P0–3, P4–7, P8–12) as fixed factors. For age, we conducted a post hoc test (least significant difference equal variance assumed). In the case of violated test assumptions or a significant interaction between genotype and age, we conducted separate nonparametric tests (Mann–Whitney U test, Kruskal–Wallis one‐way ANOVA). For the comparison of acoustic parameters, we calculated the mean per subject and used these to conduct the GLMs. For the comparison of the results from the slice experiments, we employed Mann–Whitney U tests.
To take account of the relatively small number of animals per age group, we report the actual effect size for all significant tests: ‘Partial eta squared’ (η²) for GLM tests and ‘Pearson's r’ for Mann–Whitney U tests. Data in the manuscript are reported as the median. Additionally, the interquartile range (IQR) is provided.
Results
Development of breathing pattern in GlyT2‐deficent mice
In the first set of experiments, we analysed the breathing phenotype of GlyT2‐KO mice at different stages during postnatal development. We therefore separated the mice into three age groups comprising postnatal days P0–3, P4–7 and P8–12.
In the first age group (P0–3) (Fig. 2 A and Table 1), no differences were observed between GlyT2‐KO mice and WT littermates in respiratory rate (fR). The median of the respiratory rate was 148 min−1 in GlyT2‐KO mice (IQR = 141–157 min−1; n = 7) and 163 min−1 (143–167 min−1; n = 9) in WT littermates (Mann–Whitney, U = 38, P = 0.491) (Fig. 2 E). In both genotypes, we found respiratory pauses (>750 ms) but no difference between the genotypes (Fig. 2 G). Tidal volume (V T; Mann–Whitney: U = 62, P < 0.001, r = 0.81) and minute ventilation (V e; Mann–Whitney: U = 61, P < 0.001, r = 0.78) of GlyT2‐KO mice were, however, significantly lower than in WT mice. Although V T of WT was 0.25 μL (0.23–0.3 μL), V T of GlyT2‐KO mice was 0.11 μL (0.12–0.15 μL) (Fig. 2 F). V e of WT was 39.6 μL min−1 (34.5–44.1 μL min−1) and V e of GlyT2‐KO mice was 21.6 μL min−1 (18.3–26.2 μL min−1) (Fig. 2 H). Next, we analysed the occurrence of high amplitude respiratory cycles. These are characterized by an increase of inspiratory and particularly expiratory air flow (see Methods). Such intermittent alterations of breathing have been shown to be related to USV (Hodges et al. 2009; Hernandez‐Miranda et al. 2017). We refer to these alterations of breathing as NVL cycles. At P0–3, WT mice produced NVL cycles in 16.5% (11.1–20.1%) of all observed cycles, whereas, in GlyT2‐KO, 6.4% (5.5–13%) of all cycles were NVL cycles; the difference was highly significant (Mann–Whitney: U = 51, P = 0.002, r = 0.78) (Fig. 2 D). This observation suggests that differences in tidal volume and thus minute ventilation reported above are related to differences in vocalization.
Figure 2. Comparison of breathing of WT and glycine transporter 2 deficient mice (GlyT2‐KO) at different developmental stages.
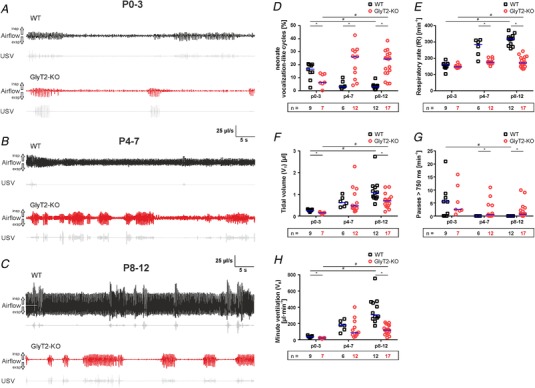
A, breathing (filtered flow) of neonatal mice (P0–3); WT (black) and GlyT2‐KO (red). Note the increase of expiratory flow (downward deflection) during USV (vocalization‐like breathing) both in WT and GlyT2‐KO mice. B, recordings from WT (black) and GlyT2‐KO (red) in the age group (P4–7). Note that the increase of expiratory flow during USV is diminished in WT mice. C, recordings from WT (black) and GlyT2‐KO (red) in the age group (P8–12). D–H, statistical analysis of major respiratory parameters in three different age groups: P0–3, P4–7 and P8–12 (additional parameters are shown in Table 1). D, neonatal vocalization‐like cycle (increase of expiratory flow, see Methods). E, respiratory rate (fR; breaths min−1, BPM). F, tidal volume (V T; μL), data from the integration of the flow signal. G, number of pauses >750 ms. H, minute ventilation (V e; μL min−1). Subjects presented as a single data point. WT: black squares, GlyT2‐KO: red circles. Median is indicated by the blue line; numbers (n) of animals tested are depicted inside the boxes below the diagrams. Significant differences (P < 0.05) between genotype per age categories are marked with an asterisk (*) (Mann–Whitney U test). Significant differences (P < 0.05) between age categories are marked with a hash symbol (#) (Kruskal–Wallis one‐way ANOVA). [Color figure can be viewed at wileyonlinelibrary.com]
In the second age group (P4–7) (Fig. 2 B and Table 1), fR of WT mice increased to 286 min−1 (214–310 min−1; n = 6) and to 177 min−1 (168–192 min−1; n = 12) in GlyT2‐KO mice. This difference between the genotypes was statistically significant (Mann–Whitney: U = 69, P = 0.001, r = 0.73). In this age group, no significant alterations were detected between genotypes regarding V T and V e. Longer pauses (>750 ms) were only found in GlyT2‐KO mice (0.46 min−1; 0.01–4.3 min−1). Compared to the first age group, V e increased in both WT and GlyT2‐KO mice at P4–7 (WT mice: 178 μL min−1; 115–237 μL min−1; n = 6 vs. GlyT2‐KO mice: 86.8 μL min1; 60.7–209 μL min−1; n = 12). Again, the most prominent distinction was the variation in NVL cycles. However, in this age group, WT mice (3.2 %; 2.5–7.8%) showed less NVL cycles compared to GlyT2‐KO mice (26.1%; 10–31%) (Fig. 2 D).
In the last age group (P8–12) (Fig. 2 C and Table 1), the disparity in breathing phenotype between WT and GlyT2‐KO mice became even more obvious. Strikingly, GlyT2‐KO mice still showed NVL breathing in 24.3% (13.7–28.3%) of the cycles (n = 17) (Fig. 2 D), whereas WT littermates (n = 12) showed NVL breathing in only 3.2% (1.4–3.9%) of the cycles (Mann–Whitney: U = 3, P < 0.001, r = 0.81). Moreover, fR was significantly lower in GlyT2‐KO mice (171 min−1; 149–205 min−1; n = 17) compared to WT mice (319 min−1; 279–336 min−1; n = 12; Mann–Whitney: U = 204, P < 0.001, r = 0.84) (Fig. 2 E). Long pauses (>750 ms) were again only found in GlyT2‐KO mice (0.65 min−1; 0.2–2.7 min−1) (Fig. 2 G). In this age group, V e of GlyT2‐KO mice remained at the level of the first week (120 μL min−1; 79.1–182 μL min−1; n = 17), whereas V e in WT mice increased to 309 μL min−1 (262–464 μL min−1; n = 12). The difference between genotypes was highly significant (Mann–Whitney: U = 199, P < 0.001, r = 0.8) (Fig. 2 H).
Taken together, it appears that breathing of GlyT2‐KO mice did not mature and remained at a neonatal level. This was reflected not only by the number of respiratory cycles with high expiratory air‐flow, but also by the persistence of high numbers of pauses in GlyT2‐KO mice. Both of these characteristics disappeared over time in WT mice.
Interestingly, when correcting V e for body weight (V e/BW), the differences between genotypes at P8–12 disappeared (Fig. 3 and Table 1), suggesting that the lighter GlyT2‐KO mice might still reach sufficient ventilation to meet their metabolic demands.
Figure 3. Respiratory data corrected for body weight (BW).
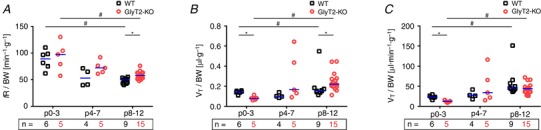
A, respiratory rate corrected for BW (fR/BW). B, tidal volume corrected for BW (t V/BW). C, minute ventilation corrected for BW (V e/BW). Subjects presented as a single data point. WT: black squares; GlyT2‐KO: red circles; median is indicated by the blue line; n, number of animals. Significant differences (P < 0.05) between genotype per age categories are marked with an asterisk (*) (Mann–Whitney U test). Significant differences (P < 0.05) between age categories are marked with a hash symbol (#) (Kruskal–Wallis one‐way ANOVA). [Color figure can be viewed at wileyonlinelibrary.com]
Generation of neuronal activity in the preBötC is not impaired in GlyT2‐KO mice
To test whether the breathing phenotype is the result of an alteration of the brainstem network in the preBötC (Smith et al. 1991) that generates respiratory rhythm, we performed recordings from rhythmic brainstem slices (age P1–9). Because analysis of respiratory activity in this type of slices using pharmacological blockade of inhibition (by strychnine) revealed contradictory results for the frequency, ranging from an increase (Zhao et al. 2006), to no effect (Shao & Feldman, 1997), to even a reduction of frequency (Baertsch et al. 2018), we aimed to test the alterations of the network activity in GlyT2‐KO mice. Although the frequency of the respiratory burst activity was slightly faster in slice preparations from GlyT2‐KO mice (0.09 Hz; 0.06–0.17 Hz; n = 6) compared to WT littermates (0.07 Hz; 0.05–0.14 Hz; n = 5), the difference did not reach statistical significance (Mann–Whitney: U = 11.00, P = 0.537) (Fig. 4). The irregularity score of the interburst interval was not significantly different either (WT 0.97; 0.59–1.3; GlyT2‐KO 1.2; 0.55–3.8; Mann–Whitney: U = 12.00, P = 0.662). Additionally, we performed calcium imaging of the preBötC in respiratory slices. We did not find differences between WT and GlyT2‐KO mice with respect to the number of active respiratory neurons (Mann–Whitney: U = 5.5, P = 0.171), nor between the relative numbers of glycinergic respiratory neurons (Mann–Whitney: U = 10, P = 0.762) (Fig. 4). These data, along with the absence of differences in in vitro recordings, lower BW (Table 1) and immature vocalization‐like breathing, strongly suggest that there is no primary defect in the central respiratory rhythm generating network of the preBötC that accounts for the observed alteration in GlyT2‐KO mice.
Figure 4. Analysis of network activity in respiratory rhythmic slice preparation.

A, schematic drawing of the slice (modified after Paxinos et al. 2001). B, summary of the field potential data: burst frequency (Hz); IrrScore = irregularity score. C, analysis of calcium imaging data from images as shown in (D–I). Data points represent the average number of cells per image plane obtained from Z‐stacks for each slice. D–F, data from a WT mouse. D, cross‐correlation (CC) map. E, EGFP‐fluorescence (green). F, raw calcium signal traces from cells in (D) and (E); lower trace (black): simultaneous field potential recording. G–I, representative GlyT2‐KO data. G, cross‐correlation (CC) map. H, EGFP‐fluorescence. I, raw calcium signal traces from cells in (G) and (H); lower trace (black): simultaneous field potential recording. Subjects presented as a single data point, WT: black squares; GlyT2‐KO: red circles; median is indicated by the blue line; n, number of animals. Scale bars (D, E, G, H) are 40 μm. [Color figure can be viewed at wileyonlinelibrary.com]
Differences in vocal activity
To identify potential alterations of USV as a result of variation in respiratory patterns, we analysed the production of USVs in more detail. The total number of USVs increased over development (GLM: F 2 = 13.1, P < 0.001, η² = 0.442) (Fig. 5 A), although there was no significant differences between WT and GlyT2‐KO mice (GLM: F 1 = 2.4, P = 0.128). WT mice from the first age group (P0–3) produced 38 calls min−1 (6.8–62 calls min−1; n = 9) and GlyT2‐KO mice produced 13.7 calls min−1 (8–21.4 calls min−1; n = 6). One mouse of each genotype did not produce any call during the time of observation. Although this higher activity in WT fits well with the higher number of NVL cycles observed before, this difference was not significant. In the second age group, no differences were observed. In the third age group (P8–12), WT mice produced 100 calls min−1 (82–118 calls min−1; n = 7) and GlyT2‐KO littermates produced 54 calls min−1 (21–116 calls min−1; n = 7) (Fig. 5).
Figure 5. Developmental difference in vocal activity.
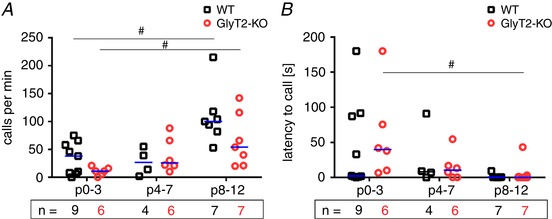
A, calls per minute. B, latency to start calling. Subjects presented as a single data point. WT: black squares; GlyT2‐KO: red circles; median is indicated by the blue line; n, number of animals. Significant differences (P < 0.05) between age categories are marked with a hash symbol (#) (Kruskal–Wallis one‐way ANOVA). [Color figure can be viewed at wileyonlinelibrary.com]
The increase of USV‐calls with age probably could be explained by the observation that the latency to call (after placement in the chamber) decreased between P0–3 and P8–12 (GLM: F 2 = 7.6, P = 0.002, η² = 0.323) (Fig. 5 B). There was no significant difference between WT and GlyT2‐KO (GLM: F 1 = 0.43, P = 0.519).
Analysis of the acoustic structure of USVs
Next, we aimed to analyse the acoustic structure of the USV in more detail. The stepwise discriminant function used 15 out of 39 acoustic parameters (Fischer et al. 2001) to assign the pup isolation calls to the genotypes (correct classification = 63.4%; cross‐validated = 63%), which is only slightly above the level of chance (50%). Thus, in general, GlyT2‐KO and WT mice differed only marginally in the structure of their USVs (Fig. 6 A and B).
Figure 6. Acoustic structure of calls in WT and GlyT2‐KO mice.
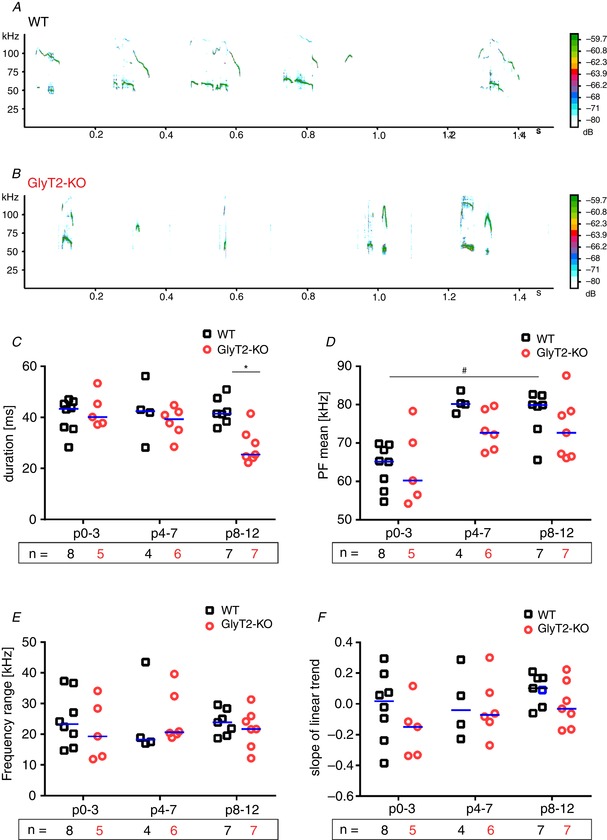
A and B, spectrogram from a WT (A) and from a GlyT2‐KO mouse (B); age group P8–12; spectrogram settings: 125 kHZ, fast Fourier transform = 512 pt, time resolution = 2 ms. C, duration of USVs. D, mean PF of USVs. E, frequency range of USVs. F, slope of USVs. Subjects presented as a single data point. WT: black squares; GlyT2‐KO: red circles; median is indicated by the blue line; n, number of animals. Significant differences (P < 0.05) between genotype per age categories are marked with an asterisk (*) (Mann–Whitney U test). Significant differences (P < 0.05) between age categories are marked with a hash symbol (#) (Kruskal–Wallis one‐way ANOVA). [Color figure can be viewed at wileyonlinelibrary.com]
GlyT2‐KO mice produced USVs with a significantly shorter call duration (GLM: F 1 = 5.1, P = 0.032, η² = 0.141) (Fig. 6 C) across all age categories, although there was no difference in call duration between age groups (GLM: F 2 = 0.7, P = 0.497). The only other significant effect was a change in peak frequency during development, with a higher peak frequency in older mice (GLM: F 2 = 13.8, P < 0.001, η² = 0.471) (Fig. 6 D). No substantial difference between genotypes was detected for this parameter (GLM: F 1 = 2.8, P = 0.107). We also found no significant differences in the other acoustic parameters in relation to genotype or age (Fig. 6 E and F): frequency range, genotype (GLM: F 1 = 0.3, P = 0.617); frequency range, age (GLM: F 2 = 0.2, P = 0.821); slope, genotype (GLM: F 1 = 2.1, P = 0.155); and slope, age (GLM: F 1 = 1.8, P = 0.189).
Differences in ventilation in relation to vocalization events
As shown above, GlyT2‐KO mice had a different respiratory pattern compared to WT littermates. The respiratory pattern is assumed to be related to USV. We therefore analysed whether the observed alterations of ventilation are directly associated with variation in USV.
We observed a lower peak inspiratory flow in GlyT2‐KO mice at P8–12, both in respiratory cycles associated with a call (Fig. 7 A), as well as in cycles that were not associated with a call (GLM (WT vs. GlyT2‐KO) cycles followed by USV: F 1 = 28.8, P < 0.001, η² = 0.545; cycles not followed by USV: F 1 = 42.2, P < 0.001, η² = 0.638) (Fig. 7 B), indicating that the reduction of minute ventilation at this stage is only partially related to the variation in the number of calls, as well as an effect of a reduction of tidal volume during respiratory cycles with USV.
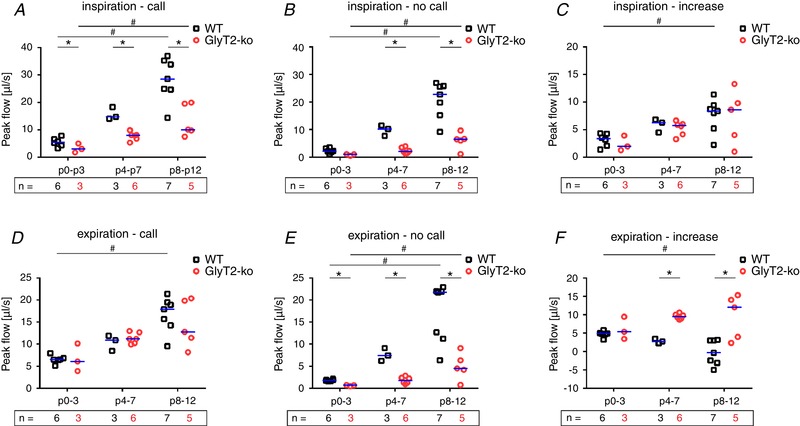
Figure 7. Analysis of respiratory airflow during normal breathing and USVs.
A, inspiratory peak flow from respiratory cycles that are associated with a USV call. B, inspiratory peak flow from respiratory cycles that are not associated with a USV call. C, increase of inspiratory flow associated with USV (difference of peak flow during call and no call). D, expiratory peak flow from respiratory cycles that are associated with a USV call. E, expiratory peak flow from respiratory cycles that are not associated with a USV call. F, increase of expiratory flow associated with USV (difference peak flows call/no call). Subjects presented as a single data point. WT: black squares; GlyT2‐KO: red circles; median is indicated by the blue line; n, number of animals. Significant differences (P < 0.05) between genotype per age categories are marked with an asterisk (*) (Mann–Whitney U test). Significant differences (P < 0.05) between age categories are marked with a hash symbol (#) (Kruskal–Wallis one‐way ANOVA). [Color figure can be viewed at wileyonlinelibrary.com]
Comparing the changes in inspiratory flow during USV and in cycles without USV, we found a higher inspiratory flow in respiratory cycles with USV in all subjects (Fig. 7 C). Older mice showed a more prominent increase in inspiratory flow than younger mice (GLM: F 2 = 7.5, P = 0.003, η² = 0.384). However, there was no significant difference between genotypes (GLM: F 1 = 0.28, P = 0.601), indicating that GlyT2‐KO mice are able to control and alter inspiratory neuronal activity in a coordinated manner.
At birth, USV‐calls are associated with active expiration (Hernandez‐Miranda et al. 2017) and thus with an increase of airway pressure and expiratory flow. Moreover, it is suggested that the peak frequency of USVs depends on the speed of the expiratory airflow (Mahrt et al. 2016). To assess whether the control of expiratory air flow is impaired in GlyT2‐KO mice, we next compared the expiratory peak flow during cycle with and without USV (Fig. 7 D–F).
In neonatal mice (P0–3), we found significant differences between WT and GlyT2‐KO mice in the peak expiratory flow during cycles without vocalization (Mann–Whitney: U = 20, P = 0.016, r = 0.77). During development, the peak expiratory flow in respiratory cycles without vocalization increased significantly in both genotypes (GLM: F 2 = 35.7, P < 0.001, η² = 0.748) and this increase was significantly larger in WT mice than in GlyT2‐KO mice (GLM: F 2 = 44.4, P < 0.001, η² = 0.649) (Fig. 7 E).
In call‐related respiratory cycles, no differences could be detected between the genotypes (GLM: F 1 = 0.16, P = 0.692). However, expiratory peak flow increased from birth (P0–3; WT 6.5 μL s−1; 5.8‐6.7 μL s−1; n = 6 vs. GlyT2‐KO 6.4 μL s−1; n = 3) to the second postnatal week (P8–12: WT 17.9 μL s−1; 14.3–19.5 μL s−1; n = 7) vs. GlyT2‐KO 12.8 μL s−1; 9.8‐20.1 μL s−1; n = 5). Neonate mice (WT and GlyT2‐KO) increased the expiratory airflow to produce ultrasonic vocalization, whereas WT mice in the second postnatal week (P8–P12) are producing USV‐calls without an increase of expiratory flow (Fig. 7 F). By contrast, GlyT2‐KO mice of all age groups showed a significant increase in expiratory flow when producing USV‐calls (GLM: F 2 = 24.1, P < 0.001, η² = 0.668) (Fig. 7 F). These data demonstrated that GlyT2‐KO mice in the second postnatal (P8–12) week still need to utilize active expiration to produce sufficient airflow for USVs.
The timing of the USV in relation to respiratory flow
Finally, we analysed the timing of the USV‐calls. In both genotypes, the USVs started shortly after the expiratory flow peak (Fig. 8). During maturation (P4–P7 and P8–12), the start of the USVs shifted from the expiratory peak (GLM: F 2 = 9.3, P = 0.001, η² = 0.435) to the zero flow point and the inspiration peak (Fig. 8 E). The changes in WT and GlyT2‐KO mice were, however, different in the way that GlyT2‐KO mice showed a less pronounced age‐related shift than WT littermates (in relation to the zero flow point (GLM, F 1 = 14.9, P = 0.001, η² = 0.383) (Fig. 8 E), as well as the expiratory flow peak (GLM, F 1 = 15.3, P = 0.001, η² = 0.391) (Fig. 8 F). At P8–12, USVs of WT mice started only 8 ms (0.6–14.7 ms) after the zero flow point (volume peak) but 41 ms (18–68 ms) before the expiratory peak, whereas, in GlyT2‐KO mice, USVs started 27 ms (23–31 ms) after the volume peak and just 6.7 ms (3.3–11.8 ms) before the expiratory peak (Fig. 8 E and F). These results not only confirm that the USV‐associated breathing pattern of GlyT2‐KO mice remains immature, but also suggest that, in WT mice, active expiration is replaced by a post‐inspiratory control of the air flow.
Figure 8. Timing of the US signal in relation to the respiratory peak flow.
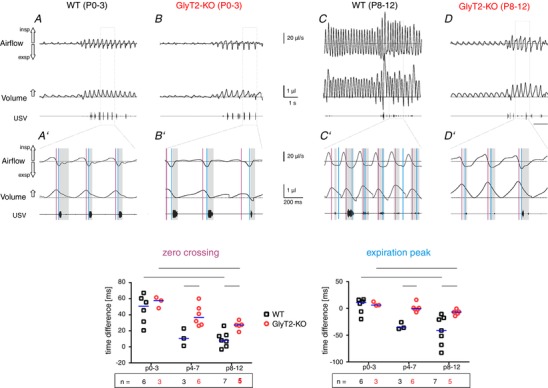
A and B, respiratory airflow (upper trace) calculated volume (middle trace) and USV recording (lower trace) from a neonatal (P0–3) WT (A) and neonatal GlyT2‐KO mouse (B). A′ and B′, magnification of recordings in WT mice (A′) and GlyT2‐KO (B′). The grey shadows highlight the timing of the USV calls. Note that, in both genotypes, the USV call starts closer to the expiratory flow peak. C and D, respiratory airflow (upper trace) calculated volume (middle trace) and USV recording (lower trace) from a WT (C) mouse (second postnatal week (P8–12) and a symptomatic GlyT2‐KO mouse (D). C′ and D′, magnification of recordings in WT mice (C′) and GlyT2‐KO (D′). The grey shadows highlight the timing of the USV calls. Note that, in WT mice, the USV calls start before the expiratory peak flow, whereas, in GlyT2‐KO, the USV calls start at the expiratory peak flow. E and F, descriptive statistics of the timing of the USV calls. E, latency to the call in respect to the zero crossing of the flow signal (peak of volume; red vertical lines in a′ to d′). F, timing of the call in respect to peak expiratory flow (blue vertical lines). Subjects presented as a single data point. WT: black squares; GlyT2‐KO: red circles; median is indicated by the blue line; n, number of animals. Significant differences (P < 0.05) between genotype per age categories are marked with an asterisk (*) (Mann–Whitney U test). Significant differences (P < 0.05) between age categories are marked with a hash symbol (#) (Kruskal–Wallis one‐way ANOVA). [Color figure can be viewed at wileyonlinelibrary.com]
Discussion
Apart from the development of the hyperekplexia‐like motor phenotype (Gomeza et al. 2003), symptomatic GlyT2‐KO mice display a significant reduction of the respiratory rate and an altered USV‐associated breathing pattern.
Normal network activity in respiratory rhythmic slice preparation from GlyT2‐KO mice
Respiratory rhythmic slices (Smith et al. 1991; Ramirez et al. 1996) have been widely used to assess alternations of network activity after manipulation of glycinergic transmission using both pharmacological intervention (Shao & Feldman, 1997; Zhao et al. 2006; Baertsch et al. 2018) or transgenic mice (Gomeza et al. 2003; Zhao et al. 2006). Pharmacological blockade of glycine receptors has produced contradictory results. Although Baertsch et al. (2018) reported a reduction of the frequency of network activity by strychnine, Shao and Feldman (1997) found no change in frequency. By contrast, we have reported a significant increase of the frequency of the preBötC field potential (∫preBötC) after application of 1 μm strychnine, as well as a significantly higher frequency in mutant oscillator mice (Glra1spd‐ot; Zhao et al. 2006). These mice lack the adult isoform of the glycine receptor (Glra1) as a result of a frameshift mutation (Buckwalter et al. 1994; Kling et al. 1997; Graham et al. 2003). It remains speculative why the frequency of the ∫preBötC is increased in Glra1spd‐ot mice but not in GlyT2‐KO mice. One option is that Glra1spd‐ot mice survive longer, and thus experiments in Glra1spd‐ot mice reflect a condition that cannot be tested in GlyT2‐KO mice. Because the reduction of glycinergic transmission starts to be reduced at birth and then stays rather constant (Latal et al. 2010), whereas, in Glra1spd‐ot mice, the deficit peaks in the third postnatal week (Graham et al. 2003), developmental aspects might be involved. However, a compensatory effect by an increase of GABAergic transmission has been excluded for both lines (Graham et al. 2003; Latal et al. 2010). Complete blockade of inhibition (by bicuculline and strychnine) was found to increase the number of respiratory neurons that can be detected by calcium imaging in the slice preparation (Schnell et al. 2011). Thus, the results of the present study concerning the GlyT2‐KO mice are in line with the concept that a sufficient amount of inhibition is left to temper the network activity and to prevent overexcitation.
Early alteration of breathing in GlyT2‐KO mice
Although it is often assumed that glycinergic transmission is essential for a normal three‐phase breathing (Richter & Smith, 2014; Shevtsova et al. 2014), there is experimental evidence that glycinergic inhibition is mainly relevant in feedback regulation of respiratory reflexes but dispensable for the generation of the respiratory rhythm (Janczewski et al. 2013; Baertsch et al. 2018). The presented data from GlyT2‐KO mice appear to be in line with this concept. Whole cell recordings in acute slices and cell culture confirm that glycinergic transmission is severely impaired in GlyT2‐KO mice (Gomeza et al. 2003; Latal et al. 2010). Nevertheless, respiratory activity and termination of inspiration are still functioning in vivo. One reason might be that a GABAergic mechanism (Dutschmann & Herbert, 2006; Arata, 2009; Barnett et al. 2018) or intrinsic conductances (Zhao et al. 2006; Krey et al. 2010) can compensate for glycine deficiency to maintain an inspiratory off‐switch and thus rhythmic network activity. Interestingly, we observed a reduction of V T and V e (Fig. 2) in GlyT2‐KO mice already in the first postnatal stage (P0–3). Although this reduction might be an epiphenomenon of a lower number of USVs, other possibilities have to be considered, including a reduction of spillover of glycine to NMDA receptors at motoneurons (Berger et al. 1998; Eulenburg et al. 2005) or other forms of (homeostatic) plasticity that keep the excitation–inhibition balance constant (Turrigiano & Nelson, 2004; Koch et al. 2011).
USV‐associated active expiration disappears in WT but not in GlyT2‐KO mice
USV is vital for normal development of mice because it is required, for example, for the nesting behaviour of mothers (Noirot, 1972; Noirot, 1974; Portfors, 2007). Separation from the mother induces ultrasonic vocalization (Portfors, 2007) but neither an intact cerebral cortex (Hammerschmidt et al. 2015), nor a functional auditory system (Hammerschmidt et al. 2012) is required for the induction of this behaviour, and the neuronal mechanisms that initiate USV are not entirely understood. Because vocalization in adult mice occurs in the post‐inspiratory phase of the breathing cycle (Dutschmann et al. 2014; Richter & Smith, 2014) and many post‐inspiratory neurons are glycinergic (Ezure et al. 2003), it would be expected that alterations of glycinergic inhibition are critical for the control of laryngeal muscles and thus USV (Dutschmann & Paton, 2002; Dutschmann et al. 2014). However, some investigators report that generation of post‐inspiratory activity depends on GABAergic and not glycinergic inhibition in mice (Anderson et al. 2016).
By contrast, USV in neonatal mice requires recruitment of abdominal muscles (Hernandez‐Miranda et al. 2017) and thus it occurs, per definition (Bianchi et al. 1995) during active expiration. Active expiration is absent in quiet breathing but is generated, apart from vocalization, during coughing and sneezing, as well as during states of high metabolic demand (Price & Batsel, 1970; Richter, 1982; Anderson & Ramirez, 2017). Active expiration requires the activity of the parafacial respiratory group (Onimaru & Homma, 2003; Janczewski & Feldman, 2006) and can be induced by optogenetic stimulation or pharmacological disinhibition of the parafacial respiratory group in vivo (Pagliardini et al. 2011).
Neonatal GlyT2‐KO mice showed USV‐associated active expiration, similar to their WT littermates (Fig. 2 A) and almost indistinguishable USV‐calls (Fig. 6). In the second postnatal week, however, the general characteristics of breathing and USV‐associated breathing pattern of GlyT2‐KO mice continued to resemble the pattern of neonates, whereas it matured in WT littermates. Most importantly, GlyT2‐KO still showed active expiration associated with USV (Figs. 1 E and F and 2 B and C; see also Supporting information, Video S1). This observation favours a dominant role of GABAergic rather than glycinergic transmission in the control of active expiration in neonates.
By contrast, WT mice developed a fundamentally altered USV‐associated respiratory pattern (Figs. 2 C and 8 C): in the second postnatal week, USV was generated almost without any increase in the expiratory flow and thus without active expiration. Furthermore, the timing changed as USV‐calls of WT mice started at the beginning of the post‐inspiration (Gautier et al. 1973; Richter, 1982). This change in timing of the USV‐calls is in line with the concept that vocalization occurs in the post‐inspiratory phase in adults (Dutschmann et al. 2014; Richter & Smith, 2014).
However, it is difficult to imagine that the absence of this transition in GlyT2‐KO mice is a direct consequence of the impairment of glycinergic synaptic transmission. As explained below, we conclude that the different respiratory pattern during USV is rather a consequence of a general delay or impairment of postnatal development.
Functional implication of airflow on USV generation
The expiratory/post‐inspiratory airflow needs to reach a critical level to produce ultrasonic vocalization (Mahrt et al. 2016). Considering the smaller airway diameter of neonate mice it is not surprising, according to Hagen–Poiseuille law, that smaller and younger mice and also older GlyT2‐KO must use active expiration to produce a pulmonary pressure matching the larger airway resistance. Because older WT mice reach higher expiratory flow already during quiet breathing, USV can be generated without active expiration (Figs. 2 and 8).
One of the current models of USV production concludes that USV calls are produced by intra‐laryngeal planar impinging jets (Mahrt et al. 2016). According to this model, the frequency of the US calls depends on the speed of airflow, which is in line with our observation that the peak frequency of the USV calls is increasing with age and also is higher in WT compared to GlyT2‐KO mice (Fig. 6). Because the frequency range and slope of the USV‐calls are not different between genotypes, we have no reason to assume that different physical mechanisms are utilized.
Technical considerations
As is obvious from Fig. 1 C, raw traces show some fluctuations of the baseline, which may result from slight changes of the bias flow or, more probably, movements of the animal. Changes of atmospheric pressure in the laboratory were blunted by the fact that we recorded pressure differences between the chamber and a reference chamber. These baseline fluctuations are largely removed by band pass filtering (0.5–20 Hz). However, some uncertainty remains regarding the position of the zero‐flow point for each cycle, which, in principle, produces a problem for the calculation of volume data (V T). Also, it has to be taken into account that the volume signal was not corrected for changes of humidity or temperature. We assume that these errors are random and thus at least partially cancel each other out. Nevertheless, some caution is advised when interpreting the absolute values of volume data (V T and V e).
Uncertain causality between immature breathing phenotype and early death
Although breathing of symptomatic GlyT2‐KO mice is significantly different from WT littermates, there is little evidence that this alteration is directly responsible for the impaired general condition and early postnatal death. Instead, it appears that ventilation matched metabolic demands because normalized minute ventilation (μL min−1 g−1) is not reduced in symptomatic GlyT2‐KO mice compared to WT littermates. In GlyT2‐KO mice, the increase in ventilation during vocalization might even provide a rescue mechanism for hypoxic or hypercapnic challenges that occurred during pauses, as suggested for other mouse models (Hodges et al. 2009). However, apnoeas or periods of low ventilation sometimes followed directly after periods of USV, indicating that the vigorous USV episodes might be responsible for a reduction of the respiratory drive as a result of functional hyperventilation during prolonged periods of USV (Fig. 2 B). In the long run, however, symptomatic GlyT2‐KO mice might consume more energy during vocalization compared to their littermates because of the recruitment of expiratory muscle. Evaporative heat loss and dehydration during the vocalization might also have an adverse effect. Together with motoric difficulties with respect to feeding (Gomeza et al. 2003), these alterations might lead to exhaustion of the metabolic sources and eventually decompensation. In support of this argument, our observation suggests a longer survival when litters were smaller or littermates were removed early after birth.
Conclusions
Taken together, GlyT2‐KO mice have significant alterations in breathing. However, these alterations do not appear to be immediately life threatening. Nevertheless, an indirect relationship between the early postnatal death and the deficit in glycinergic inhibition cannot be fully excluded. GlyT2‐KO mice show a delayed development and consequently maintain a neonatal breathing phenotype, which is accompanied by a neonatal vocalization pattern. Additionally, we show that, during the first postnatal week, the USV‐related breathing pattern of WT mice undergoes a fundamental shift from active expiration to a post‐inspiratory control of passive expiration. Finally, these findings not only contribute to a better understanding of the unclear role of glycinergic neurons in the control of breathing, but also shine new light on USV generation in general and on its postnatal development.
Additional information
Competing interests
The authors declare that they have no competing interests.
Author contributions
JF, KH and SH conceived the study. JH, KH and SH developed and improved the methodology. MGF, ATL, GM, MN, YO and SH conducted the measurements. KH and SH performed the formal analysis and data visualization. All authors have critically revised and approved the final copy of the manuscript submitted for publication. They agree to be accountable for all aspects of the work in ensuring that questions related to the accuracy or integrity of any part of the work are appropriately investigated and resolved. All persons designated as authors qualify for authorship, and all those who qualify for authorship are listed.
Funding
This work was funded by the Cluster of Excellence and DFG Research Centre Nanoscale Microscopy and Molecular Physiology of the Brain (CNMPB). SH received additional support from the Deutsche Forschungsgemeinschaft DFG (Hu797/7‐1, 8‐1), as well as from the Volkswagen Foundation (VolkswagenStiftung).
Supporting information
Video S1: During USV forced abdominal movements can be observed. Recordings of a 6 day old (P6) GlyT2‐KO mouse. On the right, the changes of a piezoelectric transducer (PZT; upper trace) and the USV‐signal (lower trace) are shown. Positive deflections in the PZT‐signal correspond to an increase of the pressure on the PZT, while negative changes occur when the pressure is reduced. Note that the USV‐calls of the mouse start at negative PZT‐peak.
Acknowledgements
The authors are grateful to Anja‐Annett Grützner (Göttingen) und Grit Marx (Leipzig) for technical assistance.
Biography
Swen Hülsmann is Associate Professor for Physiology at the University Medical Center Göttingen. He is leading the research group Central Respiratory Control at the Clinic for Anesthesiology. His research interests are in the areas of the neural control of breathing, synaptic inhibition and astrocytes.

Edited by: Ole Paulsen & Gregory Funk
References
- Anderson TM, 3rd Garcia AJ, , Baertsch NA, Pollak J, Bloom JC, Wei AD, Rai KG & Ramirez JM (2016). A novel excitatory network for the control of breathing. Nature 536, 76–80. [DOI] [PMC free article] [PubMed] [Google Scholar]
- Anderson TM & Ramirez JM (2017). Respiratory rhythm generation: triple oscillator hypothesis. F1000Res 6, 139. [DOI] [PMC free article] [PubMed] [Google Scholar]
- Arata A (2009). Respiratory activity of the neonatal dorsolateral pons in vitro. Respir Physiol Neurobiol 168, 144–152. [DOI] [PubMed] [Google Scholar]
- Baertsch NA, Baertsch HC & Ramirez JM (2018). The interdependence of excitation and inhibition for the control of dynamic breathing rhythms. Nat Commun 9, 843. [DOI] [PMC free article] [PubMed] [Google Scholar]
- Barnett WH, Jenkin SEM, Milsom WK, Paton JFR, Abdala APL, Molkov YI & Zoccal DB (2018). The Kölliker‐Fuse orchestrates the timing of expiratory abdominal nerve bursting. J Neurophysiol 119, 401–412. [DOI] [PMC free article] [PubMed] [Google Scholar]
- Barthe JY & Clarac F (1997). Modulation of the spinal network for locomotion by substance P in the neonatal rat. Exp Brain Res 115, 485–492. [DOI] [PubMed] [Google Scholar]
- Becker CM, Schmieden V, Tarroni P, Strasser U & Betz H (1992). Isoform‐selective deficit of glycine receptors in the mouse mutant spastic. Neuron 8, 283–289. [DOI] [PubMed] [Google Scholar]
- Berger AJ, Dieudonne S & Ascher P (1998). Glycine uptake governs glycine site occupancy at NMDA receptors of excitatory synapses. J Neurophysiol 80, 3336–3340. [DOI] [PubMed] [Google Scholar]
- Bianchi AL, Denavit‐Saubie M & Champagnat J (1995). Central control of breathing in mammals: neuronal circuitry, membrane properties, and neurotransmitters. Physiol Rev 75, 1–45. [DOI] [PubMed] [Google Scholar]
- Bogdanik LP, Chapman HD, Miers KE, Serreze DV & Burgess RW (2012). A MusD retrotransposon insertion in the mouse Slc6a5 gene causes alterations in neuromuscular junction maturation and behavioral phenotypes. PLoS ONE 7, e30217. [DOI] [PMC free article] [PubMed] [Google Scholar]
- Buckwalter MS, Cook SA, Davisson MT, White WF & Camper SA (1994). A frameshift mutation in the mouse α1 glycine receptor gene (Gira1) results in progressive neurological symptoms and juvenile death. Hum Mol Genet 3, 2025–2030. [DOI] [PubMed] [Google Scholar]
- Busselberg D, Bischoff AM, Becker K, Becker CM & Richter DW (2001). The respiratory rhythm in mutant oscillator mice. Neurosci Lett 316, 99–102. [DOI] [PubMed] [Google Scholar]
- Cui Y, Kam K, Sherman D, Janczewski WA, Zheng Y & Feldman JL (2016). Defining preBotzinger complex rhythm‐ and pattern‐generating neural microcircuits in vivo. Neuron 91, 602–614. [DOI] [PMC free article] [PubMed] [Google Scholar]
- Drorbaugh JE & Fenn WO (1955). A barometric method for measuring ventilation in newborn infants. Pediatrics 16, 81–87. [PubMed] [Google Scholar]
- Dutschmann M & Herbert H (2006). The Kölliker‐Fuse nucleus gates the postinspiratory phase of the respiratory cycle to control inspiratory off‐switch and upper airway resistance in rat. Eur J Neurosci 24, 1071–1084. [DOI] [PubMed] [Google Scholar]
- Dutschmann M, Jones SE, Subramanian HH, Stanic D & Bautista TG (2014). The physiological significance of postinspiration in respiratory control. Prog Brain Res 212, 113–130. [DOI] [PubMed] [Google Scholar]
- Dutschmann M & Paton JF (2002). Inhibitory synaptic mechanisms regulating upper airway patency. Respir Physiol Neurobiol 131, 57–63. [DOI] [PubMed] [Google Scholar]
- Eulenburg V, Armsen W, Betz H & Gomeza J (2005). Glycine transporters: essential regulators of neurotransmission. Trends Biochem Sci 30, 325–333. [DOI] [PubMed] [Google Scholar]
- Ezure K, Tanaka I & Kondo M (2003). Glycine is used as a transmitter by decrementing expiratory neurons of the ventrolateral medulla in the rat. J Neurosci 23, 8941–8948. [DOI] [PMC free article] [PubMed] [Google Scholar]
- Feldman JL & Kam K (2015). Facing the challenge of mammalian neural microcircuits: taking a few breaths may help. J Physiol 593, 3–23. [DOI] [PMC free article] [PubMed] [Google Scholar]
- Feng G, Tintrup H, Kirsch J, Nichol MC, Kuhse J, Betz H & Sanes JR (1998). Dual requirement for gephyrin in glycine receptor clustering and molybdoenzyme activity. Science 282, 1321–1324. [DOI] [PubMed] [Google Scholar]
- Fischer J, Hammerschmidt K, Cheney DL & Seyfarth RM (2001). Acoustic features of female chacma baboon barks. Ethology 107, 33–54. [Google Scholar]
- Fischer J, Noser R & Hammerschmidt K (2013). Bioacoustic field research: a primer to acoustic analyses and playback experiments with primates. Am J Primatol 75, 643–663. [DOI] [PMC free article] [PubMed] [Google Scholar]
- Fujii M, Arata A, Kanbara‐Kume N, Saito K, Yanagawa Y & Obata K (2007). Respiratory activity in brainstem of fetal mice lacking glutamate decarboxylase 65/67 and vesicular GABA transporter. Neuroscience 146, 1044–1052. [DOI] [PubMed] [Google Scholar]
- Gautier H, Remmers JE & Bartlett D (1973). Control of the duration of expiration. Respir Physiol 18, 205–221. [DOI] [PubMed] [Google Scholar]
- Gomeza J, Ohno K, Hulsmann S, Armsen W, Eulenburg V, Richter DW, Laube B & Betz H (2003). Deletion of the mouse glycine transporter 2 results in a hyperekplexia phenotype and postnatal lethality. Neuron 40, 797–806. [DOI] [PubMed] [Google Scholar]
- Graham BA, Schofield PR, Sah P & Callister RJ (2003). Altered inhibitory synaptic transmission in superficial dorsal horn neurones in spastic and oscillator mice. J Physiol 551, 905–916. [DOI] [PMC free article] [PubMed] [Google Scholar]
- Gray PA, Janczewski WA, Mellen N, McCrimmon DR & Feldman JL (2001). Normal breathing requires preBotzinger complex neurokinin‐1 receptor‐expressing neurons. Nat Neurosci 4, 927–930. [DOI] [PMC free article] [PubMed] [Google Scholar]
- Grundy D (2015). Principles and standards for reporting animal experiments in The Journal of Physiology and Experimental Physiology. J Physiol 593, 2547–2549. [DOI] [PMC free article] [PubMed] [Google Scholar]
- Hammerschmidt K, Reisinger E, Westekemper K, Ehrenreich L, Strenzke N & Fischer J (2012). Mice do not require auditory input for the normal development of their ultrasonic vocalizations. BMC Neurosci 13. [DOI] [PMC free article] [PubMed] [Google Scholar]
- Hammerschmidt K, Whelan G, Eichele G & Fischer J (2015). Mice lacking the cerebral cortex develop normal song: insights into the foundations of vocal learning. Sci Rep 5. [DOI] [PMC free article] [PubMed] [Google Scholar]
- Hernandez‐Miranda LR, Ruffault P‐L, Bouvier JC, Murray AJ, Morin‐Surun M‐P, Zampieri N, Cholewa‐Waclaw JB, Ey E, Brunet J‐F, Champagnat J, Fortin G & Birchmeier C (2017). Genetic identification of a hindbrain nucleus essential for innate vocalization. Proc Natl Acad Sci U S A 114, 8095–8100. [DOI] [PMC free article] [PubMed] [Google Scholar]
- Hodges MR, Wehner M, Aungst J, Smith JC & Richerson GB (2009). Transgenic mice lacking serotonin neurons have severe apnea and high mortality during development. J Neurosci 29, 10341–10349. [DOI] [PMC free article] [PubMed] [Google Scholar]
- Hülsmann S, Mesuret G, Dannenberg J, Arnoldt M & Niebert M (2016). GlyT2‐dependent preservation of MECP2‐expression in inhibitory neurons improves early respiratory symptoms but does not rescue survival in a mouse model of Rett syndrome. Front Physiol 7, 385. [DOI] [PMC free article] [PubMed] [Google Scholar]
- Janczewski WA & Feldman JL (2006). Distinct rhythm generators for inspiration and expiration in the juvenile rat. J Physiol 570, 407–420. [DOI] [PMC free article] [PubMed] [Google Scholar]
- Janczewski WA, Tashima A, Hsu P, Cui Y & Feldman JL (2013). Role of inhibition in respiratory pattern generation. J Neurosci 33, 5454–5465. [DOI] [PMC free article] [PubMed] [Google Scholar]
- Kling C, Koch M, Saul B & Becker CM (1997). The frameshift mutation oscillator (Glra1(spd‐ot)) produces a complete loss of glycine receptor alpha1‐polypeptide in mouse central nervous system. Neuroscience 78, 411–417. [DOI] [PubMed] [Google Scholar]
- Koch H, 3rd Garcia AJ & Ramirez JM (2011). Network reconfiguration and neuronal plasticity in rhythm‐generating networks. Integr Comp Biol 51, 856–868. [DOI] [PMC free article] [PubMed] [Google Scholar]
- Krey RA, Goodreau AM, Arnold TB & Del Negro CA (2010). Outward currents contributing to inspiratory burst termination in preBötzinger complex neurons of neonatal mice studied in vitro. Front Neural Circuits 4, 124. [DOI] [PMC free article] [PubMed] [Google Scholar]
- Latal AT, Kremer T, Gomeza J, Eulenburg V & Hulsmann S (2010). Development of synaptic inhibition in glycine transporter 2 deficient mice. Mol Cell Neurosci 44, 342–352. [DOI] [PubMed] [Google Scholar]
- Mahrt E, Agarwal A, Perkel D, Portfors C & Elemans CP (2016). Mice produce ultrasonic vocalizations by intra‐laryngeal planar impinging jets. Curr Biol 26, R880–R881. [DOI] [PubMed] [Google Scholar]
- Marchenko V, Koizumi H, Mosher B, Koshiya N, Tariq MF, Bezdudnaya TG, Zhang R, Molkov YI, Rybak IA & Smith JC (2016). Perturbations of respiratory rhythm and pattern by disrupting synaptic inhibition within pre‐Bötzinger and Bötzinger complexes. eNeuro 3, ENEURO.0011‐0016.2016. [DOI] [PMC free article] [PubMed] [Google Scholar]
- Markstahler U, Kremer E, Kimmina S, Becker K & Richter DW (2002). Effects of functional knock‐out of alpha 1 glycine‐receptors on breathing movements in oscillator mice. Respir Physiol Neurobiol 130, 33–42. [DOI] [PubMed] [Google Scholar]
- Mesuret G, Dannenberg J, Arnoldt M, Grützner A‐A, Niebert M & Hülsmann S (2018). Breathing disturbances in a model of Rett syndrome: a potential involvement of the glycine receptor α3 subunit? Respir Physiol Neurobiol 248, 43–47. [DOI] [PubMed] [Google Scholar]
- Noirot E (1972). Ultrasounds and maternal behavior in small rodents. Dev Psychobiol 5, 371–387. [DOI] [PubMed] [Google Scholar]
- Noirot E (1974). Nest‐building by the virgin female mouse exposed to ultrasound from inaccessible pups. Anim Behav 22, 410–420. [Google Scholar]
- Onimaru H & Homma I (2003). A novel functional neuron group for respiratory rhythm generation in the ventral medulla. J Neurosci 23, 1478–1486. [DOI] [PMC free article] [PubMed] [Google Scholar]
- Pagliardini S, Janczewski WA, Tan W, Dickson CT, Deisseroth K & Feldman JL (2011). Active expiration induced by excitation of ventral medulla in adult anesthetized rats. J Neurosci 31, 2895–2905. [DOI] [PMC free article] [PubMed] [Google Scholar]
- Paxinos G, Franklin KBJ & Franklin KBJ (2001). The Mouse Brain in Stereotaxic Coordinates. Academic Press, San Diego, CA. [Google Scholar]
- Pierrefiche O, Schwarzacher SW, Bischoff AM & Richter DW (1998). Blockade of synaptic inhibition within the pre‐Botzinger complex in the cat suppresses respiratory rhythm generation in vivo. J Physiol 509, 245–254. [DOI] [PMC free article] [PubMed] [Google Scholar]
- Portfors CV (2007). Types and functions of ultrasonic vocalizations in laboratory rats and mice. J Am Assoc Lab Anim Sci 46, 28–34. [PubMed] [Google Scholar]
- Price WM & Batsel HL (1970). Respiratory neurons participating in sneeze and in response to resistance to expiration. Exp Neurol 29, 554–570. [DOI] [PubMed] [Google Scholar]
- Rahman J, Besser S, Schnell C, Eulenburg V, Hirrlinger J, Wojcik SM & Hulsmann S (2015). Genetic ablation of VIAAT in glycinergic neurons causes a severe respiratory phenotype and perinatal death. Brain Struct Funct 220, 2835–2849. [DOI] [PubMed] [Google Scholar]
- Ramirez JM, Quellmalz UJ & Richter DW (1996). Postnatal changes in the mammalian respiratory network as revealed by the transverse brainstem slice of mice. J Physiol 491 (Pt 3), 799–812. [DOI] [PMC free article] [PubMed] [Google Scholar]
- Richter DW (1982). Generation and maintenance of the respiratory rhythm. J Exp Biol 100, 93–107. [DOI] [PubMed] [Google Scholar]
- Richter DW & Smith JC (2014). Respiratory rhythm generation in vivo. Physiology (Bethesda) 29, 58–71. [DOI] [PMC free article] [PubMed] [Google Scholar]
- Schaefer N, Langlhofer G, Kluck CJ & Villmann C (2013). Glycine receptor mouse mutants: model systems for human hyperekplexia. Br J Pharmacol 170, 933–952. [DOI] [PMC free article] [PubMed] [Google Scholar]
- Schnell C, Fresemann J & Hulsmann S (2011). Determinants of functional coupling between astrocytes and respiratory neurons in the pre‐Botzinger complex. PLoS ONE 6, e26309. [DOI] [PMC free article] [PubMed] [Google Scholar]
- Shao XM & Feldman JL (1997). Respiratory rhythm generation and synaptic inhibition of expiratory neurons in pre‐Botzinger complex: differential roles of glycinergic and GABAergic neural transmission. J Neurophysiol 77, 1853–1860. [DOI] [PubMed] [Google Scholar]
- Shevtsova NA, Busselberg D, Molkov YI, Bischoff AM, Smith JC, Richter DW & Rybak IA (2014). Effects of glycinergic inhibition failure on respiratory rhythm and pattern generation. Prog Brain Res 209, 25–38. [DOI] [PMC free article] [PubMed] [Google Scholar]
- Simpson EM, Linder CC, Sargent EE, Davisson MT, Mobraaten LE & Sharp JJ (1997). Genetic variation among 129 substrains and its importance for targeted mutagenesis in mice. Nat Genet 16, 19–27. [DOI] [PubMed] [Google Scholar]
- Smith JC, Ellenberger HH, Ballanyi K, Richter DW & Feldman JL (1991). Pre‐Botzinger complex: a brainstem region that may generate respiratory rhythm in mammals. Science 254, 726–729. [DOI] [PMC free article] [PubMed] [Google Scholar]
- Stosiek C, Garaschuk O, Holthoff K & Konnerth A (2003). In vivo two‐photon calcium imaging of neuronal networks. Proc Natl Acad Sci U S A 100, 7319–7324. [DOI] [PMC free article] [PubMed] [Google Scholar]
- Tan W, Janczewski WA, Yang P, Shao XM, Callaway EM & Feldman JL (2008). Silencing preBotzinger complex somatostatin‐expressing neurons induces persistent apnea in awake rat. Nat Neurosci 11, 538–540. [DOI] [PMC free article] [PubMed] [Google Scholar]
- Turrigiano GG & Nelson SB (2004). Homeostatic plasticity in the developing nervous system. Nat Rev Neurosci 5, 97–107. [DOI] [PubMed] [Google Scholar]
- Vann NC, Pham FD, Hayes JA, Kottick A & Del Negro CA (2016). Transient suppression of Dbx1 preBötzinger interneurons disrupts breathing in adult mice. PLoS ONE 11, e0162418. [DOI] [PMC free article] [PubMed] [Google Scholar]
- Wegener E, Brendel C, Fischer A, Hulsmann S, Gartner J & Huppke P (2014). Characterization of the MeCP2R168X knockin mouse model for Rett syndrome. PLoS ONE 9, e115444. [DOI] [PMC free article] [PubMed] [Google Scholar]
- Winter SM, Fresemann J, Schnell C, Oku Y, Hirrlinger J & Hulsmann S (2009). Glycinergic interneurons are functionally integrated into the inspiratory network of mouse medullary slices. Pflugers Arch 458, 459–469. [DOI] [PMC free article] [PubMed] [Google Scholar]
- Winter SM, Fresemann J, Schnell C, Oku Y, Hirrlinger J & Hülsmann S (2010). Glycinergic interneurons in the respiratory network of the rhythmic slice preparation. Adv Exp Med Biol 669, 97–100. [DOI] [PubMed] [Google Scholar]
- Wojcik SM, Katsurabayashi S, Guillemin I, Friauf E, Rosenmund C, Brose N & Rhee JS (2006). A shared vesicular carrier allows synaptic corelease of GABA and glycine. Neuron 50, 575–587. [DOI] [PubMed] [Google Scholar]
- Zeilhofer HU, Studler B, Arabadzisz D, Schweizer C, Ahmadi S, Layh B, Bosl MR & Fritschy JM (2005). Glycinergic neurons expressing enhanced green fluorescent protein in bacterial artificial chromosome transgenic mice. J Comp Neurol 482, 123–141. [DOI] [PubMed] [Google Scholar]
- Zhang BY, McDonald FB, Cummings KJ, Frappell PB & Wilson RJA (2014). Novel method for conscious airway resistance and ventilation estimation in neonatal rodents using plethysmography and a mechanical lung. Respir Physiol Neurobiol 201, 75–83. [DOI] [PubMed] [Google Scholar]
- Zhao MG, Hulsmann S, Winter SM, Dutschmann M & Richter DW (2006). Calcium‐regulated potassium currents secure respiratory rhythm generation after loss of glycinergic inhibition. Eur J Neurosci 24, 145–154. [DOI] [PubMed] [Google Scholar]
Associated Data
This section collects any data citations, data availability statements, or supplementary materials included in this article.
Supplementary Materials
Video S1: During USV forced abdominal movements can be observed. Recordings of a 6 day old (P6) GlyT2‐KO mouse. On the right, the changes of a piezoelectric transducer (PZT; upper trace) and the USV‐signal (lower trace) are shown. Positive deflections in the PZT‐signal correspond to an increase of the pressure on the PZT, while negative changes occur when the pressure is reduced. Note that the USV‐calls of the mouse start at negative PZT‐peak.