Abstract
Prompt and repeated assessments of tumor sensitivity to available therapeutics could reduce patient morbidity and mortality by quickly identifying therapeutic resistance and optimizing treatment regimens. Analysis of changes in cancer cell biomass has shown promise in assessing drug sensitivity and fulfilling these requirements. However, a major limitation of previous studies in solid tumors, which comprise 90% of cancers, is the use of cancer cell lines rather than freshly isolated tumor material. As a result, existing biomass protocols are not obviously extensible to real patient tumors owing to potential artifacts that would be generated by the removal of cells from their microenvironment and the deleterious effects of excision and purification. In this present work, we show that simple excision of human triple-negative breast cancer (TNBC) tumors growing in immunodeficient mouse, patient-derived xenograft (PDX) models, followed by enzymatic disaggregation into single cell suspension, is enabling for rapid and accurate biomass accumulation-based predictions of in vivo sensitivity to the chemotherapeutic drug carboplatin. We successfully correlate in vitro biomass results with in vivo treatment results in three TNBC PDX models that have differential sensitivity to this drug. With a maximum turnaround time of 40 h from tumor excision to useable results and a fully-automated analysis pipeline, the assay described here has significant potential for translation to clinical practice.
Introduction
An enhanced understanding of cancer’s molecular underpinnings has enabled the introduction of more personalized treatments informed by rigorous histologic subtyping and mutation or biomarker analysis. However, because biomarkers are genetic or epigenetic changes identified by large scale patient studies, interpatient and intrapatient tumor heterogeneity often undermine the efficacy of biomarker-indicated first line therapy regimens.1,2 This heterogeneity reduces efficacy and may lead to the rapid development of drug resistance. For example, in ER+ and PR– breast cancers, only 40% of patients respond to biomarker-indicated anti-hormonal therapy.3 Additionally, a majority of cancers including triple-negative breast cancer (TNBC) still lack therapy response predictive biomarkers to guide drug selection. Taken together, the lack of reliable markers and the heterogeneity in drug responsiveness between cancers with the same biomarkers underscore the need for a personalized clinical assay that can predict therapy response. As a result, much interest has focused on assays that measure a functional outcome after drug treatment, such as ATP production or cell death. These assays hold promise by combining genetic, epigenetic, and other signals or activities into a single quantifiable output.
Current methods of assessing in vitro tumor drug responses include the gold standard CellTiter-Glo or luciferase-based assays, which quantify ATP levels after several days of exposure to a specific therapeutic.4,5 This method has seen increased adoption due to recent improvements in tumoroid culture methodologies, which excel at expanding ex vivo tissue samples.6,7 Such improvements have made feasible the idea that each patient might one day have their own tumoroid grown and tested against a battery of potential therapies. This would be analogous to antibiotic susceptibility testing for patients with urinary tract infections. However, many challenges remain, including low success rates and high costs. In some cancer types, only 20% of organoid cultures are successful.8 Furthermore, assessing drug responses with endpoint assays such as CellTiter-Glo requires long turnaround times which further increases costs and necessitates bulk averaging of signals from the cancer cells. Ideally, a method for assessing drug sensitivity in solid tumors would not require long term culture, have fast turnaround times, and maintain single-cell sensitivity important for the identification of minority resistant cells in otherwise drug-sensitive tumors.
Analysis of changes in cancer cell biomass has shown promise in rapidly assessing drug sensitivity and fulfilling these requirements.9−12 Of particular interest are quantitative phase imaging techniques, such as interference microscopy, digital holography, and related phase-retrieval methods, which are very flexible, easily adapted to standard cell culture Labware, and require no external labeling.
In cell line models of breast cancer13 and melanoma,14 loss in cellular biomass has been shown to correlate with drug sensitivity and was often detectable before classical apoptotic signals. A major limitation of this previous work is that it is not obviously extensible to real patient tumors owing to potential artifacts that would be generated by the removal of cells from their microenvironment and deleterious effects of excision and purification.
In this present work, we show that simple excision of human TNBC patient-derived xenograft (PDX) tumors followed by enzymatic disaggregation into single cell suspension is sufficient to allow rapid and accurate biomass accumulation-based prediction of in vivo sensitivity to the chemotherapeutic drug carboplatin. We successfully correlate in vitro biomass results with in vivo treatment results in two carboplatin-resistant and one carboplatin-sensitive, matched TNBC PDX models. Importantly, while not fully recapitulating a human tumor, owing to the absence of tumor/immune system interactions and other factors, PDX preclinical cancer models have been shown to maintain the gene expression heterogeneity and histology seen in primary tumors.15 As a result, PDX models are a much more relevant platform to evaluate the translational potential of biomass accumulation drug response assays than cell lines.
In these studies, we used a bespoke optical cell biomass measurement system, the high speed live cell interferometer (HSLCI).14 HSLCI uses an automated scanning platform and an interferometric camera to measure the biomass of 103 to 104 cells in a standard glass-bottomed 24-well culture plate over time.8 Biomass accumulation kinetic responses were determined by continuously measuring single cells or small cell clusters every 10 min. Compared to conventional methods of tumor profiling, the HSLCI has advantages of reduced cost, no labels, short turnaround time, and multiparameterized outcomes. Furthermore, drug resistance assessments take ∼40 h, compared to 3–7 d for chemosensitivity assays, making the HSLCI better matched for evaluating fragile primary patient samples. The acquisition of single-cell drug responses in a heterogeneous population, which are not easily determined from primary tissue using conventional assays, has potential as a clinically relevant indicator for whole tumor response and drug resistance predictions.
Results and Discussion
Effects of Carboplatin on PDX Models
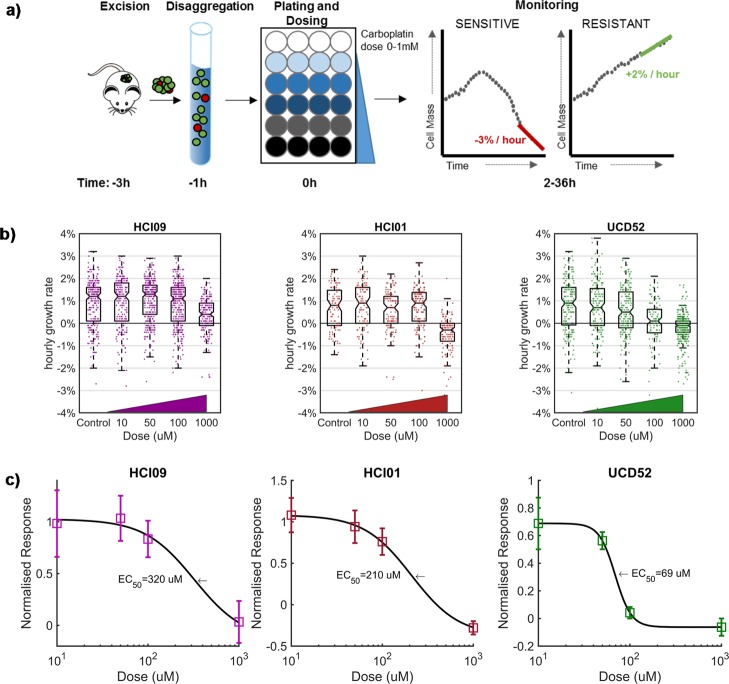
The in vitro response to carboplatin of three TNBC PDX models (HCI01, HCI09, and UCD52) was monitored following the timeline and protocol described in Figure 1a. Tumors were excised and enzymatically digested into single-cell suspensions. Following this, cells were placed in a 24-well glass bottom plate with media, dosed with carboplatin, and then monitored for up to 36 h after dosing using the HSLCI system. As carboplatin is not cell cycle-specific, we anticipated detecting responses within 36 h postdosing. Each assay included parallel measurements across a log-scale range of carboplatin doses in the same plate. The 1× dose in this range (40–70 μM) corresponds to the equivalent maximum serum concentration measured in patients receiving FDA-approved therapeutic doses of carboplatin (Figure S1a).16 Example results from one replicate assay for each PDX model are shown in Figure 1b. The data from three independent replicates were compiled to calculate an EC50 and plot a dose response (Figure 1c). The in vitro assays predicted that the PDX model UCD52 (EC50 69 μM) would be substantially more sensitive than either HCI01 (EC50 2.1 × 10² μM) or HCI09 (EC50 3.2 × 10² μM) models to a single equivalent dose of carboplatin administered in vivo.
Figure 1.
Effects of carboplatin on three PDX models as measured in vitro by HSLCI. (a) Timeline for key steps in sample preparation and measurement of mass accumulation. (b) Representative results from a single replicate assay for each of the three PDX models (n = 1296, 544, and 1071 cells, respectively). Individual dots in the underlying scatter plot represent the mass accumulation rates of single cells measured over the interval 24–36 postdosing. Box-plot notches are indicative of 95% confidence intervals for the medians. (c) EC50 calculated by sigmoidal fit to the median mass accumulation rates for each sample and dose. N = 3 replicates.
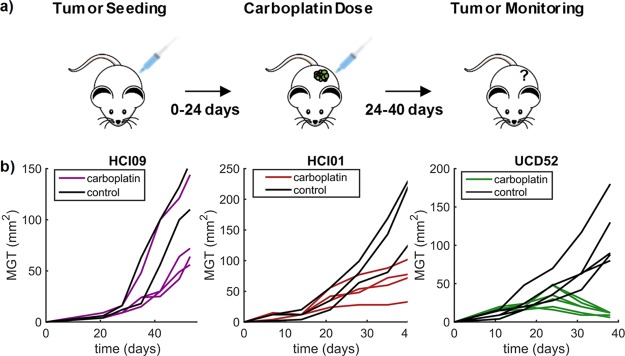
In vivo studies (Figure 2a) were performed by first seeding and then expanding mammary tumors in all three TNBC models, followed by single dose administration of vehicle or carboplatin at 40 mg/kg on days 21, 24, or 35 depending on tumor growth. This dose approximates to around 3.3 ± 1.4 mg·min/mL in humans (Figure S1b).16,17 Tumor size was determined daily in live animals by caliper measurements. As predicted by the in vitro assay, the UCD52 model was the only PDX model to demonstrate a decrease in tumor size (Figure 2b). Tumors continued growing in both HCI01 and HCI09 models after treatment, with HCI09 growing more aggressively, a result concordant with the higher EC50 for HCI09 measured in the in vitro biomass accumulation assay.
Figure 2.
Effects of carboplatin on three PDX models as measured in vivo. (a) Timeline for key steps in vivo carboplatin sensitivity assay. (b) Relative tumor size measured by caliper measurement over the course of the experiment for each model. Tumors were allowed to reach 30–60 mm2 and then treatment with a single 40 mg/kg carboplatin dose at days 35, 21, or 24 for HCI09, HCI01, and UCD52, respectively, depending on tumor growth rate. (N = 4, 4, 6 carboplatin treated mice with 2, 3, 5 control mice, respectively).
Comparison to Metabolic-Based Luciferase Assays
Analogous to the in vitro HSLCI experiments, tumors were digested and assessed for viability using luciferase-based assays, a gold standard method4,18 (Figure 3). After 72 h of dosing, the relative sensitivity of each of the three lines was the same as HSLCI measurements with HCI09 most-resistant and UCD52 most-sensitive. Metabolic-based assays have been shown to have a good sensitivity of ∼90% but a poor specificity of ∼70% in predicting in vivo outcomes.5 The ability of these assays to predict resistance in vivo is not strong enough for clinicians to trust these assays and has prevented clinical adoption. Potentially, the HSLCI can improve specificity in viability assays though the limited time cells are in culture (24 vs 72 h) and single cell sensitivity. The HSLCI predicted a higher level of resistance in HCI01 at 100 μM, which is reflected in the continued tumor growth in vivo, an unsuccessful outcome of treatment.
Figure 3.
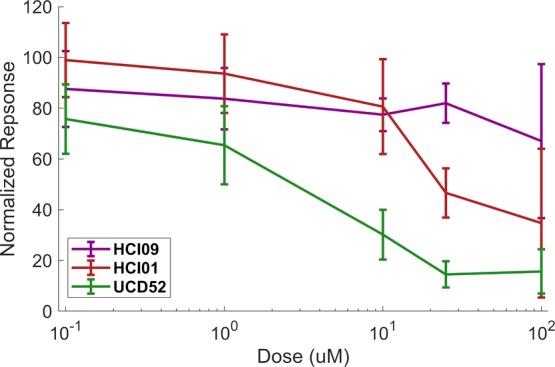
Cell viability in response to carboplatin as measured by luciferase assay. Cell viability in response to carboplatin was measured by gold standard assays in UCD52, HCI01, and HCI09 (n = 4, 7, and 6 separate experiments, respectively). Error bars represent standard deviation.
Although a similar number of cells per well was used in each assay (25 000-luciferase, 50 000-HSLCI), only five percent of well area was imaged by HSLCI. Future adaptions of HSLCI could be modified to use smaller amounts of material as only ∼200 cells per condition were required to get a signal.
Response Heterogeneity in Carboplatin-Sensitive Tumors
As shown in Figure 1b, the biomass accumulation rates of cells within the measured populations of all three TNBC PDX models exhibited significant heterogeneity. Under the imaging conditions used, this heterogeneity in biomass accumulation rates represents biological variation and not measurement noise.9,14 Of particular interest were cells which demonstrated robust growth despite a substantial population-level dose-dependent loss of biomass response. These cells could be analogous to subpopulations of drug-resistant cells seen in patient TNBC tumors, which are subsequently selected for undesirable expansion or persistence by drug treatment, making them responsible for the recurrence of tumors often seen in TNBC. Therefore, identification and isolation of these “non-responder” cells for further genomic and phenotypic characterization may aid in our mechanistic understanding of drug response heterogeneity in cancer.
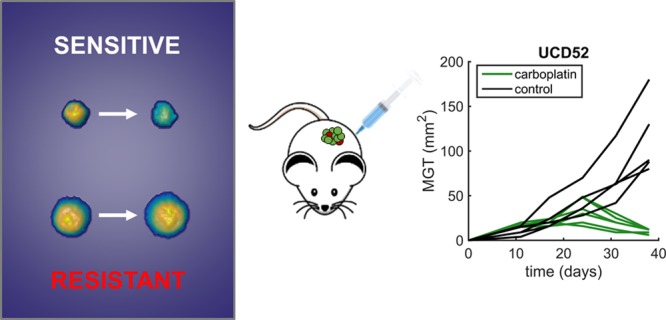
Figure 4 shows two representative examples of the biomass accumulation responses from individual cells from the most-sensitive PDX model, UCD52, after treatment with 100 μM carboplatin, which is higher than the maximum concentration experienced in humans (Figure S1). These cells showed biomass accumulation rates of −1.5 and 2.3% per hour between hours 24–36, posttreatment. Interestingly, during hours 24–36 posttreatment, in this representative experiment 47 cells, or 16% of surviving cells at 36 h exposed to 100 μM carboplatin, gained biomass at a rate of 1% or more per hour. However, the percentage of “non-responders” in the original population is lower, as the number of living cells measured at later time points is significantly reduced, relative to predosing levels, due to treatment.
Figure 4.
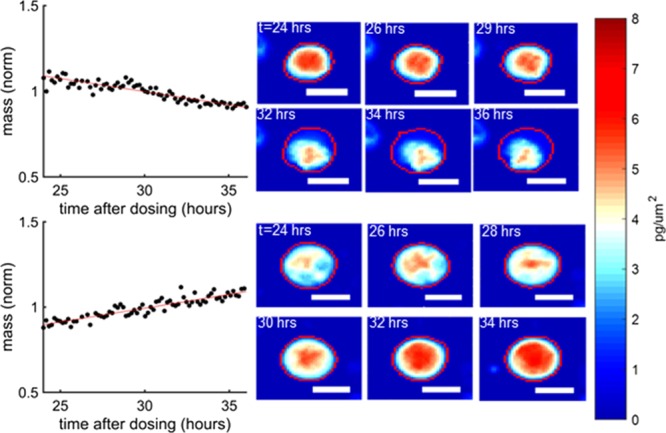
Examples of resistant and sensitive UCD52 cells to 100 μM carboplatin. UCD52 cells were exposed for 100 μM carboplatin and then monitored for 36 h afterward. The mass vs time plots refer to the cells encircled in red and the color scale bars to the left apply to all images. The top UCD52 cell was sensitive to treatment, whereas the bottom UCD52 cell grew despite high carboplatin dose, indicating heterogeneity of response and potentially resistant cells among a sensitive tumor. The white scale bars are all 10 μm.
During tumor resection, disaggregation, and enzymatic digestion, only large pieces of debris are filtered out. Furthermore, beyond the surgical excision step, there is no active selection of breast cancer cells. As a result, the cells measured by the HSLCI are a combination of stromal and tumor cells. In previous fluorescence-associated cell-sorting experiments that specified epithelial and stromal cells, between 80 and 85% of cells were found to be cancer cells.18 While a lack of biomarker-based tumor cell selection increases the ease of use and decreases the expense of each HSLCI run, the presence of nontumor cells and pieces of cell debris whose biomasses remain static could obscure measurements.
These challenges are overcome using two strategies. First, as PDX tumor cells are non-adherent, they remained in three-dimensional (3D) spherical shape and relatively dense with many PDX cells having subregions of biomass density over 8 pg/um2. This 3D shape causes PDX cells to remain in a focal plane distinct from stromal cells, such as fibroblasts which attach to the bottom of the plate. This allows for the HSLCI to focus on the imaging plane directly above the bottom of plate on cells that are not attached. Second, fibroblasts have a typical area of around 3600 μm2, whereas unattached cancer cells have an area of approximately 200–800 μm2.19 This size disparity allows for the rapid resolution of cell type. Future analyses could leverage distinct phenotypic features of fibroblasts, such as lamellipodia, which decrease circularity and further distinguish stromal cells from tumor cells. Finally, debris are easily distinguished by their low biomass, allowing in silico exclusion. Importantly, the same filtering methodology was applied across all three PDX models evaluated in these experiments. Definitive growth response signals were detected in all three PDX models.
These study results demonstrate HSLCI’s ability to rapidly quantify the drug sensitivity of single, freshly explanted tumors cells, within 40 h of excision. This time scale is feasible in the clinic as it is the same as widely used antibiotic susceptibility tests. This builds upon previous work with the HSLCI platform that quantified single-cell sensitivity of melanoma cell lines to vemurafenib14 and overcomes the lack of ex vivo cell proliferation seen in most cancers, including these TNBC PDX models.18
To succeed as a clinical assay for personalized therapeutic susceptibility, the HSLCI must have faster turnaround times and demonstrate in vivo sensitivity correlations better than current in vitro methods, which have not seen wide-scale adoption. With a maximum turnaround time of 40 h from tumor excision to useable results and a fully-automated analysis pipeline, the HSLCI reduces both cost and time compared to current gold standard methods. Furthermore, these initial results are promising as they demonstrate the correlation of in vitro drug sensitivity profiling with in vivo assessments of therapeutic efficacy in preclinical PDX breast cancer models.
Future research utilizing HSLCI will include increased throughput and the characterization of resistant subpopulations to assess whether the identified cells by HSLCI are the same cells that proliferate in vivo, leading to therapy resistance commonly seen in TNBC. Additionally, HSLCI will also be used to assess drug sensitivity in biopsies from TNBC and other human solid tumors.
Methods
PDX Mouse Models
Three triple negative PDX lines, HCI01, HCI09, and UCD52 were obtained from the Huntsman Cancer Institute (HCI) and University of Colorado Denver (UCD). Cells were resuspended in Matrigel (Corning) and injected into the fourth mammary fat pads of non-obese diabetic severe combined immunodeficient gamma (NSG) mice.
Preparation of Tumor Suspension
As described in Turner et al.18 and DeRose et al.,15 PDX tumors were excised from the mammary fat pads of NSG mice once they had reached approximately 10 mm × 10 mm in size. Untreated tumors were digested with a solution of DMEM/F12, 5% fetal bovine serum, 300 U/mL Collagenase (Sigma), and 100 U/mL hyaluronidase (Sigma). Digested tissue was resuspended in NH4Cl and trypsinized to generate single cell suspensions.
HSLCI Operation
The HSLCI system and analysis pipeline are identical to that described in detail in Huang et al.14 The HSLCI platform consists of a custom-built inverted optical microscope coupled to an off-axis quadriwave lateral shearing interferometric camera (SID4BIO, Phasics, Inc.). Cells are imaged in single, standard-footprint (128 mm × 85 mm), glass-bottomed, multiwell plates. Acquired images are analyzed in near real-time by a downstream PC (Dell Precision Tower 5810). All of the platform’s hardware and software components are available commercially. A 40× objective (Nikon, NA 0.75) was used for the growth kinetics studies described.
The HSLCI platform was installed inside a standard cell culture incubator (Steri-Cult CO2 Incubator, Thermo Fisher). Cells were plated on 24-well glass bottom plates at 5 × 10⁴ cells per well in M87 medium15 and doses of pharmaceutical grade carboplatin, obtained from VCU Dalton Oncology Clinic, ranging from 0 to 1 mM. Plates were incubated for 24 h and then imaged by the HSLCI for 12 h.
To account for the potential noise introduced by drifting cells and cell debris that could artificially impact measured growth rates of stable cells, data were quality-filtered such that only biomass tracks (mass vs time) exhibiting linear fit standard errors of less than 0.002 normalized mass units per hour, and a total mass of greater than 300 pg but less than 3000 pg were included. These error bounds ensure that our confidence in the hourly mass accumulation rates is ±0.2% and that only true physiologic cell growth is measured. The minimum mass filter ensures that our data only include individual cells or two-three cell clusters, and not cell debris.
In Vivo Mouse Studies
Mammary tumors were generated by injecting 500 000 cells from HCI01, HCI09, or UCD52 single cell suspensions into the abdominal mammary gland in 50% Matrigel. After ∼3 weeks, when tumors were in log-phase growth (30–60 mm2), a single intraperitoneal injection of vehicle (normal saline) or carboplatin (40 mg/kg) was administered. Mice were randomized to have some small and some larger treated tumors in vehicle or carboplatin-treated group. Tumor sizes were recorded for an additional 3 weeks.
Luciferase Assays
HCI09, HCI01, and UCD52 cells were plated in M87 media, in triplicate (25 000 cells/100 μL per well) in 96-well plates coated with poly-2-hydroxyethyl-methylacrylate (poly-HEMA) to provide a low-attachment surface and incubated at 37 °C for 3 days with six different concentrations of carboplatin. To assess cell viability over time, d-luciferin (10 μL/well) was added and plates were IVIS-imaged on day 3.
Acknowledgments
Funding was provided by National Institutes of Health grant R01CA185189 to J.R. and M.A.T., by METAvivor to J.C.H., and in part, by the NCI Cancer Center Support Grant P30CA016059 to the VCU Massey Cancer Center and P30CA016042 to the UCLA Jonsson Comprehensive Cancer Center.
Supporting Information Available
The Supporting Information is available free of charge on the ACS Publications website at DOI: 10.1021/acsomega.8b02224.
Relating patient dose ranges to in vivo concentrations in mice and in vitro maximum concentrations (PDF)
Author Contributions
Developed the HSCLI instrumentation: G.F.M., K.A.L., D.G.,·and J.R. Designed experiments: G.F.M., J.C.H., and J.R. Performed experiments: G.F.M., T.T., S.S.S., M.A.A., and J.C.H. Analyzed data: G.F.M., J.C.H., and J.R. Wrote the manuscript: G.F.M., J.C.H., and J.R. Discussed data and edited the manuscript: all authors.
The authors declare no competing financial interest.
Supplementary Material
References
- Haibe-Kains B.; El-Hachem N.; Birkbak N. J.; Jin A. C.; Beck A. H.; Aerts H. J. W. L.; Quackenbush J. Inconsistency in large pharmacogenomic studies. Nature 2013, 504, 389–393. 10.1038/nature12831. [DOI] [PMC free article] [PubMed] [Google Scholar]
- Amin S.; Bathe O. F. Response biomarkers: re-envisioning the approach to tailoring drug therapy for cancer. BMC Canc. 2016, 16, 850. 10.1186/s12885-016-2886-9. [DOI] [PMC free article] [PubMed] [Google Scholar]
- Higgins M. J.; Stearns V. Understanding resistance to tamoxifen in hormone receptor-positive breast cancer. Clin. Chem. 2009, 55, 1453–1455. 10.1373/clinchem.2009.125377. [DOI] [PubMed] [Google Scholar]
- Fan F.; Wood K. V. Bioluminescent Assays for High-Throughput Screening. Assay Drug Dev. Technol. 2007, 5, 127–136. 10.1089/adt.2006.053. [DOI] [PubMed] [Google Scholar]
- Blom K.; Nygren P.; Larsson R.; Andersson C. R. Predictive Value of Ex Vivo Chemosensitivity Assays for Individualized Cancer Chemotherapy: A Meta-Analysis. SLAS Technol. 2017, 22, 306–314. 10.1177/2472630316686297. [DOI] [PubMed] [Google Scholar]
- Sachs N.; de Ligt J.; Kopper O.; Gogola E.; Bounova G.; Weeber F.; Balgobind A. V.; Wind K.; Gracanin A.; Begthel H.; Korving J.; van Boxtel R.; Duarte A. A.; Lelieveld D.; van Hoeck A.; Ernst R. F.; Blokzijl F.; Nijman I. J.; Hoogstraat M.; van de Ven M.; Egan D. A.; Zinzalla V.; Moll J.; Boj S. F.; Voest E. E.; Wessels L.; van Diest P. J.; Rottenberg S.; Vries R. G. J.; Cuppen E.; Clevers H. A Living Biobank of Breast Cancer Organoids Captures Disease Heterogeneity. Cell 2018, 172, 373–386. 10.1016/j.cell.2017.11.010. [DOI] [PubMed] [Google Scholar]
- Vlachogiannis G.; Hedayat S.; Vatsiou A.; Jamin Y.; Fernández-Mateos J.; Khan K.; Lampis A.; Eason K.; Huntingford I.; Burke R.; Rata M.; Koh D.-M.; Tunariu N.; Collins D.; Hulkki-Wilson S.; Ragulan C.; Spiteri I.; Moorcraft S. Y.; Chau I.; Rao S.; Watkins D.; Fotiadis N.; Bali M.; Darvish-Damavandi M.; Lote H.; Eltahir Z.; Smyth E. C.; Begum R.; Clarke P. A.; Hahne J. C.; Dowsett M.; de Bono J.; Workman P.; Sadanandam A.; Fassan M.; Sansom O. J.; Eccles S.; Starling N.; Braconi C.; Sottoriva A.; Robinson S. P.; Cunningham D.; Valeri N. Patient-derived organoids model treatment response of metastatic gastrointestinal cancers. Science 2018, 359, 920–926. 10.1126/science.aao2774. [DOI] [PMC free article] [PubMed] [Google Scholar]
- Weeber F.; Ooft S. N.; Dijkstra K. K.; Voest E. E. Tumor Organoids as a Pre-clinical Cancer Model for Drug Discovery. Cell Chem. Biol. 2017, 24, 1092–1100. 10.1016/j.chembiol.2017.06.012. [DOI] [PubMed] [Google Scholar]
- Reed J.; Chun J.; Zangle T. A.; Kalim S.; Hong J. S.; Pefley S. E.; Zheng X.; Gimzewski J. K.; Teitell M. A. Rapid, massively parallel single-cell drug response measurements via live cell interferometry. Biophys. J. 2011, 101, 1025–1031. 10.1016/j.bpj.2011.07.022. [DOI] [PMC free article] [PubMed] [Google Scholar]
- Cetin A. E.; Stevens M. M.; Calistri N. L.; Fulciniti M.; Olcum S.; Kimmerling R. J.; Munshi N. C.; Manalis S. R. Determining therapeutic susceptibility in multiple myeloma by single-cell mass accumulation. Nat. Commun. 2017, 8, 1613. 10.1038/s41467-017-01593-2. [DOI] [PMC free article] [PubMed] [Google Scholar]
- Bettenworth D.; Bokemeyer A.; Poremba C.; Ding N. S.; Ketelhut S.; Lenz P.; Kemper B. Quantitative phase microscopy for evaluation of intestinal inflammation and wound healing utilizing label-free biophysical markers. Histol. Histopathol. 2018, 33, 417–432. 10.14670/HH-11-937. [DOI] [PubMed] [Google Scholar]
- Lee K.; Kim K.; Jung J.; Heo J.; Cho S.; Lee S.; Chang G.; Jo Y.; Park H.; Park Y. Quantitative Phase Imaging Techniques for the Study of Cell Pathophysiology: From Principles to Applications. Sensors 2013, 13, 4170–4191. 10.3390/s130404170. [DOI] [PMC free article] [PubMed] [Google Scholar]
- Chun J.; Zangle T. A.; Kolarova T.; Finn R. S.; Teitell M. A.; Reed J. Rapidly quantifying drug sensitivity of dispersed and clumped breast cancer cells by mass profiling. Analyst 2012, 137, 5495. 10.1039/c2an36058f. [DOI] [PMC free article] [PubMed] [Google Scholar]
- Huang D.; Leslie K. A.; Guest D.; Yeshcheulova O.; Roy I. J.; Piva M.; Moriceau G.; Zangle T. A.; Lo R. S.; Teitell M. A.; Reed J. High Speed Live Cell Interferometry: A New Method for Rapidly Quantifying Tumor Drug Resistance and Heterogeneity. Anal. Chem. 2018, 90, 3299–3306. 10.1021/acs.analchem.7b04828. [DOI] [PubMed] [Google Scholar]
- DeRose Y. S.; Gligorich K. M.; Wang G.; Georgelas A.; Bowman P.; Courdy S. J.; Welm A. L.; Welm B. E.. Patient-Derived Models of Human Breast Cancer: Protocols for In Vitro and In Vivo Applications in Tumor Biology and Translational Medicine, 2013; Chapter 14, Unit 14.23. [DOI] [PMC free article] [PubMed]
- Oguri S.; Sakakibara T.; Mase H.; Shimizu T.; Ishikawa K.; Kimura K.; Smyth R. D. Clinical Pharmacokinetics of Carboplatin. J. Clin. Pharmacol. 1988, 28, 208–215. 10.1002/j.1552-4604.1988.tb03134.x. [DOI] [PubMed] [Google Scholar]
- Nair A.; Jacob S. A simple practice guide for dose conversion between animals and human. J. Basic Clin. Pharm. 2016, 7, 27–31. 10.4103/0976-0105.177703. [DOI] [PMC free article] [PubMed] [Google Scholar]
- Turner T. H.; Alzubi M. A.; Sohal S. S.; Olex A. L.; Dozmorov M. G.; Harrell J. C. Characterizing the efficacy of cancer therapeutics in patient-derived xenograft models of metastatic breast cancer. Breast Canc. Res. Treat. 2018, 170, 221–234. 10.1007/s10549-018-4748-4. [DOI] [PubMed] [Google Scholar]
- Sheetz M. P.; Sable J. E.; Döbereiner H.-G. Continuous Membrane-Cytoskeleton Adhesion Requires Continuous Accommodation to Lipid and Cytoskeleton Dynamics. Annu. Rev. Biophys. Biomol. Struct. 2006, 35, 417–434. 10.1146/annurev.biophys.35.040405.102017. [DOI] [PubMed] [Google Scholar]
Associated Data
This section collects any data citations, data availability statements, or supplementary materials included in this article.


