Abstract
Systemic Capillary Leak Syndrome (SCLS) is an extremely rare and life-threatening vascular disorder of unknown etiology. SCLS is characterized by abrupt and transient episodes of hypotensive shock and edema due to plasma leakage into peripheral tissues. The disorder has garnered attention recently because its initial presentation resembles more common vascular disorders including systemic anaphylaxis, sepsis, and acute infections with the Ebola/Marburg family of filoviruses. Although approximately 70–85% of patients with SCLS have a concurrent monoclonal gammopathy of unknown significance (MGUS), any contribution of the paraprotein to acute flares is unknown. To identify circulating factors that might trigger acute SCLS crises, we profiled transcriptomes of paired peripheral blood mononuclear cell fractions obtained from patients during acute attacks and convalescent intervals by microarray. This study uncovered 61 genes that were significantly up- or downregulated more than 2.5-fold in acute samples relative to respective baselines. One of the most upregulated genes was ADM, which encodes the vasoactive peptide adrenomedullin. A stable ADM protein surrogate (pro-ADM) was markedly elevated in SCLS acute sera compared to remission samples or sera from healthy controls. Monocytes and endothelial cells (ECs) from SCLS subjects expressed significantly more ADM in response to proinflammatory stimuli compared to healthy control cells. Application of ADM to ECs elicited protective effects on vascular barrier function, suggesting a feedback protective mechanism in SCLS. Since ADM has established hypotensive effects, differentiating between these dual actions of ADM is crucial for therapeutic applications aimed at more common diseases associated with increased ADM levels.
Introduction
SCLS, which was first described by Clarkson in 1960, is an ultra-rare disease (less than 300 confirmed cases) occurring infrequently in children and more commonly in middle-aged adults. Its genetic and molecular underpinnings are unknown. Patients with SCLS exhibit no abnormalities at baseline but experience rapidly developing attacks of profound hypotension followed by “third-spacing” of fluids in peripheral tissues following resuscitation with intravenous fluids.1 Triggers for acute SCLS flares are unknown, but a majority of patients experience prodromal symptoms suggestive of antecedent infections (e.g. upper respiratory) prior to the onset of attacks.2 This clinical presentation suggests that systemic inflammation has a role in the induction of vascular leakage. SCLS is diagnosed clinically on the basis of transient hypotension, hemoconcentration (elevated hemoglobin and hematocrit), and serum hypoalbuminemia 2,3 The initial presenting signs and symptoms of SCLS are quite nonspecific. It remains a clinical diagnosis, and there are no unique biomarkers or diagnostic tests. For these reasons, many patients go years without the correct diagnosis.4 It can be difficult to differentiate SCLS from sepsis upon initial presentation as either may present with fevers, elevated WBC count, hypotension, and hemoconcentration. However, sepsis is not typically associated with severe hypoalbuminemia and anasarca following the administration of IV fluids so profound that it results in compartment syndromes and therapeutic fasciotomies. Whereas elevated Hgb/Hct resulting from fever/dehydration in sepsis typically decrease following IV fluid administration, they tend to remain high for prolonged periods of time in SCLS due to the severity of vascular leakage. In anaphylaxis, a trigger can often be identified, and it is associated with allergic signs and symptoms, including urticaria, stridor, or wheezing, which are not present in SCLS.3 Treatment of acute episodes is limited to support of vital organ functions through maintenance of circulating blood volume using intravenous fluids and vasopressors and renal replacement therapy as necessary to treat acute kidney injury that may result from intravascular volume depletion.
We have accrued a registry of 63 patients with a confirmed diagnosis of SCLS, which is currently among the largest cohorts in the world given that current worldwide prevalence is likely to be less than 150 cases. We demonstrated previously that proinflammatory mediators (e.g. IL-1β, IL-6, IL-8, CCL2, CXCL10, TNFα), and angiogenic proteins (vascular endothelial growth factor A, VEGF-A, and angiopoietin-2, Angpt-2) can be detected as transient spikes in sera of SCLS patients at the onset of flares,5,6 relative to levels detected in convalescent intervals. In addition, monocytes from SCLS subjects produced more CXCL10 compared to those from healthy controls, suggesting an overexuberant leukocyte response to proinflammatory mediators. Consistent with the importance of humoral mediators in the vascular barrier dysfunction associated with SCLS episodes, sera from SCLS subjects obtained during flares, but not during remission, reduced barrier integrity of normal endothelial cells (ECs) in culture and increased vascular permeability through mechanisms involving internalization of a junctional molecule, vascular endothelial cadherin (VE-Cadherin), and through increased actin stress fiber formation.5
No biomarkers or pathogenic mediators unique to SCLS have yet been identified. We have initiated a search for such factors by analyzing gene expression patterns in peripheral blood mononuclear cells (PBMCs) obtained from patients during acute episodes relative to PBMCs obtained during periods of disease remission. One of the most upregulated genes, ADM, encodes a 52-amino acid secreted peptide originally isolated from human pheochromocytoma. ADM exerts powerful hypotensive effects due to vasodilation mediated by vascular smooth muscle relaxation, but its effects on vascular permeability are less clear.7,8 Because patients with acute SCLS often present with profound hypotension out of proportion to the initial degree of vascular leak (manifesting as clinically apparent edema), we hypothesized that ADM could contribute to the symptomatology associated with flares of the disease. In this study, we explored the potential sources of ADM in SCLS and its effects on vascular barrier function.
Methods
Subjects
SCLS patients were identified and diagnosed according to criteria described previously.9 The demographics of the patients studied are summarized in Table 1. Patients were seen at the Clinical Center of the National Institutes of Health. Written informed consent was obtained from each patient, and the study protocol (09-I-0184) conformed to the ethical guidelines of the 2008 Declaration of Helsinki as reflected in a priori approval from the Institutional Review Board of the National Institute of Allergy and Infectious Diseases of NIH. Anonymized age-, sex-, and race-matched serum and lymphapheresis samples were obtained from the NIH Blood Bank.
Table 1.
Patient characteristics
| SCLS (basal sera) | SCLS (acute sera) | Controls | |
|---|---|---|---|
| Male | 25 | 13 | 9 |
| Female | 12 | 6 | 7 |
| Age (years mean ± SD) |
51.61±11.66 | 48.84±12.38 | 52.19±8.63 |
| Caucasian | 36 | 19 | 15 |
| Classic SCLS | 37 | 19 | N/A |
Reagents and antibodies
Human microvascular ECs (HMVECs) and the U937 human monocyte cell line were purchased from ATCC. Phorbol 12-myristate 13-acetate (PMA) was obtained from Sigma-Aldrich. The secretory transporter inhibitor monensin and the following antibodies were from Biolegend: phycoerythryin (PE)-Cy7 conjugated anti-CD14 and Brilliant Violet (BV605)-conjugated anti-CD3. PE-conjugated anti human CD19 was from BD Biosciences. Allophycocyanin-conjugated anti-ADM was from US Biological. Recombinant human ADM was purchased from GenScript, and human VEGF-A165 was from Peprotech.
Microarray analysis
PBMCs were isolated from whole blood obtained by venipuncture at or near the onset of an acute SCLS crisis and from the same patient during a convalescent interval. RNA was extracted using the RNAeasy kit (Qiagen) and subjected to microarray analysis using the Human WG Expression Array (Illumina BeadChip) according to the manufacturer’s instructions. The complete array dataset was deposited into the Gene Expression Omnibus (GEO) databank (Accession number: GSE97287). Data were analyzed using Partek Genomics Suite, and statistical significance determined using two-way ANOVA.
Cell isolation and stimulation
Monocytes were isolated from PBMCs using a negative selection magnetic bead protocol (Pan Monocyte Isolation Kit, Miltenyi). The purity of monocyte preparations was assessed by flow cytometry using CD14 antiboy and was typically > 90%. Blood Outgrowth Endothelial Cells (BOECs) were generated as described previously10 and maintained in EGM2 medium (Lonza) supplemented with 10% fetal bovine serum FBS. Monocytes or BOECs were left untreated or stimulated for 24 hours with the indicated reagents, followed by RNA extraction and gene expression analysis by qPCR.
“Re-washed” (RW) medium
U937 monocytes were treated with PMA (10 ng/ml) in complete RPMI medium containing 10% FBS for 24 hrs. Adherent cells were then washed three times in PBS to remove residual PMA. Cells were cultured in 10 ml complete RPMI for additional 24 hours followed by collection of supernatants and centrifugation to pellet cells and debris. Aliquots of the supernatants (RW medium) were stored at −80oC until use.
Proteome Profiler Array
Cytokine components of RW medium were analyzed by Proteome Profiler Array (R & D Systems), according to manufacturer’s guidelines.
Flow cytometry
PBMCs were left untreated or treated with RW medium (10% vol/vol) or LPS (100 ng/ml) in serum-free medium supplemented with 0.1% BSA for 24 hours in the presence of monensin, followed by antibody staining of both intracellular and cell surface markers as described.6 Cell staining was analyzed using an LSRII flow cytometer (BD BioSciences) and FlowJo software.
Quantitative real-time PCR (qPCR)
cDNA was synthesized from RNA samples using SuperScript reverse transcriptase kit (Thermo Fisher Scientific). Gene expression was quantified using gene-specific TaqMan probes according to manufacturer’s guidelines (Thermo Fisher Scientific). Expression of target genes were normalized the housekeeping gene POP4 (POP4 homolog, ribonuclease P/MRP subunit). TaqMan probes for human ADM and human POP4 (Thermo Fisher Scientific) were used to detect amplicons by real-time quantitative PCR (qPCR). The relative Ct value for ADM (∆CtADM) in each sample was normalized to POP4 Ct of the same sample: ∆CtADM = CtADM-CtPOP4. ∆∆Ct was then calculated according to the following formula: ∆∆CtADM = ∆CtADM- ∆Ct (calibrate). Relative expression (RQ) of ADM in each sample was calculated using formula: RQ = 2^-∆∆Ct.
Pro-ADM ELISA
Plasma pro-ADM levels were analyzed by ELISA (MyBioSource) according to the manufacturer’s instructions.
Impedance Measurements
Impedance measurements were used to assess endothelial barrier function. Electrical resistance was measured across HMVEC monolayers at 4,000 Hz using the Electric Cell-substrate Impedance Sensing (ECIS) Zθ apparatus (Applied BioPhysics) as described previously.5 Briefly, HMVECs were serum starved in EBM plus 0.2% BSA for five hours, and ADM was added as a 10x stock solution in the same medium. Medium alone was used as the control. Data were collected from two replicates per condition in each experiment.
Paracellular permeability assays
HMVECs (4 × 10⁴ cells) were plated in Transwell chambers coated with collagen I (10 μg/ml) (6.5 mm diameter, 3 µm pore size, polyester membrane; Costar) and grown in complete PeproGrowth MicroV medium without phenol red (PeproTech) to confluence. Cells were then serum starved for 2 hr in 0.2% BSA/serum free basal medium (150 µl). 800 µl of the same medium was added to the lower chamber of each well. FITC-conjugated dextran (4, 40 and 150 kDa; Sigma) was directly added to the upper chambers (final concentration 1 mg/ml). Cells were then left untreated or stimulated with thrombin (0.05 U/ml) or ADM (20 nM) alone or in combination. Maximum values were determined in wells containing dextran but no cells. Aliquots collected from the lower chamber at the indicated times were transferred to 96-well plates, and fluorescence intensity of each sample was measured using a microplate reader (FilterMax F5; Molecular Devices) at wavelengths of 485 nm (excitation) and 535 nm (emission). Results are depicted as the percent maximal values.
Immunofluorescence
HMVECs were grown to confluency on 0.1% gelatin coated 15-μm slides (ibidi), serum starved with 0.2% BSA in EBM-2 medium (5 hrs. at 37°C), and treated with medium alone, VEGF-A165 (100 ng/ml) with or without ADM (20 nM) or ADM alone for 15 min at 37°C). Cells were fixed in 4% paraformaldehyde in PBS (15 min. at RT), permeabilized with 0.3% Triton X-100 in PBS (3 min), blocked with a blocking buffer (3% BSA in PBS, 1 hr, RT) and incubated with mouse anti-human VE-cadherin antibody (clone 55–7H1, BD Pharmingen; 1:200 dilution in the blocking buffer, overnight, 4°C). Primary antibody staining was detected using goat anti-mouse secondary antibody (Invitrogen; 1:300 dilution in blocking buffer, 1 hr. at RT). Cell nuclei were counterstained with DAPI in PBS (500 ng/ml, 1 min, RT). Imaging was performed using a Leica SP8 confocal microscope. VE-cadherin disruption was quantitated by ImageJ. Disrupted regions of VE-cadherin immunoreactivity on membranes of each cell were measured and normalized by the perimeter of the cell. At least 79 cells for each condition were used for the quantification. Results were expressed as percentage of the cell border without VE-cadherin.
Statistics
qPCR and ELISA data were analyzed with the GraphPad Prism 7 software package. Non-parametric tests were used for analysis of patient samples (Mann-Whitney test for analysis of two groups; Kruskal-Wallis for analysis of multiple groups). Two-way ANOVA was used to analyze impedance measurement data, and microarray data was analyzed using Partek Genomic Suite. p values < 0.05 were considered significant.
Results
Transcriptomic profiling of PBMCs from SCLS subjects
SCLS is a chronic relapsing/remitting disease of unknown etiology. Patients have no residual symptoms at baseline yet experience recurrent and transient episodes of hypotension followed by massive peripheral edema typically confined to the peripheral extremities. Because the clinical history and our prior analysis of SCLS sera indicated a role for inflammatory mediators in the induction of acute SCLS,5,6 we hypothesized that flares result from an aberrant leukocyte response to one or more of these inflammatory stimuli, resulting in overproduction of humoral substances associated with vascular hyper-permeability and hemodynamic collapse. Analysis of the transcriptome of leukocytes from SCLS patients might also reveal unique inflammatory mediators, notably those that could promote vascular hyper-permeability. With the intent of identifying factors linked to disease manifestations, we queried gene expression patterns in PBMCs obtained from patients in the midst of an acute crisis and compared them to matched samples obtained during intervals of disease quiescence. We performed microarray analysis on 24 matched samples from 12 patients. After quality control examination of the raw data, 19 samples were included in the final analysis (9 acute, 10 basal). As shown in the Hierarchical Clustering HeatMap (Figure 1A), 8 out of 9 acute samples and all of the basal samples exhibited clustering in this analysis, indicating similar gene expression patterns within conditions among subjects. Furthermore, 61 genes were differentially expressed more than 2.5-fold (p < 0.05, 2-way ANOVA). Among the transcripts displaying the most extensive differential expression in acute SCLS relative to remission were ADM (2.90-fold), IL-7 receptor α (−3.38-fold), B cell lymphoma 11B (BCL11B, −3.31-fold), CD2 (−2.63-fold), IL-1 receptor type II (IL-1R2, 3.61-fold) and IL-32 (−3.29-fold). Pathway analysis demonstrated prominent roles for T cell/macrophage/EC activation, chemokine and leukocyte extravasation signaling pathways, among others (Figure 1B). To confirm the ADM expression patterns suggested by microarray, we analyzed transcripts in individual samples by quantitative PCR using gene-specific primers. Consistent with microarray results, ADM expression was increased more than twenty-fold in episodic samples relative to samples obtained during periods of remission (Figure 2A). Baseline ADM expression did not differ significantly in PBMCs from asymptomatic SCLS subjects or healthy controls (Figure 2B).
Figure 1. HeatMap of significantly altered genes in SCLS subjects during disease flares relative to disease quiescence.
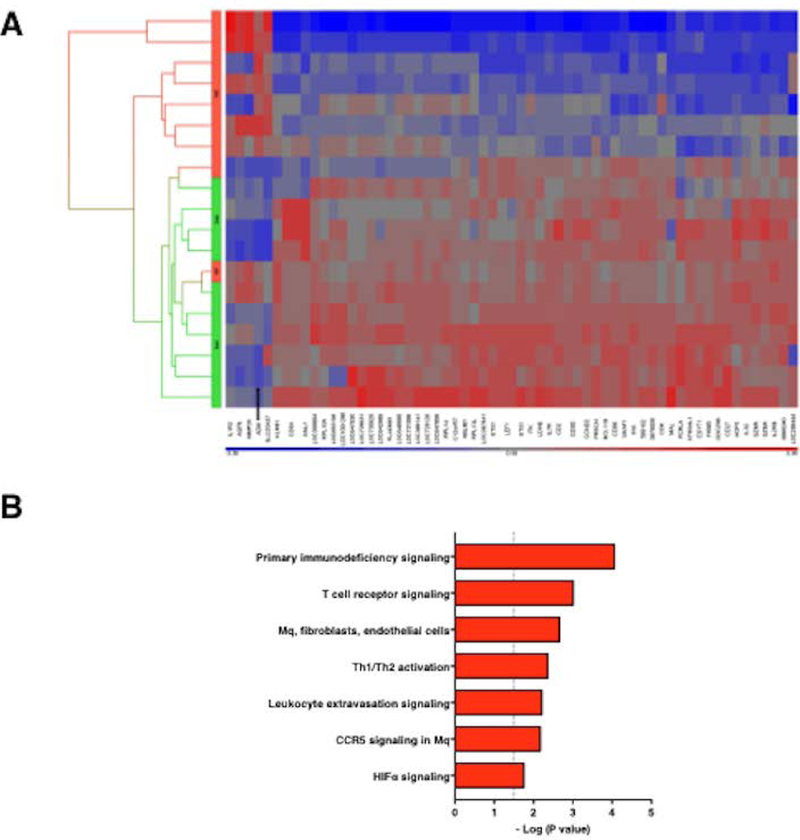
(A) PBMCs from 12 SCLS subjects, obtained during either remission (basal) or acute (episodic) phases, were isolated from peripheral blood. RNA was extracted and subjected to microarray analysis as described in the Methods. 61 genes were significantly changed for at least 2.5-fold by 2-Way ANOVA, as shown in the Hierarchical Clustering HeatMap (A) (p < 0.05). y-axis is color coded to indicate basal (green) or acute episodic (red) samples. (B) Ingenuity pathway analysis of transcriptome analysis of acute vs. basal PBMCs graphed by Benjamini-Hochberg corrected p-value. Dash p=0.05; Mq=macrophage.
Figure 2. ADM expression in PBMCs.
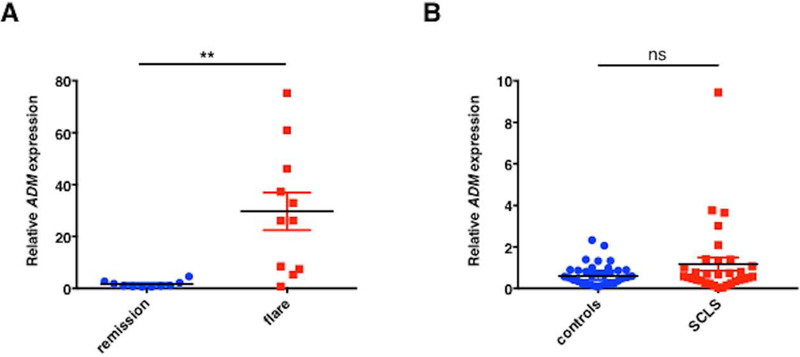
(A-B) Total RNA was extracted from PBMCs obtained from SCLS patients (during periods of remission or flares) or from healthy controls and reversed transcribed into cDNA. TaqMan gene-specific probes were used to analyze relative ADM. Data are mean ± s.e.m.; **p= 0.004; Wilcoxon paired t test; ns = not significant, unpaired t test.
Pro-ADM levels are markedly increased in acute SCLS sera
To evaluate the role of ADM in acute SCLS, we first analyzed ADM protein levels in sera. Circulating ADM is highly unstable with a serum half-life of approximately twenty minutes.11 To overcome this hurdle, we measured levels of pro-ADM, a biologically inactive yet chemically stable mid-region precursor of ADM that is released together with ADM at a 1:1 ratio; has a half-life of several hours; and has been used as a surrogate for ADM in other diseases.12,13 Serum pro-ADM levels were significantly elevated in acute SCLS sera compared to either convalescent SCLS sera or sera from healthy controls (Figure 3A). There appeared to be two distinct groups: one with relatively high pro-ADM levels during the acute phase, and another with significantly lower values (p<0.0001, Mann-Whitney). We found previously that many serum factors peak relatively early in the course of an SCLS flare but decrease rapidly during the course of the episode.5 Since most acute samples were sent to us from offsite locations, variations in the timing of sample collection relative to disease symptoms (i.e. episode onset v. mid-episode) could account for these differences as we have seen a rapid decline in cytokine levels (e.g. VEGF-A) after the onset of an episode.5 In addition, at the time of acute sample collection, 6/8 patients in the ADMlo group were experiencing an attack of mild clinical severity, which may have resulted in lower peak values. Even taking these factors into account, ADM levels during flares were much higher than in matched remission samples in nearly all patients (15 out of 18). Serum pro-ADM levels increased at least 5-fold during a flare relative to asymptomatic intervals in more than half of the subjects (8 out of 15) (Figure 3B).
Figure 3. Elevated pro-ADM serum levels during SCLS flares.
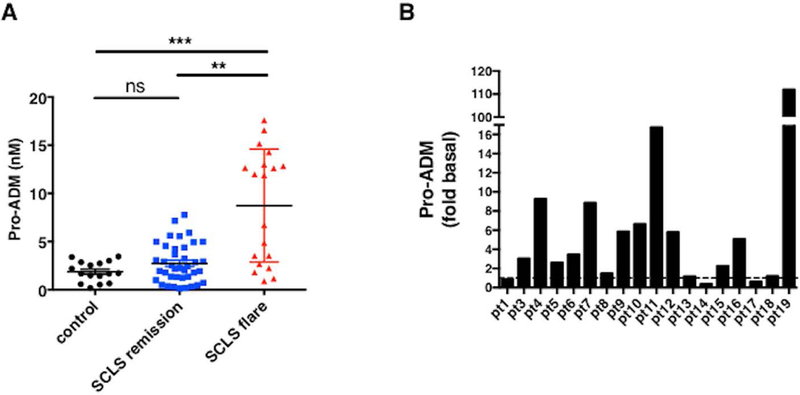
Sera from SCLS subjects (obtained during flares or periods of remission) or from healthy donors were analyzed by ADM-specific ELISA. (A) Data show mean ± s.e.m., n=16–20 per group; ***p < 0.0003, Kruskal-Wallis. (B) Data are fold change over basal pro-ADM levels for each individual SCLS subject.
Monocytes and ECs from SCLS subjects express more ADM in response to inflammatory mediators
Our studies so far demonstrated increased ADM expression in PBMCs of SCLS subjects and increased serum pro-ADM levels during disease flares. Previous studies have shown that monocytes and ECs are abundant sources of ADM.14–16 We hypothesized that inflammatory mediators present during acute SCLS attacks induce ADM secretion by monocytes and/or ECs. We assessed ADM expression in peripheral blood monocytes and BOECs at baseline and following treatment with an inflammatory stimulus. To mimic the cytokine storm surrounding SCLS crises, we treated cells with supernatants from PMA-stimulated U937 monocytes. By proteomic analysis, we found that this reagent (“rewashed medium, RW”) is enriched in many of the same inflammatory mediators present in acute SCLS sera including CCL2, TNFα, IL-8, and IL-1β5,6 relative to medium alone (Figure S1). RW medium or lipopolysaccharide (LPS), but not individual SCLS-associated mediators Angpt-2, CXCL10, IFNγ, or CCL2, alone or in combination, induced a robust increase in ADM expression in both monocytes and BOECs over a period of 6–48 hours (Figure S2). Purified monocytes from SCLS subjects expressed similar amounts of ADM as did those from healthy controls at baseline but significantly more ADM in response to stimulation with RW medium, matching microarray results (Figure 4A). Similarly, RW medium induced significantly more upregulation of ADM expression in BOECs from SCLS subjects compared to those from healthy controls (2.54-fold v. 1.62-fold increase over unstimulated cells, Figure 4B). Cellular receptors for ADM consist of the corticotropin releasing hormone like receptor, which has several endogenous ligands, complexed to co-receptors of the receptor activity modify protein (RAMP) family.17 We analyzed expression of RAMP2 by qPCR in BOECs and monocytes as this co-receptor for CRLR is most specific for ADM.18 However, we found no significant difference in RAMP2 expression in SCLS and healthy donor-derived cells, either at baseline or in response to proinflammatory stimuli (Figure S3). These results demonstrate that blood monocytes and ECs are both sources of ADM and that monocytes and ECs from SCLS patients have heightened responses to inflammatory stimuli compared to those from healthy subjects despite comparable receptor expression.
Figure 4. ADM expression in leukocytes and ECs in SCLS.
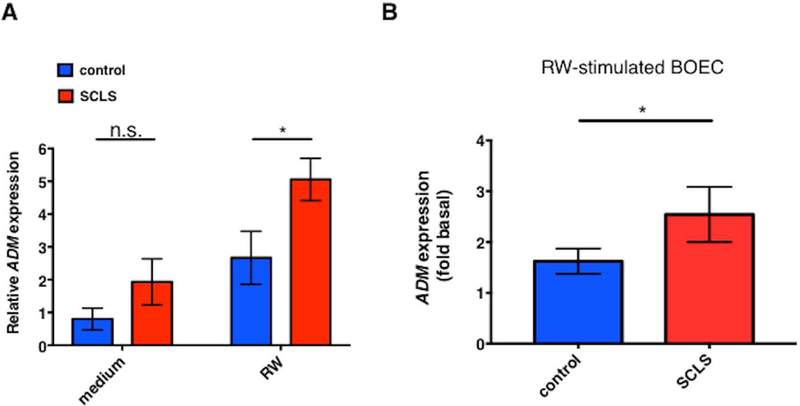
(A-B) ADM expression was assessed in purified monocytes (A) or blood outgrowth ECs (BOEC, B) from SCLS or controls by qPCR. Cells were left untreated or stimulated with 10% RW medium for 24 hours prior to RNA extraction and cDNA synthesis. Plots in (A) show mean ± s.e.m. of 6–8 subjects/group. In B, values are the relative expression in stimulated cells relative to unstimulated cells in each group (‘fold basal’). *p = 0.04, 2-way ANOVA.
To further analyze ADM secretion by leukocytes, we measured intracellular ADM by flow cytometry. Among the PBMCs at baseline, most of ADM+ cells were monocytes (CD14+; 85 ± 6%), whereas the frequency of ADM+ cells within T cell (CD3+) and B cell (CD19+) populations was substantially lower (20 ± 7% and 16 ± 5) % respectively; Figure 5A); this finding is consistent with studies of ADM and leukocyte distribution in other diseases.16 However, the frequency of ADM+ leukocytes and ADM geometric mean fluorescence intensity, (GMFI, ADM quantities per cell) were similar in PBMC samples from matched episodic/baseline periods (Figure 5A and data not shown). Previous work has indicated that ADM protein is not stored within cells but rather is continually secreted once synthesized, which could account for the similar ADM expression in baseline and episodic PBMC samples.16 However, However we could not detect significant increases in ADM+ cell frequencies and ADM GMFI by flow cytometry following treatment of leukocytes with humoral factors linked to the inflammatory microenvironment of SCLS including RW medium in the presence of protein transport inhibitors including brefeldin A or monensin (Figure 5B), suggesting that ADM secretion from cells may involve a mechanism independent of monesin and brefeldin A.
Figure 5. Monocytes are a major source of ADM within PBMCs.
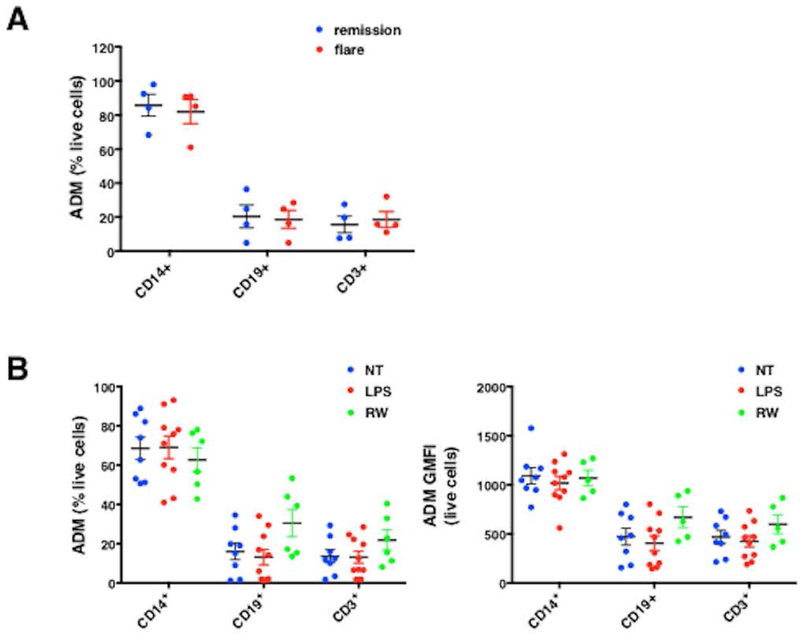
(A-B) Intracellular ADM expression in PBMCs from SCLS patients obtained during flares or remissions (A) or from controls left untreated (no treatment, NT) or stimulated with LPS (100 ng/ml) or 10% conditioned macrophage medium (“RW”) for 24 hours was evaluated by flow cytometry in the presence of monensin (B). Frequency of ADM producing cells is expressed as percentage of total live cells (A, B left panel), or geometric mean of fluorescence intensity of ADM expression/per cell (GMFI, B right panel).
ADM promotes vascular endothelial barrier function
Whereas previous studies have indicated that ADM induces endothelial proliferation and angiogenesis,19 its effects on endothelial permeability in vivo have not been fully characterized although several studies have shown beneficial effects on barrier integrity.15,20,21 To examine this issue further, we measured electrical resistance across monolayers of normal microvascular ECs (HMVECs). We found that stimulation of these cells with ADM enhances barrier function in a dose dependent manner, as reflected by significantly increased resistance (Figure 6A). Furthermore, the concurrent treatment of HMVECs with ADM and VEGF-A prevented the transient increase in permeability (decreased resistance) induced by VEGF-A alone (Figure 6B-C). In contrast, treatment of HMVEC monolayers with RW medium induced a more gradual increase in permeability (Figure 6D). Application of ADM to cells treated with RW medium for 18 hours resulted in a short-lived increase in resistance that diminished over the next several hours (Figure 6E). Thus, ADM can transiently reverse permeability induced by proinflammatory mediators in this assay.
Figure 6. ADM enhances endothelial barrier function in vitro.
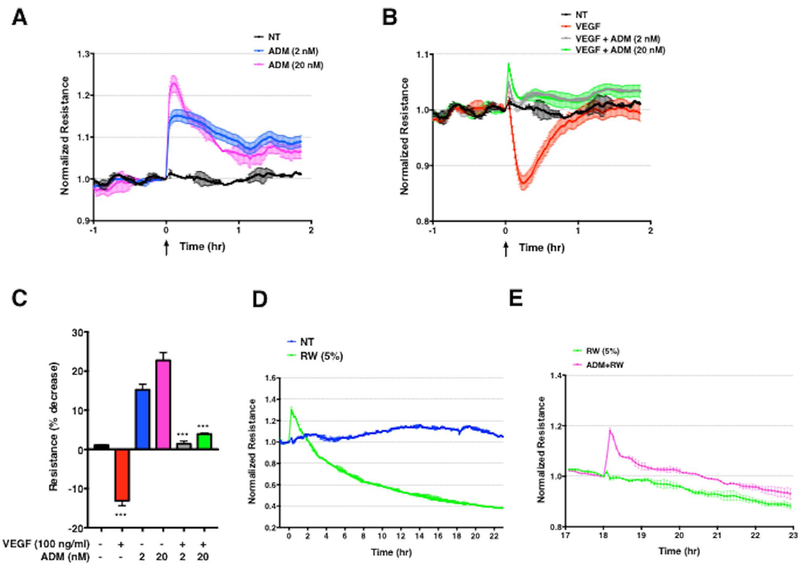
(A–C) Representative electrical resistance measurements across HMVEC monolayers over time following stimulation of ADM alone (A) or together with VEGF-A (B) at the indicated concentrations. NT = cells incubated with medium plus 0.2% BSA. In C, bar chart represents mean ± s.e.m. of the maximal percent decrease in resistance compared to baseline, measured in two independent experiments run in duplicate. ***p = 0.0002, one-way ANOVA, Tukey’s multiple comparisons. (D–E) Impedance measurements in HMVECs stimulated with RW medium (5% vol/vol) (D) or RW medium for 18 hours followed by application of ADM (E). Graphs are from a single experiment representative of three similar experiments.
In order to better characterize what type of permeability is affected, we performed paracellular flux assays using fluorescently-conjugated dextrans of different molecular weights. We tracked the flux of these conjugates over time across HMVEC monolayers plated in wells containing Transwell inserts. We focused on ADM’s effect on thrombin-induced permeability as this stimulus gave the most robust increase in permeability in these assays. We found that thrombin stimulation alone substantially increased flux of FITC-dextran of all sizes (4, 40, and 150 kDa). Application of ADM alone had little effect on FITC-dextran flux while co-application of ADM and thrombin strongly reduced the flux of FITC-dextran induced by thrombin, regardless of size (Figure S4). Importantly, the effect of ADM was transient: it had little effect on thrombin-evoked permeability at 15 minutes while robustly inhibiting permeability at 30 minutes. The inhibitory effects of ADM began to wane at one hour (particularly for the 4 kDa FITC-dextran).
To clarify the mechanisms underlying this phenotype, we analyzed the effect of ADM on VEGF-A-mediated VE-cadherin expression at cell junctions and F-actin formation by immunofluorescence. HMVEC monolayers treated with medium alone displayed nearly continuous VE-cadherin immunoreactivity at cell junctions (Figure 7A). In response to VEGF-A, expression of VE-cadherin on cell membranes was markedly decreased and accompanied by gaps between adjacent cells and modestly increased central actin stress fibers. Treatment of cells with ADM alone stabilized junctional VE-cadherin expression and increased peripheral (cortical) F-actin, which is predicted to fortify the vascular barrier.22 Concurrent application of ADM and VEGF significantly reduced the effect of VEGF-A on VE-cadherin disruption but had little effect on F-actin (Figure 7B). These results indicate that ADM affects endothelial cell morphology at baseline and in the presence of a canonical endothelial permeability-increasing protein, VEGF-A that promote vascular barrier function.
Figure 7. ADM inhibits VEGF-mediated adherens junction disruption.
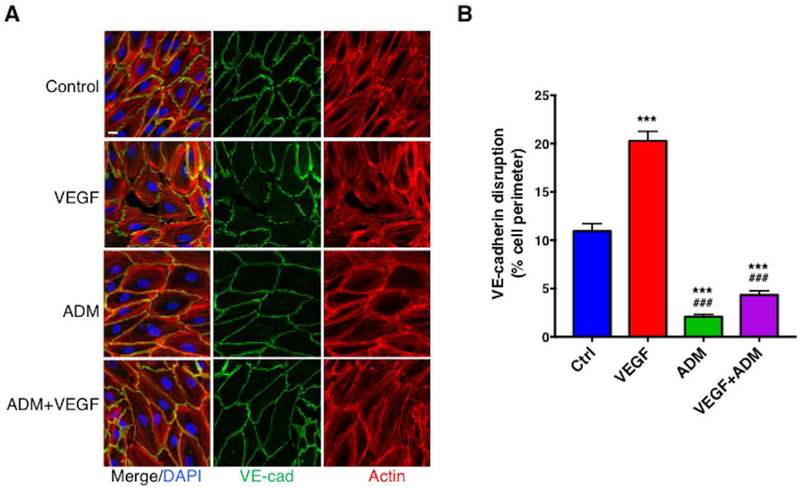
(A–B) Confluent HMVECs were treated with VEGF-A (100 ng/ml), ADM (20 nM) or both together for 15 min at 37°C. Cells were immunostained with anti-VE-cadherin (green) and phalloidin (Actin, red) and cell nuclei were counterstained with DAPI (blue) (A). (B) VE-cadherin disruption was quantified as described in the Methods. Data are plotted as mean ± s.e.m. and analyzed using one-way ANOVA. ***p< 0.001 vs. control; ###p<0.001 vs. VEGF-A. n≧119 cells for each group measured in three independent experiments. Bar = 15 μm.
Discussion
Our results suggest that transient surges in circulating levels of ADM derived from monocytes, ECs, and perhaps other sources, could contribute to the dramatic hypotension and vascular collapse typical of the initial presentation of SCLS. That ADM levels are normal in sera from SCLS patients in remission is consistent with the complete absence of symptoms during convalescent intervals.
To determine the stimuli inducing ADM expression during SCLS flares, we attempted to recapitulate the inflammatory milieu characteristic of this disease by stimulating cells with individual mediators we have previously linked to acute SCLS flares (e.g. VEGF-A, Angpt-2, CXCL10, IFNγ). While none of these factors alone elicited upregulation of ADM, conditioned macrophage (RW) medium enriched in inflammatory cytokines led to a robust upregulation of ADM transcripts, suggesting that the specific factor(s) responsible remain to be identified. Oxidative stress associated with hypoxia or proinflammatory stimuli such as lipopolysaccharide (LPS) or TNFα are potent inducers of ADM expression.16,23 Tissue hypoxia is often present in severe SCLS, as evidenced by profound lactic acidosis. Such conditions could lead to activation of hypoxia-inducible factor 1-α (HIF-1α), a master transcription factor involved in the adaptive response to hypoxia. Consistent with this hypothesis, our pathway analysis of the acute SCLS transcriptome demonstrated enrichment of genes related to HIF1α signaling. Two HIF-1α consensus binding sites have been identified in the ADM promoter, and mutation of one of these sequences leads to reduced ADM expression under hypoxic conditions.24,25
Other ADM-inducing factors may include proinflammatory cytokines. Our previous analysis of SCLS sera revealed an array of proinflammatory mediators associated with SCLS flares including interleukins and chemokines.5,6 Monocytes adhere to vascular endothelium in response to chemokines, which may activate both monocytes and ECs and lead to ADM secretion. While no obvious leukocytoclastic vasculitis has been identified in the small number of skin biopsies that have been done on SCLS patients during remission, one study demonstrated perivascular mononuclear infiltrates in a skin biopsy taken during an episode.3,26
ADM is expressed widely and is involved in many physiological processes including angiogenesis, vascular tone, embryonic development, and inflammation.7,19,27 A prominent physiological function of ADM is to reduce mean arterial pressure blood pressure through cAMP generation and activation of eNOS.19,27 Although ADM surges might contribute to hypotension in acute SCLS by modulating vascular tone, the role of ADM in maintaining the integrity of blood vessels primarily involved in SCLS (e.g. skin and skeletal muscle) in vivo remains unclear. In a previous study, short-term (one hour) incubation of HMVECs with ADM reduced flux of FITC-albumin through Transwell filters over time, suggesting a barrier-fortifying effect.21 On the other hand, VEGF-A-induced vascular permeability was diminished in mice deficient in the ADM effector eNOS.20 Our impedance measurements were consistent with a barrier protective effect of ADM as treatment of HMVECs with ADM stabilized endothelial barrier function—reflected as increased electrical resistance—and counteracted the barrier-disrupting response induced by VEGF-A or conditioned macrophage medium containing proinflammatory mediators. These results are similar to those of Imai et al., who recently found that ADM suppressed the barrier disruption induced by VEGF-A on retinal endothelial cell monolayers through effects on tight junctions.28 In addition, we found that ADM’s effect on vascular barrier function was mediated by fortification of VE-cadherin-mediated cell-cell junctions. VE-cadherin is thought to be a master controller of endothelial integrity and regulates tight junction formation indirectly by controlling expression of component proteins claudin-5 and ZO1.29
Vascular leakage syndrome models in mice have been described, including those induced by cytokines (IL-2 or IL-21).30 In addition, Clarkson originally reported that plasma obtained from his index patient obtained at the peak of an episode induced a shock-like syndrome in rats.31 Based on these and other findings, it may be possible to develop an animal model of SCLS induced by SCLS plasma or specific mediators contained therein. However, IL-2 is not increased in sera from SCLS patients in the midst of acute episodes as described in our previous studies.5,6 Secondly, IL-2 or IL-21 induces vascular leakage in both lung and liver,30 two organs which do not appear to be affected in SCLS. Future studies will determine relevant mediators promoting an SCLS-like disease in mice and test the role of ADM in such models, through measurements of ADM levels in serum, evaluation of ADM expression in leukocytes, and examination of the therapeutic benefit of ADM blockade.
Further studies including measurements of pro-ADM levels over the course of an SCLS episode and cross-comparison of levels in SCLS and other diseases such as sepsis will be needed to determine whether or not ADM levels will be useful to predict the onset of flares of SCLS, evaluate disease progression, or assess efficacy of therapeutic interventions. For example, since warning signs and/or a characteristic prodrome seldom precede SCLS crises prior to the sudden onset of frank shock, monitoring of pro-ADM levels during periods of high risk (e.g. infections) might be used to assess the need for acute therapeutic intervention, e.g. intravenous immunoglobulin infusion therapy, which has been shown to mitigate the severity of SCLS episodes.32 Similarly, monitoring of pro-ADM levels during convalescent intervals could represent a biomarker of disease progression in the absence of overt crises in patients with frequent, but less severe episodes. Finally, targeting ADM-related pathways (e.g. NO), might be viable to treat vasopressor-resistant hypotension that is frequently seen in acute SCLS. In support of the hypothesis, a recent case report demonstrated the efficacy of administration of methylene blue, a NO scavenger, in reversing hypotension in a critically ill patient with SCLS.33
In summary, our results suggest that surges of ADM in acute SCLS represent a feedback compensation mechanism that can thwart the actions of permeability mediators abundant in the circulation. ADM levels are increased in many diseases including sepsis, cardiovascular disease, hypertension, heat failure, and systemic inflammatory response syndrome,13,34 yet levels in SCLS are equivalent or even exceed those observed in these conditions. Distinguishing between the dual actions of ADM would be crucial for targeted therapies as simply neutralizing ADM may rescue hypotension while jeopardizing vascular integrity. Targeting of specific molecules downstream of ADM’s distinct signaling pathways, such as enhancing Rac1 activity or inhibiting CPI-17, an inhibitor of myosin light chain phosphatase,21,35 could rescue ADM-mediated vascular leakage and hypotension. By studying a rare disease in SCLS, we have discovered its similarity to other cardiovascular disorders associated with increased levels of ADM, suggesting that SCLS shares pathophysiological features with more common diseases.
Supplementary Material
Key Points.
Spikes in circulating adrenomedullin (ADM) characterize acute flares of SCLS, which may have a deleterious effect on systemic blood pressure but protective effects on vascular barrier function.
Both monocytes and endothelial cells derived from SCLS subjects express more ADM in response to proinflammatory mediators compared to those from healthy subjects.
Acknowledgements
This research was supported in part by the Intramural Research Program, NIAID/NIH.
Footnotes
Conflict of Interests
The authors declare no conflicts of interest.
References
- 1.Kapoor P, Greipp PT, Schaefer EW, et al. Idiopathic systemic capillary leak syndrome (Clarkson’s disease): the Mayo clinic experience. Mayo Clin Proc 2010;85(10):905–912. [DOI] [PMC free article] [PubMed] [Google Scholar]
- 2.Gousseff M, Arnaud L, Lambert M, et al. The systemic capillary leak syndrome: a case series of 28 patients from a European registry. Ann Intern Med 2011;154(7):464–471. [DOI] [PubMed] [Google Scholar]
- 3.Druey KM, Greipp PR. Narrative review: the systemic capillary leak syndrome. Ann Intern Med 2010;153(2):90–98. [DOI] [PMC free article] [PubMed] [Google Scholar]
- 4.Eo TS, Chun KJ, Hong SJ, et al. Clinical Presentation, Management, and Prognostic Factors of Idiopathic Systemic Capillary Leak Syndrome: A Systematic Review. J Allergy Clin Immunol Pract 2017(in press) [DOI] [PubMed]
- 5.Xie Z, Ghosh CC, Patel R, et al. Vascular endothelial hyperpermeability induces the clinical symptoms of Clarkson disease (the systemic capillary leak syndrome). Blood 2012;119(18):4321–4332. [DOI] [PMC free article] [PubMed] [Google Scholar]
- 6.Xie Z, Chan E, Yin Y, et al. Inflammatory Markers of the Systemic Capillary Leak Syndrome (Clarkson Disease). J Clin Cell Immunol 2014;5:1000213. [DOI] [PMC free article] [PubMed] [Google Scholar]
- 7.Larrayoz IM, Martinez-Herrero S, Garcia-Sanmartin J, Ochoa-Callejero L, Martinez A. Adrenomedullin and tumour microenvironment. J Transl Med 2014;12:339. [DOI] [PMC free article] [PubMed] [Google Scholar]
- 8.Kitamura K, Kangawa K, Kawamoto M, et al. Adrenomedullin: a novel hypotensive peptide isolated from human pheochromocytoma. Biochem Biophys Res Commun 1993;192(2):553–560. [DOI] [PubMed] [Google Scholar]
- 9.Druey KM, Parikh SM. Idiopathic systemic capillary leak syndrome (Clarkson disease). J Allergy Clin Immunol 2017;140(3):663–670. [DOI] [PMC free article] [PubMed] [Google Scholar]
- 10.Sek AC, Xie Z, Terai K, et al. Endothelial Expression of Endothelin Receptor A in the Systemic Capillary Leak Syndrome. PLoS One 2015;10(7):e0133266. [DOI] [PMC free article] [PubMed] [Google Scholar]
- 11.Dupuis J, Caron A, Ruel N. Biodistribution, plasma kinetics and quantification of single-pass pulmonary clearance of adrenomedullin. Clin Sci (Lond) 2005;109(1):97–102. [DOI] [PubMed] [Google Scholar]
- 12.Schuetz P, Marlowe RJ, Mueller B. The prognostic blood biomarker proadrenomedullin for outcome prediction in patients with chronic obstructive pulmonary disease (COPD): a qualitative clinical review. Clin Chem Lab Med 2015;53(4):521–539. [DOI] [PubMed] [Google Scholar]
- 13.Valenzuela-Sanchez F, Valenzuela-Mendez B, Rodriguez-Gutierrez JF, Estella-Garcia A, Gonzalez-Garcia MA. New role of biomarkers: mid-regional pro-adrenomedullin, the biomarker of organ failure. Ann Transl Med 2016;4(17):329. [DOI] [PMC free article] [PubMed] [Google Scholar]
- 14.Eto T, Kato J, Kitamura K. Regulation of production and secretion of adrenomedullin in the cardiovascular system. Regul Pept 2003;112(1–3):61–69. [DOI] [PubMed] [Google Scholar]
- 15.Koyama T, Sakurai T, Kamiyoshi A, Ichikawa-Shindo Y, Kawate H, Shindo T. Adrenomedullin-RAMP2 System in Vascular Endothelial Cells. J Atheroscler Thromb 2015;22(7):647–653. [DOI] [PubMed] [Google Scholar]
- 16.Kubo A, Minamino N, Isumi Y, Kangawa K, Dohi K, Matsuo H. Adrenomedullin production is correlated with differentiation in human leukemia cell lines and peripheral blood monocytes. FEBS Lett 1998;426(2):233–237. [DOI] [PubMed] [Google Scholar]
- 17.Garcia-Ponce A, Chanez Paredes S, Castro Ochoa KF, Schnoor M. Regulation of endothelial and epithelial barrier functions by peptide hormones of the adrenomedullin family. Tissue Barriers 2016;4(4):e1228439. [DOI] [PMC free article] [PubMed] [Google Scholar]
- 18.Kuwasako K, Kitamura K, Nagata S, Hikosaka T, Takei Y, Kato J. Shared and separate functions of the RAMP-based adrenomedullin receptors. Peptides 2011;32(7):1540–1550. [DOI] [PubMed] [Google Scholar]
- 19.Kato J, Kitamura K. Bench-to-bedside pharmacology of adrenomedullin. Eur J Pharmacol 2015;764:140–148. [DOI] [PubMed] [Google Scholar]
- 20.Fukumura D, Gohongi T, Kadambi A, et al. Predominant role of endothelial nitric oxide synthase in vascular endothelial growth factor-induced angiogenesis and vascular permeability. Proc Natl Acad Sci U S A 2001;98(5):2604–2609. [DOI] [PMC free article] [PubMed] [Google Scholar]
- 21.Garcia Ponce A, Citalan Madrid AF, Vargas Robles H, et al. Loss of cortactin causes endothelial barrier dysfunction via disturbed adrenomedullin secretion and actomyosin contractility. Sci Rep 2016;6:29003. [DOI] [PMC free article] [PubMed] [Google Scholar]
- 22.Mammoto T, Parikh SM, Mammoto A, et al. Angiopoietin-1 requires p190 RhoGAP to protect against vascular leakage in vivo. J Biol Chem 2007;282(33):23910–23918. [DOI] [PubMed] [Google Scholar]
- 23.Garayoa M, Martinez A, Lee S, et al. Hypoxia-inducible factor-1 (HIF-1) up-regulates adrenomedullin expression in human tumor cell lines during oxygen deprivation: a possible promotion mechanism of carcinogenesis. Mol Endocrinol 2000;14(6):848–862. [DOI] [PubMed] [Google Scholar]
- 24.Ishimitsu T, Ono H, Minami J, Matsuoka H. Pathophysiologic and therapeutic implications of adrenomedullin in cardiovascular disorders. Pharmacol Ther 2006;111(3):909–927. [DOI] [PubMed] [Google Scholar]
- 25.Cormier-Regard S, Nguyen SV, Claycomb WC. Adrenomedullin gene expression is developmentally regulated and induced by hypoxia in rat ventricular cardiac myocytes. J Biol Chem 1998;273(28):17787–17792. [DOI] [PubMed] [Google Scholar]
- 26.Cicardi M, Berti E, Caputo V, Radice F, Gardinali M, Agostoni A. Idiopathic capillary leak syndrome: evidence of CD8-positive lymphocytes surrounding damaged endothelial cells. J Allergy Clin Immunol 1997;99(3):417–419. [DOI] [PubMed] [Google Scholar]
- 27.Yuan M, Wang Q, Li C, et al. Adrenomedullin in Vascular Endothelial Injury and Combination Therapy: Time for a New Paradigm. Curr Vasc Pharmacol 2015;13(4):459–466. [DOI] [PubMed] [Google Scholar]
- 28.Imai A, Toriyama Y, Iesato Y, et al. Adrenomedullin Suppresses Vascular Endothelial Growth Factor-Induced Vascular Hyperpermeability and Inflammation in Retinopathy. Am J Pathol 2017;187(5):999–1015. [DOI] [PubMed] [Google Scholar]
- 29.Radeva MY, Waschke J. Mind the gap: mechanisms regulating the endothelial barrier. Acta Physiol (Oxf) 2017. (in press) [DOI] [PubMed]
- 30.Sivakumar PV, Garcia R, Waggie KS, Anderson-Haley M, Nelson A, Hughes SD. Comparison of vascular leak syndrome in mice treated with IL21 or IL2. Comp Med 2013;63(1):13–21. [PMC free article] [PubMed] [Google Scholar]
- 31.Clarkson B, Thompson D, Horwith M, Luckey EH. Cyclical edema and shock due to increased capillary permeability. Am J Med 1960;29:193–216. [DOI] [PubMed] [Google Scholar]
- 32.Lambert M, Launay D, Hachulla E, et al. High-dose intravenous immunoglobulins dramatically reverse systemic capillary leak syndrome. Crit Care Med 2008;36(7):2184–2187. [DOI] [PubMed] [Google Scholar]
- 33.Umbrello M, Gardinali M, Ottolina D, Zanforlin G, Iapichino G. Systemic capillary leak syndrome: is methylene blue the silver bullet? Case Rep Crit Care 2014;2014:141670. [DOI] [PMC free article] [PubMed] [Google Scholar]
- 34.von Haehling S, Filippatos GS, Papassotiriou J, et al. Mid-regional pro-adrenomedullin as a novel predictor of mortality in patients with chronic heart failure. Eur J Heart Fail 2010;12(5):484–491. [DOI] [PubMed] [Google Scholar]
- 35.Aslam M, Hartel FV, Arshad M, et al. cAMP/PKA antagonizes thrombin-induced inactivation of endothelial myosin light chain phosphatase: role of CPI-17. Cardiovasc Res 2010;87(2):375–384. [DOI] [PubMed] [Google Scholar]
Associated Data
This section collects any data citations, data availability statements, or supplementary materials included in this article.


