

Abstract
Adenosine monophosphate–activated protein kinase (AMPK) regulates multiple signaling pathways involved in glucose and lipid metabolism in response to changes in hormonal and nutrient status. Cell culture studies have shown that AMPK phosphorylation and inhibition of the rate‐limiting enzyme in the mevalonate pathway 3‐hydroxy‐3‐methylglutaryl (HMG) coenzyme A (CoA) reductase (HMGCR) at serine‐871 (Ser871; human HMGCR Ser872) suppresses cholesterol synthesis. In order to evaluate the role of AMPK‐HMGCR signaling in vivo, we generated mice with a Ser871‐alanine (Ala) knock‐in mutation (HMGCR KI). Cholesterol synthesis was significantly suppressed in wild‐type (WT) but not in HMGCR KI hepatocytes in response to AMPK activators. Liver cholesterol synthesis and cholesterol levels were significantly up‐regulated in HMGCR KI mice. When fed a high‐carbohydrate diet, HMGCR KI mice had enhanced triglyceride synthesis and liver steatosis, resulting in impaired glucose homeostasis. Conclusion: AMPK‐HMGCR signaling alone is sufficient to regulate both cholesterol and triglyceride synthesis under conditions of a high‐carbohydrate diet. Our findings highlight the tight coupling between the mevalonate and fatty acid synthesis pathways as well as revealing a role of AMPK in suppressing the deleterious effects of a high‐carbohydrate diet.
Short abstract
‐ AMPK phosphorylation and inhibition of the rate‐limiting enzyme in the mevalonate pathway – HMG‐CoA‐Reductase (HMGCR) at Ser871 suppresses cholesterol synthesis in vivo in mice.
‐ When fed a high‐carbohydrate diet, HMGCR Ser871Ala mutant mice had enhanced triglyceride synthesis and liver steatosis resulting in impaired glucose homeostasis.
‐These findings reveal a critical role of AMPK in suppressing the deleterious effects of a high‐carbohydrate diet.
Abbreviations
- Acaca
acetyl‐coenzyme A carboxylase alpha
- Acacb
acetyl‐coenzyme A carboxylase beta
- ACC
acetyl‐coenzyme A carboxylase
- AICAR
5‐aminoimidazole‐4‐carboxamide ribonucleotide
- Akt
protein kinase B
- Ala
alanine
- AMPK
adenosine monophosphate–activated protein kinase
- ATP
adenosine triphosphate
- AU
arbitrary unit
- CaMKK
calcium/calmodulin‐dependent protein kinase kinase
- CoA
coenzyme A
- EDL
extensor digitorum longus
- Fasn
fatty acid synthase
- GST
glutathione S‐transferase
- HET
heterozygous
- HGP
hepatic glucose production
- HMG
3‐hydroxy‐3‐methylglutaryl
- HMGCR
3‐hydroxy‐3‐methylglutaryl coenzyme A reductase
- HMGCS1
3‐hydroxy‐3‐methylglutaryl coenzyme A synthase 1
- IL
interleukin
- KI
knock‐in
- LDL
low‐density lipoprotein
- LXR
liver X receptor
- mRNA
messenger RNA
- NAFLD
nonalcoholic fatty liver disease
- PBS
phosphate‐buffered saline
- PCR
polymerase chain reaction
- RT‐PCR
real‐time polymerase chain reaction
- Ser871
serine‐871
- SREBF
sterol regulatory element binding transcription factor
- SREBP
sterol regulatory element binding protein
- TEV
tobacco etch virus
- Thr172
threonine‐172
- TLC
thin‐layer chromatography
- VLDL
very low‐density lipoprotein
- WT
wild‐type
The mevalonate pathway is essential for the synthesis of important nonsterol isoprenoids and bioactive sterols, such as cholesterol, that are involved in multiple aspects of cellular metabolism. It is also an essential precursor of bile acid, lipoproteins, steroid hormones, and vitamin D. 3‐hydroxy‐3‐methylglutaryl coenzyme A reductase (HMGCR) is a ubiquitously expressed endoplasmic reticulum‐localized enzyme that functions to convert 3‐hydroxy‐3‐methylglutaryl coenzyme A (HMG‐CoA) to mevalonate and is the rate‐limiting enzyme of the mevalonate pathway. Early studies demonstrated that genetic deletion of HMGCR in mice results in early embryonic lethality (between embryonic day 3 Similarly, recent studies have shown that liver‐specific HMGCR‐deficient mice develop severe liver function failure and die before 6 weeks, indicating that the mevalonate pathway is indispensable for development and essential for the survival of mice.2
HMGCR is subject to regulation at multiple levels that involve feedback control and cross‐regulation by distinct biochemical pathways.3, 4 For instance, abundant sterols suppress hmgcr gene transcription,5 and sterols and nonsterols derived from the mevalonate pathway synergistically suppress HMGCR protein synthesis by translational regulation.6 HMGCR is also exquisitely regulated at the level of protein stability, where HMGCR degradation is accelerated in cells in the presence of sterols or mevalonate.7, 8, 9
Early in vitro studies demonstrated that HMGCR activity can also be regulated by adenosine monophosphate–activated protein kinase (AMPK).10 In fact, regulation of HMGCR by reversible phosphorylation was reported by multiple laboratories in the 1970s,11, 12 but at that time the identity of the associated reductase‐inactivating kinase was not known; it was not until 1987 that the term AMPK was adopted.13 AMPK is a key regulator of whole‐body energy metabolism, including lipid metabolism, protein synthesis, glucose uptake, and mitochondrial biogenesis.10, 14 AMPK is present in all tissues as a heterotrimeric complex composed of a catalytic α subunit (α1, α2), a scaffolding β subunit (β1, β2), and a nucleotide‐binding γ subunit (γ1, γ2, γ3) and is typically inactive unless phosphorylated on threonine‐172 (Thr172) in the α subunit activation loop by upstream kinases (liver kinase B1, calcium/calmodulin‐dependent protein kinase kinase‐2 [CaMKK2]).10, 14 AMPK is activated by metabolic stresses15, 16, 17 or hormonal changes that signal low‐energy conditions (muscle contraction, ischemia, starvation) and acts to inhibit anabolic adenosine triphosphate (ATP)‐consuming pathways and promote catabolic ATP‐generating pathways.10
AMPK was shown to inactivate HMGCR by phosphorylating serine‐871 (Ser871) in vitro 18 and in cell lines19; however, both wild‐type (WT) and Ser871 alanine (Ala) HMGCR mutants were equally sensitive to end‐product feedback control, making it unclear how important AMPK‐HMGCR signaling is in the context of the whole animal beyond conditions of severe metabolic stress. To determine the physiologic importance of Ser871 phosphorylation, we generated HMGCR Ser871Ala knock‐in (KI) mice by homologous recombination. We show that inhibition of Ser871 phosphorylation leads to increased cholesterol synthesis and cholesterol accumulation in the liver and, surprisingly, an elevated capacity for triglyceride synthesis. Furthermore, Ser871Ala HMGCR mutant mice fed a high‐carbohydrate diet develop hepatic steatosis and show reduced insulin sensitivity with reduced insulin‐induced suppression of hepatic glucose output.
Materials and Methods
Animals
All animal care and experiments were approved by St. Vincent’s Hospital (Melbourne, Australia) Animal Ethics Committee and the University of Ottawa Animal Care Committee (Ottawa, Canada) and were carried out in accordance with the approved guidelines. HMGCR KI mice were generated and genotyped as described in the Supporting Experimental Procedures. Male mice on a C57BL/6 background were used for all experiments. Mice were housed under a controlled temperature of 22°C and a 12‐hour light cycle (lights on from 7 am to 7 pm) with ad libitum access to water and a standard chow diet (6% fat, 29% starch; #102108, Barastoc; Ridley Agriproducts) or fed a high‐carbohydrate diet (7% fat, 60% dextrose; #SF03‐023; Specialty Feeds, Glen Forrest, Australia) for 10 weeks starting from 8 to 10 weeks of age.
In Vivo Hepatic Cholesterol Synthesis
For in vivo cholesterol and triglyceride synthesis assays, liver was isolated from mice 1 hour after intraperitoneal injection with 10 mCi of [3H] H2O (Perkin Elmer) in 0.2 mL of phosphate‐buffered saline (PBS). In parallel, trunk blood was also collected, and the [3H] H2O activity in the plasma was measured. For triglyceride detection, the lipid fraction was extracted by homogenizing the liver in chloroform:methanol (2:1). Lipids were separated by thin‐layer chromatography (TLC) (hexane:diethyl ether:glacial acetic acid, 80:20:1). For cholesterol measurements, the liver was saponified before lipid extraction and TLC. The tracer incorporated into the triglyceride or cholesterol fraction was measured by liquid scintillation counting, and synthesis rates were calculated as nmol of 3H‐labeled water incorporated into cholesterol per milligram of protein per hour as described.20
Ex Vivo Lipogenesis Assay
Primary hepatocytes were isolated by collagenase perfusion.21 Lipogenesis was determined by measuring the incorporation of [3H]acetate as described.22 Briefly, cells were cultured for 2 hours in serum‐free M199 before pretreatment for 1 hour with 10 μM A769662 or 0.5 mM 5‐aminoimidazole‐4‐carboxamide ribonucleotide (AICAR), followed by incubation with [3H]acetate (5 μCi/mL) and 0.5 mM sodium acetate for 4 hours in the continued presence of A769662 or AICAR. Medium was then removed and cells washed with PBS before lipid extraction for determination of incorporation into lipid fractions as described above.
Western Blotting
Mouse tissues (liver and muscle) were dissected and immediately frozen in liquid nitrogen. Tissues were mechanically homogenized in ice‐cold radio immunoprecipitation assay lysis buffer, and protein was resolved by sodium dodecyl sulfate–polyacrylamide gel electrophoresis and immunoblotted with antibodies against phosphorylated Ser473‐protein kinase B (Akt; #4058), Akt (#9272), phosphorylated Thr172 AMPK (#2535), AMPK pan‐α (#5831), and pan‐actin (#4968) (all antibodies from Cell Signaling Technologies) and HMGCR antibody (#ABS229; Merck Millipore). Proteins were detected using the enhanced chemiluminescence method after incubation with horseradish peroxidase‐conjugated rabbit antibodies (Dako) as described.22 Immunolabeled bands were quantified by densitometry using ImageJ software.
Quantitative Real‐Time Polymerase Chain Reaction
Tissues were dissected and immediately frozen in liquid nitrogen. RNA was extracted using Trizol Reagent (Sigma) and isolated according to the manufacturer’s instructions. Complementary DNA was generated using the Thermoscript real‐time polymerase chain reaction (RT‐PCR) system (Life Technologies) and analyzed by means of quantitative RT‐PCR on a Rotorgene 3000 (Corbett Research) using Assay‐on‐Demand gene expression assays (Life Technologies) according to the manufacturer’s recommendations. Assays were normalized using 18S ribosomal RNA or ribosomal protein L32, and expression levels were calculated using the comparative critical threshold method as described.22 A list of the TaqMan Gene Expression Assays used in this study is shown in Supporting Table S2.
Muscle Glucose Uptake Assay
Muscle 2‐deoxy‐D‐glucose uptake was measured as described.23 Briefly, extensor digitorum longus (EDL) and soleus muscles were isolated from anesthetized mice and transferred into flasks containing essential buffer (Krebs‐Henseleit buffer, pH 7.4, supplemented with 2 mM pyruvate, 8 mM mannitol, and 0.1% bovine serum albumin), gassed with 95% O2/5% O2 at 30°C for 10 minutes, followed by incubation in essential buffer containing 400 μU/mL insulin (Actrapid, Novo Nordisk). 2‐deoxy‐D‐glucose uptake was measured over the following 20 minutes in a similar buffer supplemented with 0.5 μCi/mL of 2‐[2,6H3] deoxy‐D‐glucose, 0.2 μCi/mL [1‐14C] mannitol, and 1 mM 2‐deoxy‐D‐glucose. Muscles were removed, washed with PBS, and homogenized in cell lysis buffer as described.23 The homogenate was clarified by centrifugation, and radioactivity of the supernatant was determined by liquid scintillation counting.
Hyperinsulinemic‐Euglycemic Clamp
Hyperinsulinemic‐euglycemic clamps were performed as described.24 Briefly, a catheter was surgically placed into the right jugular vein, and mice were allowed to recover for 5 days. All mice regained their presurgical weights following surgery. The catheter was made accessible through an adaptor port implanted on the dorsal subscapular region. On the day of the clamp, mice were fasted for 5 hours and then infused with D‐[3‐3H]‐glucose for 1 hour to evaluate basal glucose disposal. A human insulin (10 mU/kg/minute) infusate containing D‐[3‐3H]‐glucose was then infused, and blood glucose levels were titrated with 50% dextrose to achieve and maintain euglycemia. Mice were not physically restrained but free to move around the top of the cage. Basal and clamped rates of glucose disposal and hepatic glucose production (HGP) were calculated as stated.24 All tissues were rapidly dissected, snap frozen in liquid nitrogen, and stored at −80°C for later analyses.
Oil Red O and Liver Histology
Frozen livers sections (6 µm) were cut on a cryostat, mounted on slides, fixed for 30 minutes in 4% paraformaldehyde, and processed for Oil Red O staining as described.25 To quantify lipid infiltration in the liver, Oil Red O‐stained sections were assessed on a gray scale for stained pixels within a defined frame using a light microscope (Leica, Heerbrugg, Switzerland) at magnification ×200 and quantified using ImageJ software. For liver histology, livers were collected, fixed in 10% formalin, and processed for hematoxylin and eosin, trichome collagen staining, and F4/80 macrophage immunohistochemistry as described.26
Metabolic Measurements and Serum Assays
Weekly body weight was determined from 8 weeks of age onward unless otherwise stated. Food intake was examined in chow‐ and high‐carbohydrate‐fed mice as described.25 Mice were killed by cervical dislocation, and tissues, including liver and white adipose tissue, were weighed and stored for subsequent assays. Trunk blood was collected and centrifuged, and serum was obtained for further analysis. Hepatic and serum cholesterol (total, free, and cholesteryl ester; Abcam), serum very low‐density lipoprotein/low‐density lipoprotein (VLDL/LDL) cholesterol, high‐density lipoprotein (HDL) cholesterol (Abcam), serum nonesterified fatty acid (NEFA), and serum triglyceride (Wako Diagnostics) were measured with commercially available colorimetric kits in accordance with the manufacturers’ specifications.
Glucose and Insulin Tolerance Tests
Fed and fasted blood glucose levels were measured using an Accu‐Chek Go glucometer. Glucose and insulin tolerance tests were performed on 6‐hour‐fasted or 4‐hour‐fasted mice that were administered intraperitoneally with glucose (1 mg/g body weight) or insulin (0.5 mU/g body weight), respectively. Blood glucose levels were assessed at 0, 15, 30, 60, and 90 minutes after glucose administration using an Accu‐Chek Go glucometer (Roche) as described.27
Statistical Analyses
All data are expressed as means ± SEM. A 2‐tailed Student t test was used to test differences between two groups of mice. Differences among groups of mice were assessed by 2‐way analysis of variance (ANOVA) or repeated‐measures ANOVA. Bonferroni post hoc test was performed to identify differences among means. Statistical analyses were assessed using Prism software (GraphPad Software, Inc., La Jolla, CA).
Results
Generation of HMGCR Ser871Ala KI Mice
The generation of HMGCR Ser871Ala KI mice is described in the Supporting Methods, and a schematic of the targeting construct is shown in Supporting Fig. S1. WT and HMGCR KI mice were genotyped using a PCR‐based approach. The recombinant product (886 base pairs [bps]) was only detected in genomic DNA samples isolated from HMGCR KI mice (Fig. 1A). To confirm that the Ser871Ala KI mutation in HMGCR blocks phosphorylation by AMPK and consequently renders it insensitive to inhibition by AMPK, WT and Ser871Ala KI glutathione S‐transferase (GST)‐tobacco etch virus protease site (TEV)‐HMGCR (485‐887) proteins were incubated in the presence of Mg2+/ATP for 10 minutes, with or without CaMKK2‐activated bacterially expressed AMPK. The phosphorylation status was then measured by means of time‐of‐flight–mass spectrometry analysis (Fig. 1B). Incubation with bacterially expressed AMPK in the presence of ATP resulted in an observed mass of 74,547 Da (theoretical mass of WT protein 74,465 Da), indicating a stoichiometric shift in the mass peak of 80 Da, equivalent to the mass of a phosphate group. More importantly, this shift was not observed in the Ser871Ala KI GST‐TEV‐HMGCR (485‐887)‐EEF proteins (Fig. 1B). We next assessed HMGCR catalytic activity and validated whether the lack of phosphorylation by AMPK results in its inability to suppress HMGCR activity. Consistently, coincubation with AMPK did not inhibit the reductase activity of Ser871Ala KI GST‐TEV‐HMGCR (485‐887)‐EEF (Fig. 1C), whereas the activity of the WT enzyme was significantly reduced by approximately 75%. Taken together, these results show that the HMGCR Ser871Ala KI mutation rendered the enzyme insensitive to phosphorylation and inhibition by AMPK and confirm that Ser871 is the sole AMPK phosphorylation site in the HMGCR catalytic domain.
Figure 1.
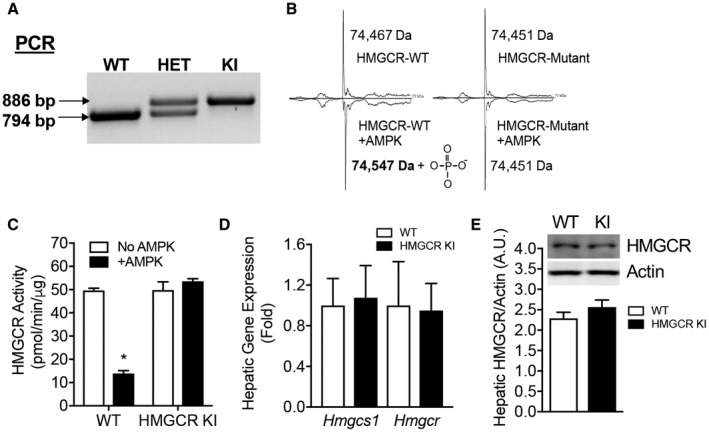
The Ser871Ala mutation renders HMGCR insensitive to AMPK phosphorylation and inhibition. (A) Genotyping using PCR for determining WT, HET, and homozygous HMGCR KI mice. (B,C) The catalytic domains of WT and Ser871Ala KI mouse HMGCR were expressed as GST‐fusion proteins and incubated with or without bacterial‐expressed CaMKK‐activated AMPK before (B) mass spectrometry analysis or (C) assay for HMGCR activity using a radioisotope‐based 14C‐HMG CoA reduction assay. Results are means ± SEM, n = 3 per group (*P < 0.05, when comparing no AMPK versus +AMPK). (D) Relative Hmgcs1 and Hmgcr mRNA expression determined in the liver by quantitative RT‐PCR using Rpl32 as a housekeeping gene. Results are means ± SEM, n = 12 WT, n = 11 HMGCR KI. (E) Liver from WT and HMGCR KI mice were subjected to immunoblotting using antibodies against HMGCR and actin and quantified using ImageJ software. Results are means ± SEM, n = 3 per genotype. Abbreviations: HET, heterozygous; Rpl32, ribosomal protein L32.
HMGCR KI mice were viable and displayed no visible developmental defects. Breeding of female heterozygous (HET) HMGCR KI mice with male HET HMGCR KI mice or vice versa resulted in live offspring with a genotype frequency not different from the expected Mendelian ratio (Supporting Table S1); nor was there a significant difference between WT and HMGCR KI mice in terms of litter size, litter intervals, or sex ratio of pups (Supporting Table S1), indicating that the Ser871Ala mutation in HMGCR does not impact reproductive fitness. Moreover, the HMGCR Ser871Ala point mutation in mice did not lead to any significant changes in the hepatic messenger RNA (mRNA) expression of HMG‐CoA synthase‐1 (Hmgcs1) and Hmgcr (Fig. 1D) or protein levels of HMGCR (Fig. 1E).
Reduced Cholesterol‐Lowering Effects of AMPK Activation in HMGCR Ser871Ala KI Hepatocytes
To determine the physiologic significance of HMGCR regulation by AMPK in cholesterol metabolism, we first determined the capacity for cholesterol synthesis in primary hepatocytes isolated from WT and HMGCR KI mice. We found that basal rates of synthesis were not different between the genotypes; however, HMGCR KI hepatocytes compared to WT hepatocytes had reduced sensitivity to the cholesterol‐lowering effects of the AMPK activators A769662 and AICAR (Fig. 2A).
Figure 2.
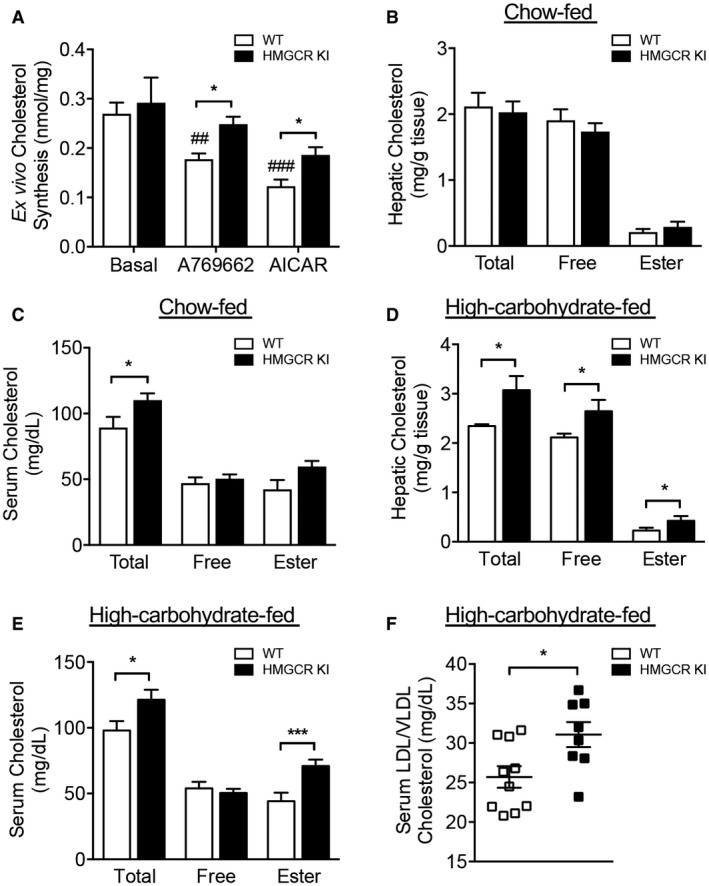
Elevated serum and hepatic cholesterol levels in high‐carbohydrate‐fed HMGCR KI mice. (A) Cholesterol synthesis in WT and HMGCR KI hepatocytes in response to AMPK activators A769662 and AICAR. Results are means ± SEM, n = 3 independent experiments (each experiment contains at least three replicates; *P < 0.05, when comparing WT versus HMGCR KI; ## P < 0.01, ### P < 0.001, when comparing between different treatments). Liver and serum samples were collected from (B,C) chow‐fed WT and HMGCR KI mice or (D,E) high‐carbohydrate‐fed WT and HMGCR KI mice. Cholesterol levels, including total cholesterol, free cholesterol, and cholesteryl ester, were measured. (F) Serum LDL/VLDL cholesterol from high‐carbohydrate‐fed WT and HMGCR KI mice. (B‐F) Results are means ± SEM, n = 7‐10 per genotype (*P < 0.05, ***P < 0.001, when comparing WT versus HMGCR KI).
We subsequently measured a number of metabolic parameters in WT and HMGCR KI mice and found there were no differences in body weight, liver weight, and adiposity when mice were fed a standard chow diet (Supporting Fig. S2A‐C). Consistent with similar cholesterol synthesis under basal conditions in primary hepatocytes, liver cholesterol content was also not different between WT and HMGCR KI mice; however, serum total cholesterol levels were modestly elevated in HMGCR KI mice (Fig. 2B,C). Overall, these results indicate that the absence of AMPK‐HMGCR signaling does not lead to overt perturbations of cholesterol metabolism under chow‐fed conditions.
Enhanced Cholesterol Synthesis in HMGCR Ser871Ala KI Mice Fed a High‐Carbohydrate Diet
The lack of a phenotype in HMGCR KI mice in the basal conditions may reflect that Ser871 phosphorylation is either redundant for controlling HMGCR activity or is sufficiently important that its function is backed up by other mechanisms, such as regulation at the translational and transcriptional level. To test whether the effect of the HMGCR Ser871Ala mutation may be more evident under a condition where the mevalonate pathway is activated, we fed WT and HMGCR KI mice a lipogenic high‐carbohydrate diet (60% dextrose) for 10 weeks. The primary purpose of feeding mice a lipogenic high‐carbohydrate diet is to increase the flux through lipid synthesis, including cholesterol synthesis in the liver, by increasing the supply of the precursor acetyl‐CoA in these pathways. We confirmed that high‐carbohydrate feeding increased rates of hepatic triglyceride and cholesterol synthesis when compared to chow‐fed conditions (Supporting Fig. S3A,B). Interestingly, we found that 10 weeks of high‐carbohydrate feeding was accompanied by a modest increase in AMPK Thr172 phosphorylation in the liver in both WT and HMGCR KI mice, suggesting increased AMPK activity (Supporting Fig. S3C). This appeared to be due to increased AMPK protein abundance as measured by western blot of the AMPK α subunit (Supporting Fig. S3C‐E). These data suggest that a high‐carbohydrate diet may further exacerbate the phenotype difference between WT and HMGCR KI mice as the increased AMPK activity under these conditions is unable to effectively inhibit HMGCR activity and cholesterol synthesis in KI livers. Consistent with this, HMGCR KI mice showed significant increases in hepatic and serum total and free cholesterol as well as cholesteryl esters, the main cholesterol form stored within the cell or exported into the blood stream (Fig. 2D,E). Serum concentrations of LDL/VLDL cholesterol were increased in HMGCR KI mice (Fig. 2F), whereas serum HDL cholesterol levels were comparable between genotypes (Supporting Fig. S4A), suggesting that the hypercholesterolemia in HMGCR KI mice was due to secretion of cholesterol‐rich lipoproteins rather than differences in cholesterol reuptake.
Given that the liver is the main site of cholesterol production, we assessed hepatic cholesterol synthesis in WT and HMGCR KI mice in vivo. We found that HMGCR KI mice exhibited significantly enhanced rates of cholesterol synthesis (Fig. 3A,B), whereas cholesterol efflux remained comparable between genotypes (Supporting Fig. S4B). Consistent with this, cholesterogenic genes downstream of Hmgcr, including farnesyl diphosphate synthase (Fdps), squalene epoxidase (Sqle), and 7‐dehydrocholesterol reductase (Dhcr7), were markedly elevated by approximately 2‐fold to 3‐fold in HMGCR KI livers compared to WT littermates (Fig. 3C) despite the absence of changes in the mRNA expression of the upstream activator sterol regulatory element binding transcription factor 2 (Srebf2) (Supporting Fig. S4C). These results indicate that the typical negative feedback from elevated cellular cholesterol levels may be disrupted in HMGCR KI livers, leading to inappropriately activated sterol regulatory element binding protein 2 (SREBP2) transcriptional activity. Collectively, these results show that HMGCR Ser871 phosphorylation controls cholesterol synthesis under conditions where the flux through the mevalonate pathway is enhanced.
Figure 3.
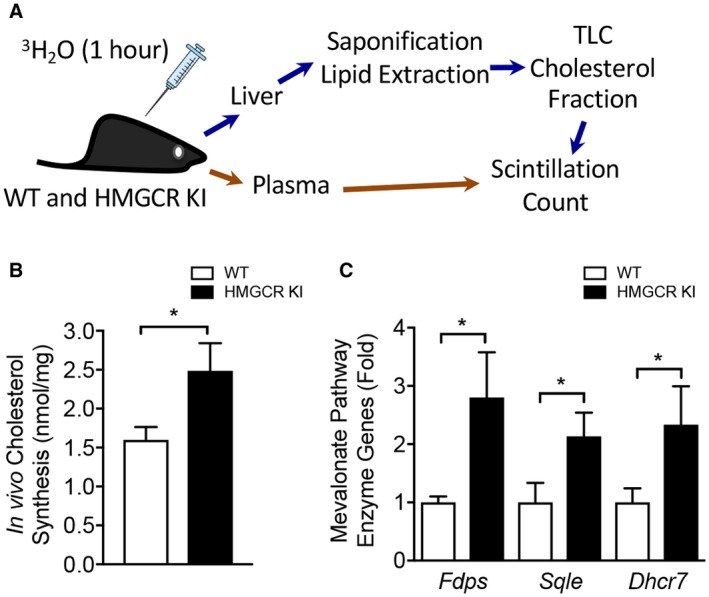
Enhanced hepatic cholesterol synthesis in vivo in HMGCR KI mice. (A) Rates of cholesterol synthesis in the liver were measured in WT and HMGCR KI mice fed a high‐carbohydrate diet for 10 weeks. Mice were injected with 3H2O, and livers and plasma were collected 1 hour later. Livers were saponified, sterol‐containing lipid was extracted, and the incorporated tracer was measured by scintillation counting. (B) In vivo hepatic cholesterol synthesis in livers from high‐carbohydrate‐fed WT and HMGCR KI mice. (C) Quantitative RT‐PCR was performed to measure expression of genes for cholesterol synthesis pathway enzymes, including Fdps, Sqle, and Dhcr7, from the livers of high‐carbohydrate‐fed WT and HMGCR KI mice. (B,C) Results are means ± SEM, n = 6‐8 per genotype (*P < 0.05, when comparing WT versus HMGCR KI). Abbreviations: Dhcr7, 7‐dehydrocholesterol reductase; Fdps, farnesyl diphosphate synthase; Sqle, squalene epoxidase.
Inhibition of AMPK‐HMGCR Signaling Leads to Liver Steatosis
We measured body weight and fat mass to determine whether lipogenic diet‐challenged HMGCR KI mice displayed any differences in body composition. Body weights were similar during the early stages, but after 10 weeks of high‐carbohydrate feeding, HMGCR KI mice were modestly but significantly heavier than WT mice (Fig. 4A). However, when normalized to initial body weight, the incremental body weights were comparable between WT and HMGCR KI mice (Fig. 4B). Epididymal fat mass was increased in HMGCR KI mice and remained significantly higher when normalized to body weight (Fig. 4C,D), suggesting that the differences in body weight gained were associated with an increase in adiposity. We next investigated hepatic lipid profile in our high‐carbohydrate‐fed HMGCR KI mice. Although liver weights from WT and HMGCR KI mice were comparable (Fig. 5A), the liver of HMGCR KI mice showed significantly elevated hepatic lipid accumulation as determined by Oil Red O staining (Fig. 5B). Consistent with this, liver and serum triglyceride contents were significantly increased in HMGCR KI mice (Fig. 5C,D). In addition, HMGCR KI mice also developed mild liver fibrosis when assessed by Masson’s trichrome staining (Fig. 5E). Furthermore, the liver of HMGCR KI mice showed elevated macrophage infiltration and hepatic inflammation as determined by F4/80 immunohistochemistry accompanied by enhanced hepatic proinflammatory cytokines Il6 mRNA expression, with no difference in Il1b and tumor necrosis factor α (Fig. 5F). To investigate whether the increased lipid levels in HMGCR KI liver were a consequence of an increased capacity for de novo triglyceride synthesis, we incubated WT and HMGCR KI hepatocytes with 3H‐labeled acetate and measured radioactivity of the total triglyceride fraction. We found that HMGCR KI hepatocytes showed increased rates of triglyceride synthesis and reduced responses to the lipid‐lowering effect of the AMPK activators A769662 and AICAR (Fig. 6A). Nevertheless, both A769662 and AICAR reduced triglyceride synthesis in HMGCR KI cells compared to the basal level, indicating another AMPK regulatory step in the triglyceride synthesis pathway besides HMGCR, such as the well‐known inhibition of acetyl‐CoA carboxylase (ACC) activity by AMPK. The increased lipid synthesis in HMGCR KI cells may have been provided by elevated expression of lipogenic genes because the mRNA expression of key enzymes in lipid synthesis, such as ACC‐alpha (Acaca), ACC‐beta (Acacb), and fatty acid synthase (Fasn), was significantly up‐regulated without significant changes (albeit a trend) in the expression of the upstream transcriptional regulator Srebf1 (Fig. 6B,C). These results indicate that the increased intracellular cholesterol levels in HMGCR KI mice lead to a concomitant induction of de novo fatty acid synthesis, as reported.28
Figure 4.
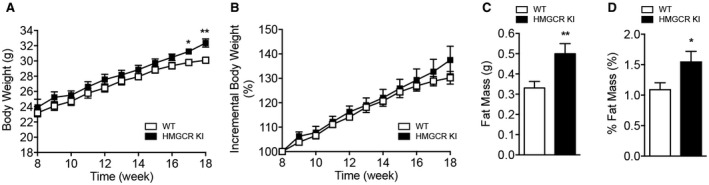
Increased adiposity in high‐carbohydrate‐fed HMGCR KI mice. WT and HMGCR KI mice were fed a high‐carbohydrate diet for 10 weeks. (A,B) Absolute and incremental weekly body weights of WT and HMGCR KI mice. (C,D) Absolute and normalized epididymal fat mass in WT and HMGCR KI mice. Results are means ± SEM, n = 7‐10 per genotype (*P < 0.05, **P < 0.01, when comparing WT versus HMGCR KI).
Figure 5.
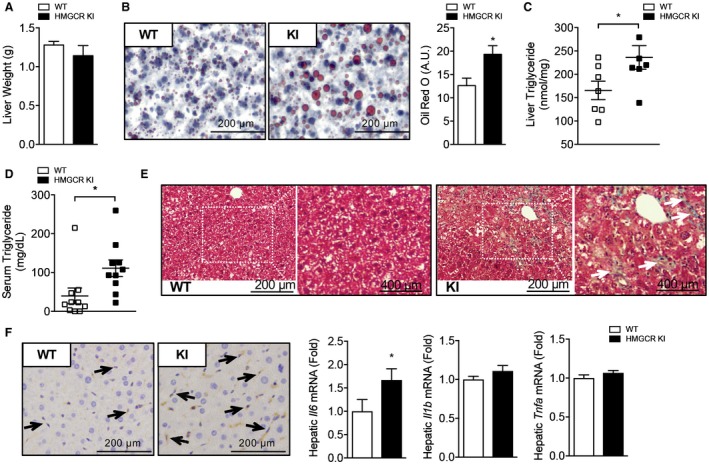
Increased adiposity and hepatic lipid accumulation in high‐carbohydrate‐fed HMGCR KI mice. WT and HMGCR KI mice were fed a high‐carbohydrate diet for 10 weeks. (A) Liver weights of WT and HMGCR KI mice. (B) Oil Red O stain of liver tissue from high‐carbohydrate‐fed WT and HMGCR KI mice. (C,D) Hepatic and serum triglyceride levels in WT and HMGCR KI mice. (E) Masson’s trichrome stain of liver tissue from high‐carbohydrate‐fed WT and HMGCR KI mice. (F) F4/80 immunohistochemistry of liver tissue from high‐carbohydrate‐fed WT and HMGCR KI mice. Relative hepatic Il6, Il1b, and Tnfa mRNA expression determined in the liver by quantitative RT‐PCR. Results are means ± SEM, n = 6‐10 per genotype (*P < 0.05, when comparing WT versus HMGCR KI). Abbreviation: Tnfa, tumor necrosis factor alpha.
Figure 6.
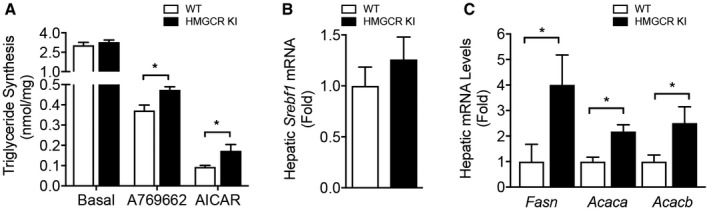
Enhanced capacity for de novo triglyceride synthesis in HMGCR KI liver. (A) Triglyceride synthesis in WT and HMGCR KI primary hepatocytes in response to AMPK activators A769662 and AICAR. Results are means ± SEM, n = 3 independent experiments (each experiment contains at least three replicates; *P < 0.05, when comparing WT versus HMGCR KI). (B,C) mRNA expression of lipogenic genes, including Srebf1, Fasn, Acaca, and Acacb, from livers of high‐carbohydrate‐fed WT and HMGCR KI mice. Results are means ± SEM, n = 7‐10 per genotype (*P < 0.05, when comparing WT versus HMGCR KI).
Impaired Glucose Homeostasis in High‐Carbohydrate‐Fed HMGCR Ser871Ala KI Mice
The storage and accumulation of excessive lipid in insulin‐responsive tissues, particularly in the liver, is strongly linked to impaired glucose homeostasis and the development of insulin resistance.29 We first aimed to test the effect of the HMGCR Ser871Ala mutation on the overall regulation of glucose homeostasis. Fed and fasted blood glucose levels were indistinguishable between chow‐fed WT and HMGCR KI mice (Supporting Fig. S5A). In contrast, high‐carbohydrate‐fed HMGCR KI mice were hyperglycemic in the fasting state compared to WT mice (Fig. 7A). In line with the higher fasting blood glucose levels, whole‐body glucose clearance and insulin responsiveness as evaluated by glucose and insulin tolerance tests, respectively, were significantly impaired in HMGCR KI mice (Fig. 7B,C). These impairments in glucose tolerance and insulin sensitivity were not observed between the two genotypes when fed a standard chow diet (Supporting Fig. S5B,C).
Figure 7.
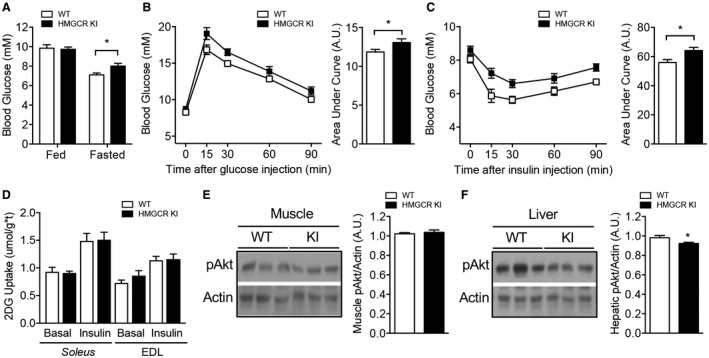
Impaired glucose homeostasis in high‐carbohydrate‐fed HMGCR KI mice. WT and HMGCR KI mice were fed a high‐carbohydrate diet for 10 weeks. (A) Ad libitum fed and overnight‐fasted blood glucose levels from WT and HMGCR KI mice. (B) WT and HMGCR KI mice were fasted for 6 hours and injected intraperitoneally with 1 mg/g of glucose. Blood glucose was measured, and the area under the curve was calculated. (C) WT and HMGCR KI mice were fasted for 4 hours and injected intraperitoneally with 0.5 mU/g of insulin; blood glucose was measured, and the area under the curve was calculated. (D) Soleus and EDL muscles were isolated from WT and HMGCR KI mice, and 2‐deoxy‐D‐glucose uptake was assessed under basal conditions and in response to insulin. (E,F) Liver and muscle from high‐carbohydrate‐fed WT and HMGCR KI mice were isolated and processed for immunoblotting using antibodies specific for phosphorylated Akt (Ser473) and actin. Results are means ± SEM; (A‐C,E,F) n = 7‐10 per genotype, (D) n = 5‐6 per genotype (*P < 0.05, when comparing WT versus HMGCR KI). Abbreviations: 2DG, 2‐deoxy‐D‐glucose; pAkt, phosphorylated Akt.
Studies have shown that excess plasma membrane cholesterol in skeletal muscle may lead to impaired glucose uptake and represent an early event in the development of skeletal muscle insulin resistance.30, 31 To determine whether inhibition of AMPK‐HMGCR signaling contributes to impaired skeletal muscle glucose homeostasis, we measured insulin signaling and ex vivo glucose uptake in muscle from WT and HMGCR KI mice. No differences were evident in 2‐deoxy‐D‐glucose uptake into WT versus HMGCR KI soleus and EDL muscle under basal conditions or in response to insulin (Fig. 7D). In line with this, no differences in Akt phosphorylation were noted in muscle from WT and HMGCR KI mice as assessed by immunoblot analysis using antibodies specific for the Akt Ser473 phosphorylation site (Fig. 7E), suggesting that altered muscle insulin signaling is unlikely to contribute to the impaired glucose homeostasis in HMGCR KI mice. In contrast, hepatic Akt phosphorylation was slightly but significantly reduced in HMGCR KI mice (Fig. 7F), suggesting that the elevated fasting glucose levels were a consequence of impaired hepatic glucose homeostasis. We investigated this possibility further in hyperinsulinemic‐euglycemic clamp experiments. In the basal state, HMGCR KI mice exhibited enhanced fasted (6 hours) blood glucose with comparable glucose levels in the clamped state (Fig. 8A; Supporting Fig. S6A). The glucose infusion rate (GIR) (Fig. 8B; Supporting Fig. S6B) and the glucose disappearance rate (Fig. 8C), which primarily reflects skeletal muscle glucose disposal, were similar between the genotypes. In addition, there were no differences in Akt phosphorylation in white adipose tissue or serum NEFA levels (Supporting Fig. S6C,D). These results suggest that insulin sensitivity in muscle and white adipose tissue was not affected. However, HGP was significantly higher in HMGCR KI mice in the clamped state (Fig. 8D), and the percentage suppression of HGP by insulin during the clamp was reduced in HMGCR KI compared to WT mice (Fig. 8E). In support of this, the transcript expression of the gluconeogenic genes glucose 6‐phosphatase (G6pc) and phosphoenolpyruvate carboxykinase 1 (Pck1) was significantly higher in the HMGCR KI livers at the completion of the clamp, which is entirely consistent with a lack of suppression of HGP (Fig. 8F). Taken together, these results indicate that HMGCR KI mice have increased liver lipid deposition, liver insulin resistance, and enhanced HGP, contributing to impaired whole‐body glucose homeostasis.
Figure 8.
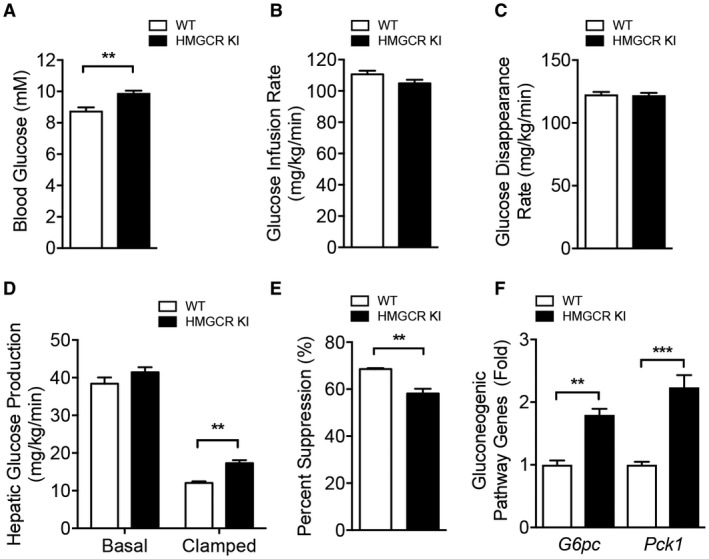
Increased HGP in high‐carbohydrate‐fed HMGCR KI mice. (A‐F) Hyperinsulinemic‐euglycemic clamp studies in high‐carbohydrate‐fed WT and HMGCR KI mice. (A) Blood glucose levels, (B) glucose infusion rate, and (C) whole‐body glucose disappearance rate during the clamp. (D,E) Hepatic glucose output during basal and insulin‐stimulated conditions and expressed as percent suppression. (F) Quantitative RT‐PCR was performed to measure expression of genes for gluconeogenic genes, including Pck1 and G6pc, from the livers of high‐carbohydrate‐fed WT and HMGCR KI mice after the clamp. Results are means ± SEM, n = 4 per genotype (**P < 0.01, ***P < 0.001, when comparing WT versus HMGCR KI). Abbreviations: G6pc, glucose 6‐phosphatase; Pck1, phosphoenolpyruvate carboxykinase 1.
Discussion
Although HMGCR was the second AMPK substrate identified more than 40 years ago and is universally cited as an example of AMPK’s role in regulating cholesterol metabolism, evidence supporting this has largely been confined to in vitro cell‐based experiments.19 Importantly, in vitro evidence that both WT and HMGCR Ser871Ala mutant were equally regulated by sterol feedback control indicated that the phosphorylation of HMGCR is only important during metabolic stress, a common theme in AMPK signaling. However, an important unanswered question is what role AMPK‐HMGCR signaling plays under normal homeostatic conditions and in the presence of nutrient‐saturated diets that are common in many countries and known to be an important contributing factor to the development of obesity and type 2 diabetes. To answer this question, we generated a mouse model with a KI point mutation that results in the substitution of HMGCR Ser871 with Ala (HMGCR KI) in order to directly assess the importance of AMPK phosphorylation of HMGCR without altering AMPK’s numerous other functions, which could affect liver metabolism, including the inhibition of SREBP32 or ACC.24 Mice with the HMGCR Ser871Ala mutation were viable, bred normally according to Mendelian ratios, and had similar tissue weights as WT littermate controls. A detailed histologic examination of various organs in these mice revealed no morphologic defects or pathologies (data not shown). We confirmed that the Ser871Ala mutation rendered HMGCR insensitive to inhibition by AMPK activators in primary hepatocytes.
There were no metabolic or phenotypic differences between WT and HMGCR Ser871Ala KI mice under chow‐fed conditions apart from a modest increase in total serum cholesterol. However, metabolic differences emerged when the mice were challenged with metabolic stress induced by a high‐carbohydrate diet and increased flux through the mevalonate pathway, leading to increases in liver and serum cholesterol levels due to enhanced rates of cholesterol synthesis. Importantly, these increased rates of cholesterol synthesis also led to elevations in liver and serum triglycerides and early signs of liver fibrosis and inflammation. Although the precise cause of nonalcoholic fatty liver disease (NAFLD) remains unclear, the incidence of NAFLD under conditions of normal caloric intake seems to be specifically linked to disruptions in liver cholesterol metabolism.33, 34, 35, 36, 37 In support of this, studies in humans and animal models have shown that fatty liver can be established by a hypercholesterolemic diet containing normal calorie levels.33, 34, 35, 36, 37 This suggests that increased levels of cholesterol may enhance lipid accumulation in the liver. Mechanistically, cholesterol overload is associated with increased accumulation of oxysterols, cholesterol metabolites that act as agonists for liver X receptor α (LXRα), which is up‐regulated in patients with NAFLD.38 LXRα in turn activates the transcription factor SREBP1c and results in increased expression of genes involved in fatty acid synthesis.38 This was supported by studies showing that LXRα antagonism attenuates high‐fat diet‐induced NAFLD in mice.39 It is therefore possible that the increased cholesterol levels in HMGCR KI liver may have led to an overexpression of lipogenic genes by a similar mechanism, resulting in the liver steatosis and fibrosis observed in HMGCR KI mice. Although we convincingly show that AMPK activation is able to inhibit HMGCR activity and decrease cholesterol synthesis in vivo, our study cannot exclude the possibility that other mevalonate pathway products, including dolichol, geranylpyrophosphate, and farnesylpyrophosphate, may also contribute to the overall metabolic phenotypes of HMGCR KI mice.
The liver releases lipids in the form of lipoproteins that contain mostly triglyceride and to a lesser extent cholesterol, cholesteryl ester, and phospholipids.40 The mobilization of triglyceride and cholesteryl ester from the intracellular lipid droplet and packaging into lipoproteins requires a series of de‐esterification and re‐esterification steps catalyzed by cholesteryl esterases, lipases, and triglyceride hydrolases, which all contain a consensus neutral lipid binding domain.40 In agreement with this, it has been shown that increased cholesteryl ester in the liver might compete with triglycerides for hydrolysis and lead to decreased triglyceride secretion, thereby increasing lipid storage in the liver.41 However, this mechanism is unlikely to be the cause of increased hepatic lipid content in HMGCR KI mice because serum triglyceride concentrations were increased, indicating that there was no defect in lipid secretion from KI livers. Given the capacity of autophagy to mediate lipid degradation, it has been suggested that impaired hepatic autophagy plays a role in the development of liver steatosis.42, 43 In addition, statin‐mediated inhibition of HMGCR has been shown to markedly induce autophagic flux by suppressing the mevalonate pathway.44 Thus, impairment in autophagy due to a gain‐of‐function of HMGCR could be a potential mechanism that is directly or indirectly responsible for the hepatic steatosis seen in HMGCR KI mice. Furthermore, in addition to increased lipogenic and gluconeogenic genes, HMGCR KI mice exhibited enhanced macrophage infiltration and elevated proinflammatory cytokine Il6 expression. In NAFLD subjects, both nuclear factor kappa B and mitogen‐activated protein kinase pathways were found to be enhanced and have a direct correlation with hepatic inflammation and fibrosis.45, 46 Thus, it is possible that these pathways may also indirectly mediate some of the phenotypes besides the up‐regulation of cholesterol synthesis in HMGCR KI mice
Recently, Woods et al.47 reported that mice expressing a constitutively active form of AMPK (γ1‐Asp316Ala) in the liver were protected from developing hepatic steatosis on a high‐fructose diet. These mice had essentially the reciprocal phenotype to the HMGCR KI mice that develop steatosis on a high‐carbohydrate diet. However, there are some subtle differences. In the liver‐specific γ1‐Asp316Ala mice fed a high‐fructose diet, accumulation of hepatic triglyceride is blocked and glucose output from the liver is inhibited but there is no change in Fasn or Acaca expression. Furthermore, despite the increased AMPK activity in the γ1‐Asp316Ala mice, there was no suppression of cholesterol synthesis. Thus, these results suggest that activated AMPK in the γ1‐Asp316Ala mice can effectively shut down lipid accumulation by acutely phosphorylating ACC1/2, without the requirement of regulating cholesterol synthesis. In contrast, in the HMGCR KI mice, the increase in hepatic triglyceride is accompanied by increased glucose output from the liver as well as increased mRNA expression of the SREBP1c gene targets Fasn, Acaca, and Acacb. The increased synthesis of cholesterol in the HMGCR KI mice seems to drive de novo fatty acid synthesis and leads to hepatic steatosis, despite AMPK signaling to ACC1/2 remaining intact. Together, these data imply that acute AMPK signaling to downstream substrates is responsible for the suppression of triglyceride synthesis, yet blocking AMPK signaling to HMGCR alone is sufficient to enhance hepatic triglyceride synthesis.
Overall, we show that AMPK‐HMGCR signaling is important in the regulation of cholesterol biosynthesis in vivo. Inhibition of this control mechanism under conditions of metabolic stress, such as high‐carbohydrate feeding, not only leads to hypercholesterolemia but unexpectedly also results in hepatic steatosis and fibrosis, suggesting that direct therapeutic targeting of the AMPK‐HMGCR signaling pathway may be an attractive strategy for preventing the onset and progression of NAFLD.
Potential conflict of interest
Nothing to report.
Supporting information
Acknowledgment
We thank Kevin Ngoei and Frosa Katsis for assistance with the biochemistry and antibody generation, respectively. We also thank Ryo Suzuki and C. Ronald Kahn for assistance with the biochemistry and cholesterol synthesis assays.
Supported by the National Health and Medical Research Council of Australia (Fellowship 1078752 to B.E.K.; project grants 1080473 to K.L. and 1085460 to B.E.K., S.G., and G.R.S.), Canadian Institutes of Health Research (project grant PJT148634 to M.D.F.; New Investigator Award to M.D.F.), Canadian Liver Foundation (operating funding to M.D.F.; summer studentship award to L.A.B.), Canada Research Chair in Metabolism and Obesity and J. Bruce Duncan Chair in Metabolic Diseases (to G.R.S.), Victorian Government’s Operational Infrastructure Support Program, and the L.E.W Carty Charitable Fund (to K.L.).
Contributor Information
Kim Loh, Email: kloh@svi.edu.au.
Sandra Galic, Email: sgalic@svi.edu.au.
References
Author names in bold designate shared co‐first authorship.
- 1. Ohashi K, Osuga J, Tozawa R, Kitamine T, Yagyu H, Sekiya M, et al. Early embryonic lethality caused by targeted disruption of the 3‐hydroxy‐3‐methylglutaryl‐CoA reductase gene. J Biol Chem 2003;278:42936‐42941. [DOI] [PubMed] [Google Scholar]
- 2. Nagashima S, Yagyu H, Ohashi K, Tazoe F, Takahashi M, Ohshiro T, et al. Liver‐specific deletion of 3‐hydroxy‐3‐methylglutaryl coenzyme A reductase causes hepatic steatosis and death. Arterioscler Thromb Vasc Biol 2012;32:1824‐1831. [DOI] [PubMed] [Google Scholar]
- 3. Goldstein JL, Brown MS. Regulation of the mevalonate pathway. Nature 1990;343:425‐430. [DOI] [PubMed] [Google Scholar]
- 4. Hampton R, Dimster‐Denk D, Rine J. The biology of HMG‐CoA reductase: the pros of contra‐regulation. Trends Biochem Sci 1996;21:140‐145. [PubMed] [Google Scholar]
- 5. Osborne TF, Goldstein JL, Brown MS. 5′ end of HMG CoA reductase gene contains sequences responsible for cholesterol‐mediated inhibition of transcription. Cell 1985;42:203‐212. [DOI] [PubMed] [Google Scholar]
- 6. Nakanishi M, Goldstein JL, Brown MS. Multivalent control of 3‐hydroxy‐3‐methylglutaryl coenzyme A reductase. Mevalonate‐derived product inhibits translation of mRNA and accelerates degradation of enzyme. J Biol Chem 1988;263:8929‐8937. [PubMed] [Google Scholar]
- 7. Faust JR, Luskey KL, Chin DJ, Goldstein JL, Brown MS. Regulation of synthesis and degradation of 3‐hydroxy‐3‐methylglutaryl‐coenzyme A reductase by low density lipoprotein and 25‐hydroxycholesterol in UT‐1 cells. Proc Natl Acad Sci U S A 1982;79:5205‐5209. [DOI] [PMC free article] [PubMed] [Google Scholar]
- 8. Edwards PA, Lan SF, Tanaka RD, Fogelman AM. Mevalonolactone inhibits the rate of synthesis and enhances the rate of degradation of 3‐hydroxy‐3‐methylglutaryl coenzyme A reductase in rat hepatocytes. J Biol Chem 1983;258:7272‐7275. [PubMed] [Google Scholar]
- 9. Chin DJ, Gil G, Faust JR, Goldstein JL, Brown MS, Luskey KL. Sterols accelerate degradation of hamster 3‐hydroxy‐3‐methylglutaryl coenzyme A reductase encoded by a constitutively expressed cDNA. Mol Cell Biol 1985;5:634‐641. [DOI] [PMC free article] [PubMed] [Google Scholar]
- 10. Steinberg GR, Kemp BE. AMPK in health and disease. Physiol Rev 2009;89:1025‐1078. [DOI] [PubMed] [Google Scholar]
- 11. Beg ZH, Allmann DW, Gibson DM. Modulation of 3‐hydroxy‐3‐methylglutaryl coenzyme A reductase activity with cAMP and wth protein fractions of rat liver cytosol. Biochem Biophys Res Commun 1973;54:1362‐1369. [DOI] [PubMed] [Google Scholar]
- 12. Ingebritsen TS, Lee HS, Parker RA, Gibson DM. Reversible modulation of the activities of both liver microsomal hydroxymethylglutaryl coenzyme A reductase and its inactivating enzyme. Evidence for regulation by phosphorylation‐dephosphorylation. Biochem Biophys Res Commun 1978;81:1268‐1277. [DOI] [PubMed] [Google Scholar]
- 13. Carling D, Zammit VA, Hardie DG. A common bicyclic protein kinase cascade inactivates the regulatory enzymes of fatty acid and cholesterol biosynthesis. FEBS Lett 1987;223:217‐222. [DOI] [PubMed] [Google Scholar]
- 14. Ross FA, MacKintosh C, Hardie DG. AMP‐activated protein kinase: a cellular energy sensor that comes in 12 flavours. FEBS J 2016;283:2987‐3001. [DOI] [PMC free article] [PubMed] [Google Scholar]
- 15. Zhang CS, Hawley SA, Zong Y, Li M, Wang Z, Gray A, et al. Fructose‐1,6‐bisphosphate and aldolase mediate glucose sensing by AMPK. Nature 2017;548:112‐116. [DOI] [PMC free article] [PubMed] [Google Scholar]
- 16. Oakhill JS, Scott JW, Kemp BE. AMPK functions as an adenylate charge‐regulated protein kinase. Trends Endocrinol Metab 2012;23:125‐132. [DOI] [PubMed] [Google Scholar]
- 17. Stark R, Ashley SE, Andrews ZB. AMPK and the neuroendocrine regulation of appetite and energy expenditure. Mol Cell Endocrinol 2013;366:215‐223. [DOI] [PubMed] [Google Scholar]
- 18. Clarke PR, Hardie DG. Regulation of HMG‐CoA reductase: identification of the site phosphorylated by the AMP‐activated protein kinase in vitro and in intact rat liver. EMBO J 1990;9:2439‐2446. [DOI] [PMC free article] [PubMed] [Google Scholar]
- 19. Sato R, Goldstein JL, Brown MS. Replacement of serine‐871 of hamster 3‐hydroxy‐3‐methylglutaryl‐CoA reductase prevents phosphorylation by AMP‐activated kinase and blocks inhibition of sterol synthesis induced by ATP depletion. Proc Natl Acad Sci U S A 1993;90:9261‐9265. [DOI] [PMC free article] [PubMed] [Google Scholar]
- 20. Suzuki R, Lee K, Jing E, Biddinger SB, McDonald JG, Montine TJ, et al. Diabetes and insulin in regulation of brain cholesterol metabolism. Cell Metab 2010;12:567‐579. [DOI] [PMC free article] [PubMed] [Google Scholar]
- 21. Scott JW, van Denderen BJ, Jorgensen SB, Honeyman JE, Steinberg GR, Oakhill JS, et al. Thienopyridone drugs are selective activators of AMP‐activated protein kinase beta1‐containing complexes. Chem Biol 2008;15:1220‐1230. [DOI] [PubMed] [Google Scholar]
- 22. Dzamko N, van Denderen BJ, Hevener AL, Jorgensen SB, Honeyman J, Galic S, et al. AMPK beta1 deletion reduces appetite, preventing obesity and hepatic insulin resistance. J Biol Chem 2010;285:115‐122. [DOI] [PMC free article] [PubMed] [Google Scholar]
- 23. Steinberg GR, O’Neill HM, Dzamko NL, Galic S, Naim T, Koopman R, et al. Whole body deletion of AMP‐activated protein kinase {beta}2 reduces muscle AMPK activity and exercise capacity. J Biol Chem 2010;285:37198‐37209. [DOI] [PMC free article] [PubMed] [Google Scholar]
- 24. Fullerton MD, Galic S, Marcinko K, Sikkema S, Pulinilkunnil T, Chen ZP, et al. Single phosphorylation sites in Acc1 and Acc2 regulate lipid homeostasis and the insulin‐sensitizing effects of metformin. Nat Med 2013;19:1649‐1654. [DOI] [PMC free article] [PubMed] [Google Scholar]
- 25. Yulyaningsih E, Loh K, Lin S, Lau J, Zhang L, Shi Y, et al. Pancreatic polypeptide controls energy homeostasis via Npy6r signaling in the suprachiasmatic nucleus in mice. Cell Metab 2014;19:58‐72. [DOI] [PubMed] [Google Scholar]
- 26. Galic S, Fullerton MD, Schertzer JD, Sikkema S, Marcinko K, Walkley CR, et al. Hematopoietic AMPK beta1 reduces mouse adipose tissue macrophage inflammation and insulin resistance in obesity. J Clin Invest 2011;121:4903‐4915. [DOI] [PMC free article] [PubMed] [Google Scholar]
- 27. Loh K, Zhang L, Brandon A, Wang Q, Begg D, Qi Y, et al. Insulin controls food intake and energy balance via NPY neurons. Mol Metab 2017;6:574‐584. [DOI] [PMC free article] [PubMed] [Google Scholar]
- 28. Strable MS, Ntambi JM. Genetic control of de novo lipogenesis: role in diet‐induced obesity. Crit Rev Biochem Mol Biol 2010;45:199‐214. [DOI] [PMC free article] [PubMed] [Google Scholar]
- 29. Samuel VT, Petersen KF, Shulman GI. Lipid‐induced insulin resistance: unravelling the mechanism. Lancet 2010;375:2267‐2277. [DOI] [PMC free article] [PubMed] [Google Scholar]
- 30. Barrientos G, Sanchez‐Aguilera P, Jaimovich E, Hidalgo C, Llanos P. Membrane cholesterol in skeletal muscle: a novel player in excitation‐contraction coupling and insulin resistance. J Diabetes Res 2017;2017:3941898. [DOI] [PMC free article] [PubMed] [Google Scholar]
- 31. Habegger KM, Penque BA, Sealls W, Tackett L, Bell LN, Blue EK, et al. Fat‐induced membrane cholesterol accrual provokes cortical filamentous actin destabilisation and glucose transport dysfunction in skeletal muscle. Diabetologia 2012;55:457‐467. [DOI] [PMC free article] [PubMed] [Google Scholar]
- 32. Li Y, Xu S, Mihaylova MM, Zheng B, Hou X, Jiang B, et al. AMPK phosphorylates and inhibits SREBP activity to attenuate hepatic steatosis and atherosclerosis in diet‐induced insulin‐resistant mice. Cell Metab 2011;13:376‐388. [DOI] [PMC free article] [PubMed] [Google Scholar]
- 33. Kainuma M, Fujimoto M, Sekiya N, Tsuneyama K, Cheng C, Takano Y, et al. Cholesterol‐fed rabbit as a unique model of nonalcoholic, nonobese, non‐insulin‐resistant fatty liver disease with characteristic fibrosis. J Gastroenterol 2006;41:971‐980. [DOI] [PubMed] [Google Scholar]
- 34. Yasutake K, Nakamuta M, Shima Y, Ohyama A, Masuda K, Haruta N, et al. Nutritional investigation of non‐obese patients with non‐alcoholic fatty liver disease: the significance of dietary cholesterol. Scand J Gastroenterol 2009;44:471‐477. [DOI] [PubMed] [Google Scholar]
- 35. Min HK, Kapoor A, Fuchs M, Mirshahi F, Zhou H, Maher J, et al. Increased hepatic synthesis and dysregulation of cholesterol metabolism is associated with the severity of nonalcoholic fatty liver disease. Cell Metab 2012;15:665‐674. [DOI] [PMC free article] [PubMed] [Google Scholar]
- 36. Puri P, Baillie RA, Wiest MM, Mirshahi F, Choudhury J, Cheung O, et al. A lipidomic analysis of nonalcoholic fatty liver disease. Hepatology 2007;46:1081‐1090. [DOI] [PubMed] [Google Scholar]
- 37. Simonen P, Kotronen A, Hallikainen M, Sevastianova K, Makkonen J, Hakkarainen A, et al. Cholesterol synthesis is increased and absorption decreased in non‐alcoholic fatty liver disease independent of obesity. J Hepatol 2011;54:153‐159. [DOI] [PubMed] [Google Scholar]
- 38. Nakamuta M, Kohjima M, Higuchi N, Kato M, Kotoh K, Yoshimoto T, et al. The significance of differences in fatty acid metabolism between obese and non‐obese patients with non‐alcoholic fatty liver disease. Int J Mol Med 2008;22:663‐667. [PubMed] [Google Scholar]
- 39. Sim WC, Park S, Lee KY, Je YT, Yin HQ, Choi YJ, et al. LXR‐alpha antagonist meso‐dihydroguaiaretic acid attenuates high‐fat diet‐induced nonalcoholic fatty liver. Biochem Pharmacol 2014;90:414‐424. [DOI] [PubMed] [Google Scholar]
- 40. Mensenkamp AR, Havekes LM, Romijn JA, Kuipers F. Hepatic steatosis and very low density lipoprotein secretion: the involvement of apolipoprotein E. J Hepatol 2001;35:816‐822. [DOI] [PubMed] [Google Scholar]
- 41. Alger HM, Brown JM, Sawyer JK, Kelley KL, Shah R, Wilson MD, et al. Inhibition of acyl‐coenzyme A:cholesterol acyltransferase 2 (ACAT2) prevents dietary cholesterol‐associated steatosis by enhancing hepatic triglyceride mobilization. J Biol Chem 2010;285:14267‐14274. [DOI] [PMC free article] [PubMed] [Google Scholar]
- 42. Amir M, Czaja MJ. Autophagy in nonalcoholic steatohepatitis. Expert Rev Gastroenterol Hepatol 2011;5:159‐166. [DOI] [PMC free article] [PubMed] [Google Scholar]
- 43. Rautou PE, Mansouri A, Lebrec D, Durand F, Valla D, Moreau R. Autophagy in liver diseases. J Hepatol 2010;53:1123‐1134. [DOI] [PubMed] [Google Scholar]
- 44. Jiang P, Mukthavaram R, Chao Y, Nomura N, Bharati IS, Fogal V, et al. In vitro and in vivo anticancer effects of mevalonate pathway modulation on human cancer cells. Br J Cancer 2014;111:1562‐1571. [DOI] [PMC free article] [PubMed] [Google Scholar]
- 45. Luedde T, Schwabe RF. NF‐kappaB in the liver–linking injury, fibrosis and hepatocellular carcinoma. Nat Rev Gastroenterol Hepatol 2011;8:108‐118. [DOI] [PMC free article] [PubMed] [Google Scholar]
- 46. Lawan A, Bennett AM. Mitogen‐activated protein kinase regulation in hepatic metabolism. Trends Endocrinol Metab 2017;28:868‐878. [DOI] [PMC free article] [PubMed] [Google Scholar]
- 47. Woods A, Williams JR, Muckett PJ, Mayer FV, Liljevald M, Bohlooly‐Y M, et al. Liver‐specific activation of ampk prevents steatosis on a high‐fructose diet. Cell Rep 2017;18:3043‐3051. [DOI] [PMC free article] [PubMed] [Google Scholar]
Associated Data
This section collects any data citations, data availability statements, or supplementary materials included in this article.
Supplementary Materials