Abstract
Purpose:
This work demonstrates a magnetization prepared diffusion-weighted single-shot fast spin echo (SS-FSE) pulse sequence for the application of body imaging to improve robustness to geometric distortion. This work also proposes a scan averaging technique that is superior to magnitude averaging and is not subject to artifacts due to object phase.
Theory and Methods:
This single-shot sequence is robust against violation of the Carr-Purcell-Meiboom-Gill (CPMG) condition. This is achieved by dephasing the signal after diffusion weighting and tipping the MG component of the signal onto the longitudinal axis while the non-MG component is spoiled. The MG signal component is then excited and captured using a traditional SS-FSE sequence, although the echo needs to be recalled prior to each echo. Extended Parallel Imaging (ExtPI) averaging is used where coil sensitivities from the multiple acquisitions are concatenated into one large parallel imaging (PI) problem. The size of the PI problem is reduced by SVD-based coil compression which also provides background noise suppression. This sequence and reconstruction are evaluated in simulation, phantom scans, and in vivo abdominal clinical cases.
Results:
Simulations show that the sequence generates a stable signal throughout the echo train which leads to good image quality. This sequence is inherently low-SNR, but much of the SNR can be regained through scan averaging and the proposed ExtPI reconstruction. In vivo results show that the proposed method is able to provide diffusion encoded images while mitigating geometric distortion artifacts compared to EPI.
Conclusion:
This work presents a diffusion-prepared SS-FSE sequence that is robust against the violation of the CPMG condition while providing diffusion contrast in clinical cases.
Keywords: SS-FSE, CPMG, diffusion weighting, body imaging
Introduction
Diffusion encoding is a magnetic resonance imaging (MRI) contrast mechanism derived from microscopic water content motion. Diffusion encoding generates this contrast by applying large motion-probing gradients during some specified time, which act to reduce the signal magnitude and modify the phase of the net magnetization vector of spins in each voxel. Critically, in the presence of bulk motion, this can cause large phase changes of the magnetization vector after the diffusion encoding module.
Due to this sensitivity to motion, typical imaging pulse sequences used with diffusion encoding are fast 2D sequences where all of the signal needed to reconstruct the final image is acquired after a single excitation. This single-shot approach is used in order to avoid motion artifacts and inconsistencies from multi-shot acquisitions. One common imaging technique used in diffusion encoded pulse sequences is echo planar imaging (EPI). EPI has the advantages of being insensitive to the initial phase of the magnetization vector immediately prior to imaging and being a rapid, single-shot sequence, which avoids multi-shot motion artifacts. However, the EPI signal is not refocused from echo to echo and consequently suffers from substantial phase accrual for off-resonant spins throughout its relatively long readout. The phase modulation in k-space leads to image distortion and blurring when imaging a slice with inhomogeneous B0.
Alternatively, single-shot fast spin echo (SS-FSE) (1) is also a fast, single-shot 2D MRI method. SS-FSE is largely insensitive to B0 field inhomogeneity as the signal in SS-FSE imaging is repetitively refocused with a spin-echo pulse for each ky-line that is acquired. However, SS-FSE imaging is very sensitive to the phase of the transverse magnetization prior to the echo train. The Carr-Purcell-Meiboom-Gill (CPMG) condition specifies the design characteristics that an SS-FSE pulse sequence must meet to achieve a stable signal throughout an echo train. The Carr-Purcell (CP) condition (2) specifies a balanced gradient area around the refocusing radio-frequency (RF) pulses. The Meiboom-Gill (MG) condition (3) specifies the constraint on the phase of transverse magnetization prior the echo train relative to the phase of the refocusing RF pulses. This latter condition specifies that the initial phase of the magnetization at one half of the echo spacing must be parallel or antiparallel to the phase of the refocusing RF pulses. Violation of either the CP or MG condition will lead to signal artifacts including banding, streaking, ghosting, and signal dropouts.
If a typical CPMG SS-FSE sequence was prefaced with a diffusion preparation module, the sequence could look like — Diffusion Preparation — αy — [τ — αy] — … — [τ — αy]. In this case, the diffusion preparation would follow the approach proposed by Stejskal-Tanner (4), τ is the echo spacing, and α is the flip angle of the refocusing RF pulses. Because of the bulk motion sensitivity of diffusion encoding, there can be no guarantee that the phase of the initial magnetization would satisfy the MG condition and, therefore, the images from the sequence would be subject to artifacts.
Because of the image distortion in areas with substantial B0 inhomogeneity for EPI, there has been much effort to resolve the difficulty of combining an SS-FSE readout with a diffusion contrast preparation. Single-shot approaches that can be used to address this issues are either quadratic phase modulation or the use of dephasing crushers. An SS-FSE method where quadratic phase modulation is applied on the refocusing RF pulses in the echo train largely stems from work Zur proposed in (5) and refined by Le Roux in (6, 7). This non-Carr-Purcell-Meiboom-Gill (nCPMG) phase modulation does preserve the full signal throughout the echo train. However, this sequence has strict requirements on the RF pulses used (8) and presents a complicated reconstruction (9) due to oscillation of the quadrature component of the magnetization, which requires doubling the number of phase encodes and increases image blurring and specific absorption rate (SAR) accumulation (10).
Alternatively, Norris proposed the U-FLARE (11) sequence whereby the initial phase is dispersed across the voxel prior to the echo train, ensuring equal representation of the signal in the MG and non-MG components. This approach was further refined by Alsop (12) where the non-MG component of the signal is effectively “hidden” along the longitudinal axis by a 90° pulse prior to the echo train. The disadvantages of these approaches are (1) the signal is halved due to the dephasing and rephasing needed to ensure signal stability, and (2) there is a strict requirement on the additional 90° pulse to be highly selective to avoid problems in the transition band. A variant of this approach has been recently developed (13), in which the MG component signal of the dephased transverse magnetization is first tipped onto the longitudinal axis and then the non-MG component is spoiled with a large gradient lobe. The MG component in the longitudinal axis is then imaged using a traditional FSE echo train. In this case, Zhang et al. (13) used a multi-shot 3D FSE acquisition. While this can allow for higher resolution and potentially higher SNR than a slice selective single-shot method, this approach is time consuming and, more importantly, may suffer from shot-to-shot motion artifacts, particularly as the b-value increases. This latter issue is particularly important in areas where substantial motion can be expected, such as the abdomen.
Other multi-shot approaches have also approached the problem of combining diffusion encoding with fast spin echo. Notably, Pipe has proposed the Periodically Rotated Overlapping ParallEL LInes with Enhanced Reconstruction (PROPELLER) (14) method. This approach rotates a small EPI readout blade around the k-space origin and refocuses the signal between each blade using an XY phase modulation scheme. This technique has been proposed in the body (15) as well. Further improvements of the PROPELLER approach include the incorporation of the SPLICE paradigm to better preserve the signal (16).
This paper presents a magnetization prepared diffusion encoded SS-FSE pulse sequence. Violation of the MG condition is avoided by dephasing the signal during the magnetization preparation module and recalling the echo after each refocusing RF pulse in the echo train. While the proposed sequence is similar to what is proposed by Zhang (13) for the magnetization preparation, it differs substantially in that it is both single-shot and slice selective. A multi-scan averaging approach is described to increase SNR together through a novel reconstruction approach. This reconstruction does not combine data simply by averaging diffusion magnitude image data. Rather, this reconstruction concatenates each acquired k-space together to form one large parallel imaging reconstruction problem. Both sequence and reconstruction are demonstrated in simulation, phantom scanning, and clinical abdominal cases.
Theory
Background
To motivate the need for the proposed sequence (referred here as the single-shot MG signal On Tip-up, or ss-MGOT), it is useful to recall some fundamentals of the fast spin echo (FSE) sequence. Norris describes (11) the FSE sequence signal in terms of the “main” and “parasitic” components, with each component being scaled at each echo by some coefficient A for the main component and b for the parasitic component. Writing the signal at each echo—typically written in blocks of two with n = 1, 3 …—yields
| (1) |
where Q0 = X + jY is the magnetization signal. This can be written as
| (2) |
The CPMG sequence causes the coefficients An and bn to oscillate rapidly throughout the echo train, particularly as the flip angle of the refocusing RF pulses decreases. However, the term An + bn tends to add constructively, thus any signal in X would be maintained throughout the echo train. Conversely, the term An − bn tends to add destructively, particularly as the refocusing flip angle decreases. Any signal in Y will be quickly lost in the echo train. Hence, the MG condition is established, which states that all the initial magnetization must be in X. The MG condition is impossible to guarantee with diffusion preparation. This loss of signal in the Y magnetization is the source of artifacts that are associated with CPMG SS-FSE diffusion sequences. This is further elaborated on in (8, 9).
The single-shot approach that Alsop proposed (12) effectively spreads the signal equally between X and Y across the voxel through the use of an dephasing gradient after the diffusion encoding. To avoid the rapidly decaying and oscillating echo train signal that would originate from the Y magnetization component, it is tipped up onto the longitudinal axis. The remaining X magnetization component and echo spacing of the sequence can then satisfy the MG condition and produce a smooth and long-lasting signal through the echo train. The signal after each refocusing RF pulse remains sinusoidally distributed along the z-axis and must be rephased prior to echo readout. Thus, an additional rephasing gradient is needed after each refocusing pulse. To maintain CPMG conditions, the signal must be dephased again by another gradient prior to the next refocusing pulse.
This approach has two shortcomings. The first is the loss of half of the signal—a drawback that is intrinsic to the technique. The other issue concerns the RF pulse design (17) when this approach is used in a slice selective SS-FSE sequence. Specifically, the 90° pulse must remove all the quadrature, or Y, magnetization from the transverse plane Mxy to the longitudinal axis Mz. An ideal RF pulse would need to be extremely selective to generate an excitation profile with a flat pass-band and very short transition band such that the excited transverse magnetization enjoys a 90° flip angle. Designing such a pulse is difficult due to peak B1 limitations, which might widen the RF pulse duration leading to an increased echo spacing. Further, the use of shorter and less-selective spin echo pulses in the echo train will have a different excitation bandwidth than the tip-up 90° pulse, which could lead to chemical shift artifacts in areas of off-resonance.
The ss-MGOT Sequence
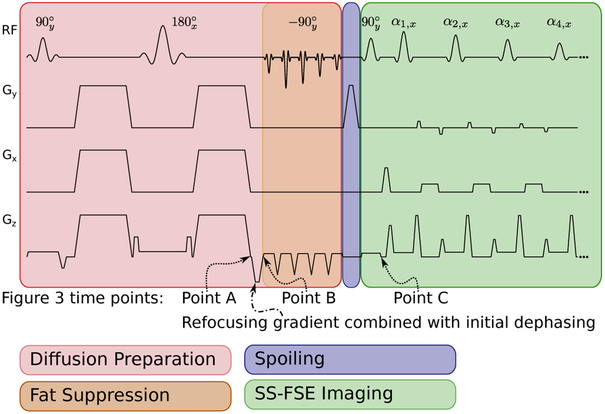
The SS-MGOT sequence is a SS-FSE pulse sequence that relies on a magnetization-preparation module to generate diffusion contrast. It is illustrated in Figure 1. The magnetization-preparation stage of the sequence (highlighted in red) is slab selective. Similar to the Alsop sequence, after the diffusion preparation module, the signal is dephased such that the voxel’s magnetization is distributed uniformly on the x — y plane. However, in the SS-MGOT sequence a tip-up 90° pulse is used to tip the X magnetization (which is the signal of interest) onto the longitudinal axis Mz. The remaining magnetization on the transverse plane Mxy is then spoiled sufficiently (eight cycles of dephasing across the voxel on Gy) such that this magnetization cannot be recalled into the echo train during refocusing (which is highlighted in purple in Figure 1). After spoiling, the magnetization on Mz is then excited and imaged using a standard CPMG SS-FSE sequence (highlighted in green in Figure 1), with an additional rephasing gradient to recall the echo signal at each echo, and a dephasing gradient to maintain CPMG.
Figure 1:
The proposed SS-FSE sequence. This sequence occurs in three modules. The hrst (shaded red) module is the Stejskal-Tanner diffusion preparation. Flowever, at the end of the diffusion preparation, the transverse magnetization is dephased along z, and then tipped back onto longitudinal axis with a water-only spectral-spatial pulse. The initial dephasing gradient is combined with the slice-select refocusing gradient. The second stage is the spoiling stage, where the spoiler on Gy dephases any remaining transverse magnetization with many cycles of phase. The third phase is a CPMG SS-FSE echo train. Flowever, the echo is recalled after the refocusing RF pulse by rephasing the gradient. The signal is dephased again after acquiring the echo and the signal is refocused yet again. After the echo is acquired, the signal is rephased along Gz. The additional dephasing/rephasing are added to the crushers on Gz to minimize echo spacing as the voxel dimension is much bigger in z than in either x or y. The rephasing crushing is represented by adding to the dephasing gradient area to the right refocusing RF crushers. Conversely, the dephasing is achieved by subtracting from the left refocusing RF crushers. Time points that refer to simulations for Figure 3 are also included for reference.
Similar to other dephasing approaches (12, 13), this approach allows flexibility in choosing which gradient axis can host the rephasing and dephasing gradients. In this work, the targeted anatomy is the abdomen. At our institution, the clinical protocol for DW-EPI calls for a 6 mm slice thickness. Given that the voxel dimension in the z-dimension is much larger than the x- and y-dimensions, less gradient area is needed to achieve sufficient dephasing if such dephasing is placed on Gz, which allows for shorter echo spacings on our system. The dephasing and rephasing gradient areas are combined with the refocusing RF pulse crushers to minimize echo spacing. An illustration of this sequence is seen in Figure 1.
While the original Alsop sequence (12) is slice selective, the sequence in (13) is a multi-shot 3D sequence. The ss-MGOT sequence is similar to (13) in that it incorporates a tip-up pulse to preserve the X component of the magnetization following diffusion encoding and dephasing but is slice-selective. Because this diffusion preparation module is detached from the CPMG SS-FSE sequence, it allows for a slab selective diffusion preparation. This is important for two reasons. The first is that the RF pulses in the diffusion preparation module can have longer pulse widths without increasing the echo spacing in the imaging echo train. This facilitates the use of very selective RF pulses, which ensures that the signal from excitation, the spin echo refocusing, and tip-up all see the proper flip angles. Secondly, the slab selective excitation ensures that the magnetization in the slice width that is used in the SS-FSE echo train falls in the slab excitation RF pulse pass-bands. Additionally, through slice interleaving—e.g., imaging every 4th slice in the volume to ensure that the magnetization has sufficiently recovered prior to excitation—this slab preparation becomes feasible in rapid multi-slice sequences.
Another difference between the SS-MGOT sequence and that in Zhang et al.’s work (13) is the approach to lipid suppression, which is achieved here though the use of a water-only spectrally selective RF pulse during the diffusion preparation module. In this case, the tip-up 90° pulse is a spectral-spatial pulse using a maximum-phase envelope to minimize the duration of the diffusion encoding and tip-up. This approach will leave both the X and Y component of the lipid signal in the transverse plane, which will then be spoiled along with the Y magnetization while tipping the X water signal back onto the longitudinal axis.
Reconstruction
Both the ss-MGOT and the Alsop sequences produce images with lower SNR than a conventional SS-FSE acquisition because half of the available signal is dephased and never recalled during the echo train. To achieve clinically acceptable SNR, a scan with multiple number of excitations (multi-NEX) is needed. Scan averaging in diffusion imaging is not straightforward as diffusion encoded images tend to have object phase. When complex averaging is used in the presence of considerable object phase, phase interference will lead to image artifacts. A typical averaging scheme in diffusion encoded imaging will, consequently, be an average of the magnitudes of the individual images. For complex images with zero mean Gaussian noise, the magnitude image will have noise with a Rician distribution with non-zero mean. This noise bias is preserved in the averaging of the multiple magnitude images.
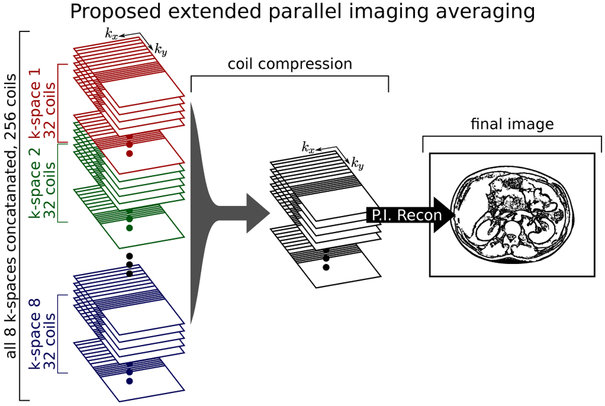
The approach we propose to avoid this noise bias is the Extended Parallel Imaging (ExtPI) method (18, 19) as has been presented in balanced Steady State Free-Precession (bSSFP) imaging. In the bSSFP context, the different RF phase increment acquisitions are combined by concatenating the k-space acquisitions for each coil. This larger coil stack is then processed as one large parallel imaging process. The same approach can be used for averaging data where the phase can be otherwise destructive. Figure 2 shows this process as an illustration. This approach works in the presence of motion-induced object phase because the images are not added together in the traditional sense. Rather, they are treated as additional coils without demanding any acceleration, leading to an increase in SNR.
Figure 2:
Illustration of the proposed reconstruction approach. Due to the low SNR of the ss-MGOT method, scan averaging is performed. Because motion during diffusion encoding imparts an unknown image phase, traditional complex averaging cannot be used. In the proposed ExtPI averaging approach the k-space data from each acquisition is concatenated, compressed using SVD coil compression, and then reconstructed using traditional parallel and partial k-space techniques.
As the number of scan averages increases, the parallel imaging reconstruction problem becomes larger, which can lead to very long reconstruction times. The number of virtual coils can be reduced through singular value decomposition (SVD) coil array compression (20, 21) in order to ease the computational demands of the problem. In addition to relieving the necessary computation in the parallel imaging reconstruction, SVD coil compression achieves a lower mean noise floor (21) compared to magnitude averaging. Thus, this ExtPI technique offers the benefits of complex averaging without the complications and image artifacts that arise from phase interference artifacts.
Methods
Simulation
Both the ss-MGOT sequence as well as the Alsop approach were modeled through Bloch simulation. These simulations follow the conventions used in (22) to model the behavior of specific RF pulses on the magnetization vectors across a given slice. These simulations used 3000 isochromats across 30 mm of the z-axis. The sequence design called for a 6 mm slice thickness. The ss-MGOT approach used a 18 mm thick slab selection for the diffusion preparation and re-excited a 6 mm thick slice in the FSE echo train. To more precisely replicate the behavior of the sequence in the presence of a non-CPMG initial phase, the diffusion effects were not modeled. Instead, the violation of the MG condition was modeled by varying the phase of the initial excitation 90° RF pulse.
Two different types of simulations were performed. The first was the evolution of the magnetization across three different points in the sequence. The first time point occurred immediately prior to dephasing the signal (Point A in Figure 1). The second time point occurred immediately after the initial dephasing of the signal (Point B in Figure 1). The last time point occurred immediately prior to the first refocusing RF pulse in the imaging echo train (Point C in Figure 1). In this simulation, the magnetizations Mx, My, and Mz were determined for both the Alsop and ss-MGOT sequences. In this case, the phase of the excitation pulse was 45°. Two cycles of dephasing were added to Gz.
In the second simulation, the echo train was modeled for both the Alsop and ss-MGOT sequences. This simulation compared the effects on echo train signal smoothness after the violation of the MG condition for two different numbers of cycles—2 cycles and 4 cycles—of dephasing on Gz. The effects of three different excitation phases—0°, 45°, and 90°—were also compared for each sequence.
Sequence design and implementation
Three sequences were used extensively throughout this work: standard diffusion encoded EPI, the diffusion encoded SS-FSE sequence as described in (12), and the proposed ss-MGOT sequence. Each technique was scanned in a multi-slice fashion. To minimize slice cross-talk, all SS-FSE scans used scan interleaving with a skip factor of 4 (e.g., if scanning 12 slices, the slice ordering would be [1, 5, 9, 2, 6, 10, 3, 7, 11, 4, 8, 12]). The flip angle scheme used in the Alsop approach is the low-angle tailored RF pulse train as described by Le Roux (23) to be consistent with other implementations of this sequence (12, 24). The ss-MGOT sequence uses the tailored flip angle train proposed by Busse (25). To increase image sharpness, the minimum flip angle was 55° and the low-order phase encode flip angle was 60°. The use of a variable flip angle scheme to increase sharpness has been well-documented (25, 26) as it provides a more favorable point spread function. (A comparison of echo train modulation and point spread functions between ss-MGOT with a variable flip angle scheme and the nCPMG SS-FSE acquisition and reconstruction (27)—which requires a fixed flip angle of 160° throughout the echo train and double phase encoding for reconstruction—is seen in Supporting Figure S1.) In both the Alsop and ss-MGOT sequences, a readout bandwidth of ±41.67kHz was used. All scans used a image matrix of 128y × 128x. The EPI sequence used a SENSE (28) uniform sampling scheme of R = 2, which required an external calibration scan. All SS-FSE sequences were self-calibrating and used uniform sampling with R = 2 and a central auto-calibration region size of 20 k-space lines. ESPIRiT (29) was used for parallel imaging reconstruction in the SS-FSE cases. Partial k-space sampling was used to reduce the echo time. The partial Fourier fraction was 0.66 for the EPI case and 0.60 for the SS-FSE cases. The echo spacing for EPI was 0.71 ms and 4.20 ms for SS-FSE sequences. The echo train length was nominally 84 echoes for EPI and 76 echoes for SS-FSE sequences, though parallel imaging reduced this to 42 echoes using SENSE reconstruction for the EPI sequence and 46 echoes for an ESPIRiT auto-calibrating reconstruction for the SS-FSE sequences. Thus, EPI had a total readout duration of 30 ms and the SS-FSE sequences had a total readout duration of 194 ms. Echo times (TE) were 82.9 ms and 48.7 ms for ss-MGOT and EPI, respectively. Repetition time was limited by SAR accumulation, and varied by experiment.
The pulses used in the diffusion encoding magnetization preparation module followed the Shinnar-Le Roux (SLR) (22) convention. This design choice was made to ensure a relatively flat pass-band and narrow transition bands in the excited slice profile. All pulses in this module had a time-bandwidth product of 3.55. The excitation RF pulse had a pulse duration of 3.2 ms and a peak RF amplitude of 0.065 G. The spin echo pulse in the diffusion encoding module also had a pulse duration of 3.2 ms and had a peak RF amplitude of 0.191 G. The spectral-spatial pulse used for the tip-up was designed using the methods described in (30, 31). A maximum-phase equiripple complex filter design was used for the spectral envelope with a spectral passband of ±128 Hz and stopband of [−549, −306] Hz. The flip angles were chosen such that within the passband it returned 0.995 ± 0.005 of the transverse magnetization to the longitudinal axis, while in the stopband it returned 0.05 ± 0.01 of the transverse magnetization at the cost of preserving five percent of the lipid signal. The spatial sublobe pulse used a least-squares linear-phase filter design that had a time-bandwidth product of 3.55 with spatial passband of 0.995 ± 0.005 and stopband of 0 ± 0.01 with gradient sublobe areas chosen to give a slice thickness of 10mm. A flyback pulse design with six subpulses was required to achieve the spectral specification. The peak gradient amplitude of the positive gradient sublobes during excitation was 22.9 mT ⋅ m−1 with a peak RF amplitude of 0.226 G. The RF subpulses were shaped using the variable excitation rate (VERSE) (32) technique fully onto the positive gradient sublobe ramps. The total duration of the positive and negative gradient sublobes for the pulse was 1.022 ms, yielding a spectral bandwidth for the pulse of 978 Hz. The total length of the RF pulse was 5.64 ms.
The RF pulses used in the imaging echo train are low time-bandwidth product generic windowed sinc pulses that are standard in the SS-FSE pulse sequence. The time-bandwidth product for both excitation and refocusing pulses was 1.54. The pulse width for both pulse types was 1.2 ms. RF peak amplitude for the echo train excitation pulse was 0.082 G. RF peak amplitude for the refocusing pulses in the echo train depended on the flip angle, which was variable according to the method in (25).
All protocols were performed on a 3T General Electric (GE) Discovery MR750 scanner. System hardware specifications include max RF of 0.25 μT, max gradient amplitude of 50 mT ⋅ m−1, and maximum gradient slew rate of 150 mT ⋅ m−1 ⋅ ms−1. A body coil was used for transmission. For phantom scans, a 32-channel head coil was used. For in vivo scans, a 32-channel cardiac coil was used. Each technique was implemented by modifying a standard SS-FSE pulse sequence.
Phantom Validation
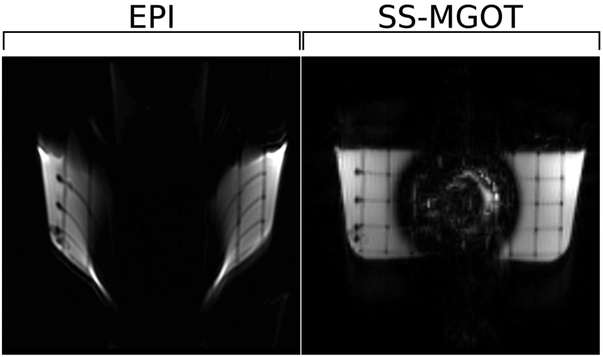
Four different phantom experiments were performed. The first was a comparison between diffusion encoded EPI and the SS-MGOT sequence in the presence of B0 inhomogeneity. For this experiment, a titanium shoulder implant along with a plastic grid were embedded in doped agar. While the presence of metal in the imaging system does produce extreme B0 inhomogeneity, it was appropriate to use here to demonstrate the degree of distortion seen in both EPI and the SS-MGOT images. These images are given as anecdotal visual evidence of the distortion effects off-resonance produces in both pulse sequences.
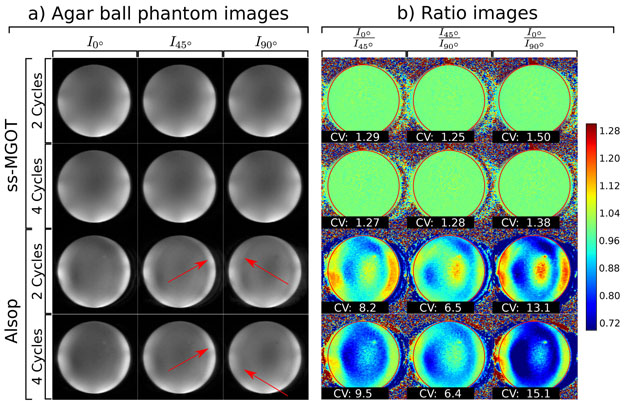
The second phantom experiment was a comparison of the Alsop and ss-MGOT sequences using doped agar ball phantom images where the diffusion gradient lobes of each of the sequences have zero-amplitude but the initial excitation phase varies from 0°, 45°, and 90°. In the first experiment, the dephasing/rephasing gradient areas were chosen so as to achieve either two or four complete cycles of phase over the z-dimension voxel for each sequence and the resultant images compared. To characterize these artifacts, ratio images were found for each excitation case within each pulse sequence (e.g., I0°/I45°, I45°/I45°, and I0°/I90° where Iθ is the image with some excitation phase θ). Ideally, the excitation phase should not impact the reconstructed image, so the ratio over the ball phantom should be close to 1.0. The homogeneity over the ball phantom ROI was characterized by calculating the coefficient of variation.
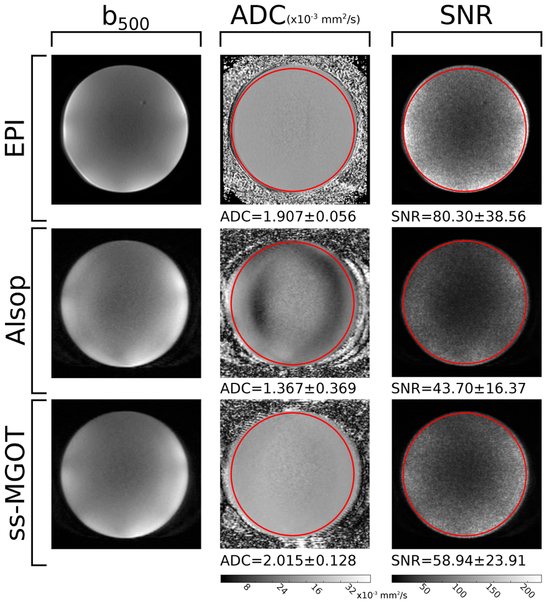
The third phantom experiment examined the SNR and measured ADC in a doped agar ball phantom as acquired by diffusion encoded EPI, Alsop SS-FSE, and ss-MGOT. For these experiments, diffusion preparation was used with diffusion gradients applied in the [1, 1, 1]T direction to minimize echo time. The b-value was 500 s ⋅ mm−2 to match what is used in the abdomen clinical protocol at our institution. SNR was determined by acquiring 30 images with a 5 s TR for each sequence. Voxel-wise SNR was calculated as
| (3) |
where r is the voxel location and K = 30 is the number of images. Apparent diffusion coefficient (ADC) was also calculated for each sequence. ADC was calculated by
| (4) |
at each voxel r where IT2 and IDWI are the T2-weighted (b = 0s ⋅ mm−2) and the diffusion encoded images, respectively.
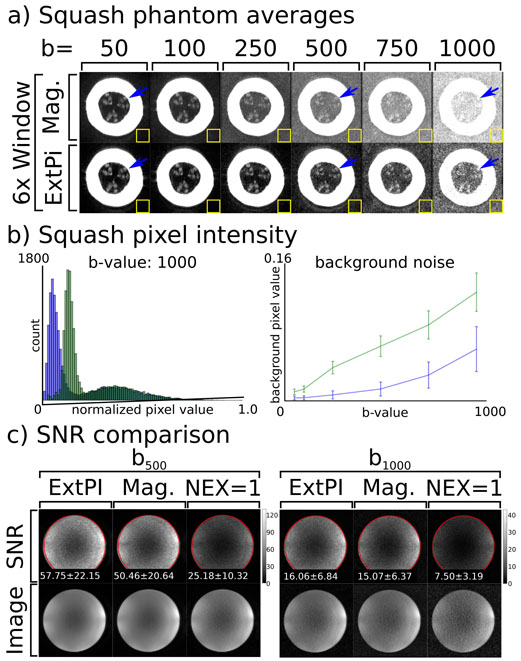
The last phantom experiment examined the performance of the scan averaging ExtPI reconstruction compared to the standard magnitude average approach. Here, two phantoms were scanned. In the first case, a spaghetti squash was scanned with the ss-MGOT sequence. This phantom choice was driven by the fact that it provided lower SNR than that of an agar ball phantom; thus, the non-zero noise mean would be particularly evident. The b-value ranged from 50 s ⋅ mm−2 to 1000 s ⋅ mm−2. Eight images were scanned at each b-value. Both magnitude averaging and the proposed ExtPI method were used to reconstruct the same k-space data and the results were compared. Thirty ExtPI and magnitude averaging images of an agar ball phantom were used to create SNR maps to compare the SNR performance of both techniques. These maps were created at two different b-values: b = 500 s ⋅ mm−2 and b = 1000 s ⋅ mm−2. The second averaging phantom experiment used the doped agar ball phantom. SNR maps were created from 30 magnitude averaging and ExtPI reconstruction images. These were also compared against a standard single NEX image SNR map to better understand the SNR gains of each sequence.
In vivo clinical scanning
Three abdomen and two chest clinical scans were performed using diffusion encoded EPI and the diffusion prepared ss-MGOT sequence. All patient subjects consented in accordance with institutional review board guidelines. The parents or legal guardians of pediatric patients provide consent and children over the age of eight years old assent per our institutional guidelines. These cases were scanned at the pediatric radiology clinic at our institution. The ages varied from 5 months old to 18 years old. Both the EPI and ss-MGOT sequences used NEX=8 scan averaging. The ss-MGOT images were averaged using the ExtPI technique. The EPI images were averaged using magnitude averaging to be consistent with our institution’s clinical protocol. Each case was free-breathing without any additional motion compensation. (33, 34) The FOV varied from 20-40 cm. Each scan was a multi-slice acquisition. The b-value in all cases was b = 500 s ⋅ mm−2 and was applied in the [1, 1, 1]T direction to minimize the echo time. The echo time was 48.7 ms for EPI and 82.9 ms for ss-MGOT. For 30 slices and NEX=8, the EPI scan took 131 s and the ss-MGOT scan took 75 s. For the SS-MGOT sequence, two cycles of dephasing in the slice direction (i.e., Gz) were used. The scan parameters remained consistent with what was otherwise used in the phantom experiments.
Results
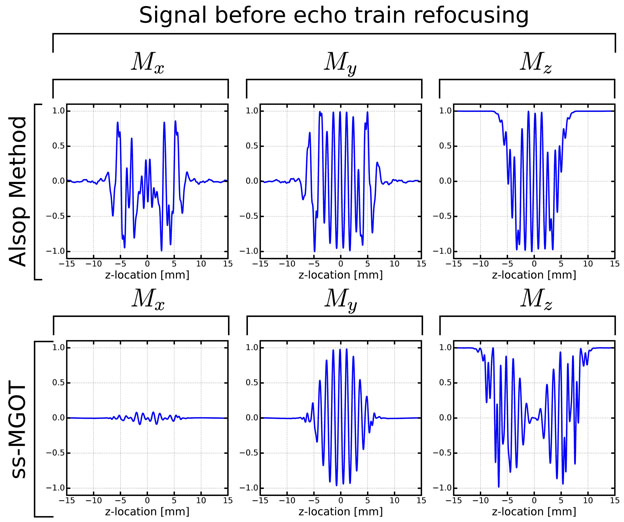
Simulations show the sequence performance compared to the Alsop approach. Figure 3 shows the individual magnetization components Mx, My, and Mz at Point C in the sequence. (The entirety of the simulation can be found in Supporting Figure S2 while Figure 1 demonstrates where in the sequence these time points occur.) Point C is immediately prior to the first refocusing RF pulse in the echo train. In the Alsop sequence, despite attempting to tip-up all of the non-MG component onto the longitudinal axis, substantial non-MG signal still persists. Conversely, the ss-MGOT approach effectively spoils the non-MG signal along the y-direction, thus removing most of this non-MG signal with eight cycles of phase over the voxel. Additionally, due to the slab selective preparation, the re-excited signal on My is more uniformly dephased compared to the My signal prior to the echo train. Of note, the longitudinal magnetization is more broadly disturbed using the ss-MGOT method due to the slab-selective preparation.
Figure 3:
Bloch simulations of the magnetization signal immediately prior to the refocusing echo train (Point C as annotated Figure 1). In the Alsop approach, significant net magnetization is left on Mx, which is problematic as it will be recalled during the echo train leading to signal instabilities. Conversely, the Mx signal is nearly non-existent due to the spoiler pulse while the MG portion of the signal was “hidden” on the longitudinal axis prior to re-excitation.
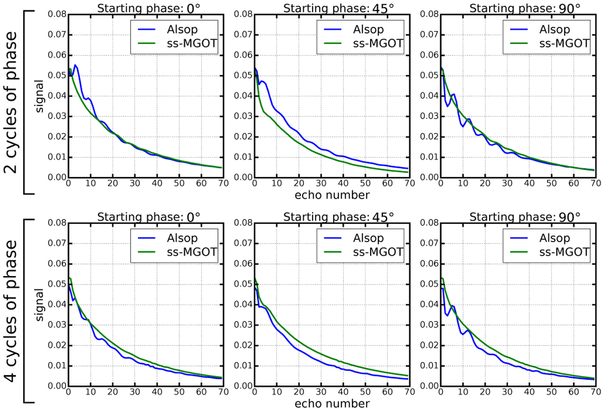
The Bloch simulation of the echo train is seen in Figure 4. Different numbers of dephasing cycles and various initial excitation RF phases are used in simulation. In all cases, the ss-MGOT sequence provides a much smoother decay than the Alsop approach. Importantly, the Alsop approach becomes more unstable as the number of dephasing cycles is decreased, yet this effect is less pronounced in the ss-MGOT echo trains. The SS-MGOT simulation suggests that two cycles of dephasing should be sufficient, while both two and four cycles cannot fully stabilize the echo train signal for the Alsop approach.
Figure 4:
Bloch simulation—including the impacts of the RF pulses—of the echo train. The simulation assumes the T1 and T2 values of muscle at 3.0T (T1 = 1300 ms and T2 = 32 ms). The initial phase is the phase of the first 90° pulse of the magnetization preparation module. By using a more aggressively tailored refocusing RF train and by spoiling the non-MG component of the signal prior to the CPMG echo train, the ss-MGOT approach provides improved signal stability.
Phantom scans demonstrate the effects of B0 inhomogeneity has on each sequence (see Figure 5). The EPI sequence shows considerable image warping stemming from the center of the phantom where the metal object is embedded. Conversely, the SS-MGOT sequence image does not display any such distortion. However, in the case of the SS-MGOT, there still remains substantial signal drop near the metal object. This is to be expected as the spectral-spatial pulse in the magnetization preparation module will fail to tip-up any spins that are particularly off-resonant, as will be the case near the implant. (A comparison of the ss-MGOT and nCPMG SS-FSE sequences on the same grid phantom is seen in Supporting Figure S3. In this supporting figure, the ss-MGOT image is considerably sharper than the nCPMG SS-FSE image while maintaining similar robustness against B0 inhomogeneities. This sharpness is quantified using a blur factor described in (35) and applied to MRI images in (36). A line plot comparison over the grid in the phase encode direction is also given.)
Figure 5:
Phantom images showing image distortion in the presence of B0 inhomogeneity. In these images, the magnetic field distortion causes the EPI image to warp consderably while the SS-MGOT image does not suffer the same effects.
The impacts on image quality of the phase of the initial excitation RF pulses and the number of dephasing/rephasing cycles for both the ss-MGOT and the Alsop sequences are seen in Figure 6(a). In this image, the ss-MGOT images show consistent contrast across each of the excitation phases. By contrast, the Alsop sequence shows artifacts in these images, which are highlighted with red arrows. The ratio images in Figure 6(b) show much more homogeneity with the ss-MGOT sequence compared to the Alsop sequence. This is quantified in the coefficient of variation values over the red ROI. Ideally, the initial phase should not impact the image. Consequently, the ratio images should have a value of 1.0 over the defined ROI (defined by the red circle). Higher coefficient of variation values over the ROI indicate differences between images.
Figure 6:
(a) T2 weighted images of an agar phantom ball where the diffusion lobes amplitudes are set to zero. In each case, the phase of the initial 90° excitation pulse was varied from 0° to 90° to demonstrate the insensitivity against the initial phase for each method. Two different versions of each sequence were tested with 2 and 4 cycles of dephasing/rephasing on Gz. (b) Ratio images between the different excitation phase images for each case are presented with the same window and level (see colorbar). Coefficients of variation are calculated for the highlighted ROI and are displayed over each respective ratio image.
Phantom scans showing the impact of the initial phase of the excitation RF pulses is seen in Figure 7. The EPI shows an average SNR of 80.30; the Alsop method shows an average SNR of 43.70; and the ss-MGOT sequence gives an average SNR of 58.94. Average ADC values are 1.907 × 10⁻³ mm2 ⋅ s−1 for EPI, 1.367 × 10⁻³ mm2 ⋅ s−1 for the Alsop sequence, and 2.015 × 10⁻³ mm2 ⋅ s−1 for ss-MGOT. In the selected region of interest, the coefficients of variation for ADC values are 2.94 for EPI, 27.0 for the Alsop sequence, and 6.35 for SS-MGOT. Thus, the EPI image shows the most homogeneous ADC values, followed closely by the ss-MGOT sequence. Conversely, the Alsop sequence shows very heterogeneous ADC values. This trend in homogeneous contrast continues in the diffusion encoded images where the EPI and ss-MGOT exhibit the most consistent contrast. The diffusion encoded image from the Alsop method does show some wavy artifacts, which likely contribute to the heterogeneity in the ADC map.
Figure 7:
Quantitative comparisons between EPI, the Alsop method, and ss-MGOT. Left column: representative diffusion-weighted images using a b-value of b = 500 s ⋅ mm−2. Middle column: ADC maps for each of the sequences. Right column: voxel-wise SNR maps for each sequence with b-value of b = 500 s ⋅ mm−2.
The ExtPI averaging phantom results are seen in Figure 8. Figure 8(a) shows the images of the squash as the b-value is increased under a 6× window. In these figures, the background noise becomes more noticeable as b-value increases at a faster rate in the magnitude averaging case. While the SNR degrades in both cases, the SNR loss is much more substantial in regions of low signal. Structural features can be detected in the center of the image, as denoted by blue arrows. These features are very subtle, and are easily obscured as the noise floor increases. In the magnitude averaging cases, these are nearly imperceptible at high b-values while they are still detectable in the ExtPI case. Figure 8(b) demonstrates the effects of a rising noise floor. This figure displays the histogram of the normalized pixel intensity values of the b = 1000 s ⋅ mm−2 image. In this histogram, the magnitude averaging reconstruction yields a higher noise floor (other b-value histograms can be seen in Supporting Figure S4). Additionally, the noise floor is quantified across all tested b-values in the line plot of the mean of the background of each image. While background noise rises in both averaging cases, it rises faster in the magnitude averaging case. Figure 8(c) shows SNR comparisons between ExtPI, magnitude averaging and no scan averaging (NEX=1) for the b = 500 s ⋅ mm−2 and b = 1000 s ⋅ mm−2 cases. In these figures, the SNR values for the b = 500 s ⋅ mm−2 are 57.75 for the ExtPI case, 50.46 for the magnitude averaging case, and 25.18 for the no averaging case. When b-value is increased to b = 1000 s ⋅ mm−2 the SNR values are 16.06 for the ExtPI case, 15.07 for the magnitude averaging case, and 7.50 for the no averaging case.
Figure 8:
Comparison of two averaging methods: magnitude averaging and averaging through ExtPI reconstruction. (a) Reconstructed images of the spaghetti squash as b-value increases are shown under 6x window for both averaging techniques. An internal structure (denoted by a blue arrow) is evident at lower b-values for both averaging techniques. However, as the b-value increases, this is obscured by noise in the magnitude averaging images. (b) A sample histogram of normalized voxel intensity values for the b = 1000 s ⋅ mm−2 image demonstrate that the noise floor is lower with ExtPI averaging. A line plot of normalized pixel mean pixel intensity in the yellow ROI shows background noise rises in both averaging cases, though the rise is slower in the ExtPI case. (c) SNR comparisons using an doped agar ball phantom are shown. ExtPI, magnitude averaging, and no averaging (NEX=1) are all compared. The mean and standard deviation for SNR values in the ROI circled in red are printed on each respective SNR map.
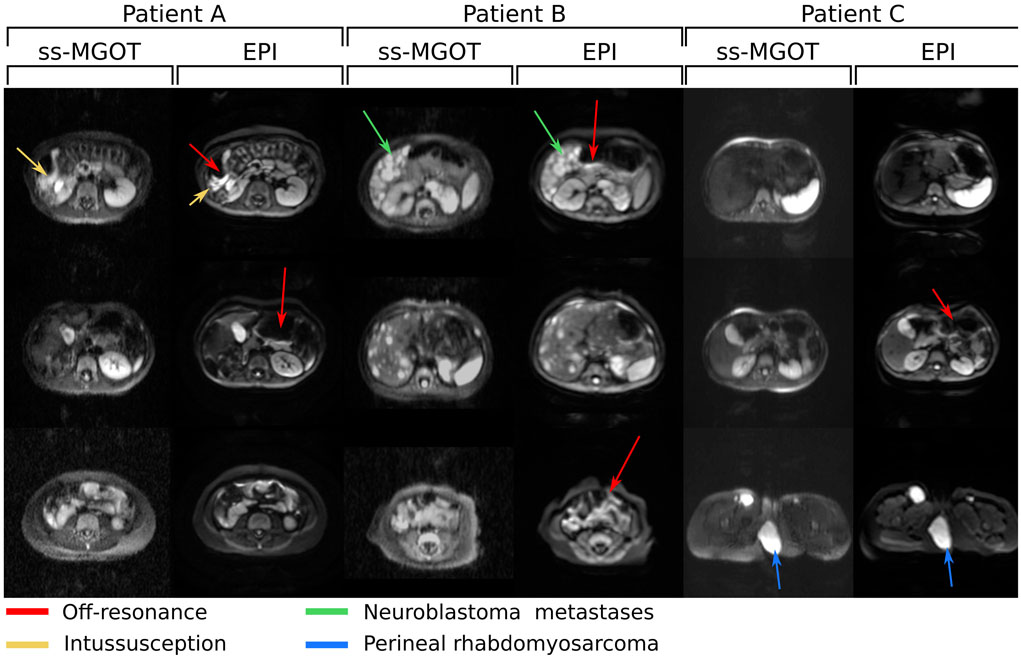
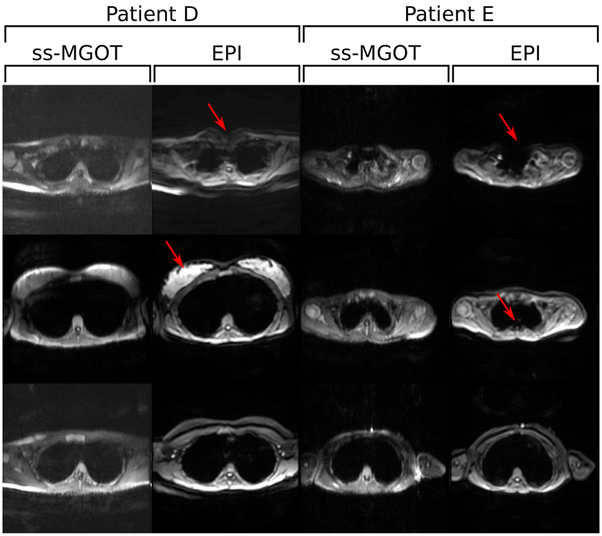
Figure 9 shows images from three clinical abdomen/pelvis in vivo cases. Figure 10 shows images from two clinical chest in vivo cases. In all cases, both the EPI and ss-MGOT sequences were scanned with b = 500 s ⋅ mm−2. Each EPI/ss-MGOT comparison is of the same slice in the body. Red arrows denote off-resonance distortion in the EPI images. In patient A, distortion caused by gas from an intussusception is observed and highlighted with a yellow arrow. In patient B, a neuroblastoma metastases in the liver is highlighted with a green arrow. In patient C, a perineal rhabdomyosarcoma is highlighted with a blue arrow. In each case, the lesion is delineated from surrounding tissue similar to the EPI images. Additionally, while EPI images suffer from B0 inhomogeneity artifacts such as signal dropout and geometric distortion, the ss-MGOT images show no such distortion, which is highlighted with red arrows across all cases.
Figure 9:
Clinical abdomen/pelvis protocol in vivo images with b = 500 s ⋅ mm−2 diffusion encoding. Three different sets of patient images are shown. EPI and ss-MGOT images are compared at various slice locations. In these images, the red arrows highlight areas of off-resonance seen in the EPI images. The yellow arrow highlights areas of distortion caused by bowel gas from an intussusception. The green arrow highlights a neuroblastoma metastases in the liver. The blue arrow highlights a perineal rhabdomyosarcoma.
Figure 10:
Clinical chest protocol in vivo images with b = 500 s ⋅ mm−2 diffusion encoding. Two different sets of patient images are shown. EPI and ss-MGOT images are compared at various slice locations. In these images, the red arrows highlight areas of off-resonance seen in the EPI images.
Discussion
The ss-MGOT sequence presented here is a method to acquire slice-selective diffusion encoded SS-FSE images that are free from geometric distortion as well as the artifacts typically observed when CPMG is violated. The ss-MGOT pulse sequence is an improvement of the Alsop sequence (12). The ss-MGOT sequence is demonstrated to be robust in simulation and phantom experiments.
One important trade-off in using a magnetization-prepared diffusion-weighted SSFSE sequence such as the Alsop or SS-MGOT approach is the loss of one half of the available signal through the dephasing step. While scan averaging can increase SNR, this will limit the applications for which this sequence will be useful. One possible example where this approach would be valuable is in a multi-shot sequence with an appropriate reconstruction to account for motion similar to what was done in (24). In this case, the multi-shot acquisition will reduce the echo train and the amount of T2 signal decay throughout the echo train.
The other tested quantitative parameter was a comparison of ADC values against the EPI reference standard in the agar ball phantom. The ADC values were higher than the values derived from the EPI scan, though the homogeneity of the ADC map was much better than the Alsop method. The higher ADC values in SS-FSE sequences is an open question, and similar trends have been seen elsewhere (9, 13). In this case, one possible difference is the additional dephasing/rephasing area, which adds additional b-value to the sequence that is not currently being accounted for during the ADC computation. However, in previous Bloch simulations not reported here, these additional gradients impart only marginal diffusion weighting, particularly in the two cycles of dephasing case. In addition, registration between T2 (i.e., b = 0 s ⋅ mm−2) and diffusion encoded images can be problematic in abdominal imaging, by consequence our institution generally does not calculate ADC maps but relies simply on interpreting the contrast in the diffusion encoded images.
The presented ExtPI averaging technique proved to a robust and simple method to reconstruct multi-NEX images. This approach combines the robustness of magnitude averaging against object phase with the SNR gains achieved in complex averaging, particularly with background noise suppression.
In vivo images suggest that this is a viable tool in the clinic with lesions and organs similarly delineated from surrounding tissue. While EPI does provide better SNR performance as expected—as quantified in phantom data—it is subject to off-resonance induced distortion artifacts. Conversely, the ss-MGOT images generally show lower SNR—as quantified in phantom data—but do not show geometric distortion artifacts. Future studies with large samples sizes are needed for a systematic comparison between EPI and the proposed ss-MGOT sequences for a more deterministic comparison of SNR, image sharpness, image quality, and contrast between various diffusion encoding techniques.
Conclusion
In this article, we present a novel diffusion encoded SS-FSE sequence and reconstruction technique. The proposed pulse sequence is particularly well-suited for imaging areas of off-resonance. The proposed reconstruction averaging technique is suitable for cases where SNR is particularly low and the noise floor would otherwise dominate. Both the sequence as well as the reconstruction are simulated and validated in phantom as well as in body imaging cases. These techniques perform favorably against the current clinical standard, particularly in areas with severe off-resonance.
Supplementary Material
Supporting Figure S1: Comparison of nCPMG SS-FSE and ss-MGOT echo train signal and point spread functions (PSF). a) An echo train signal is simulated through Bloch simulation. Relaxation time constants are chosen to represent muscle at 3T, similar to other Bloch simulations in this work. Because of the variable flip angle scheme and the shorter effective echo spacing (as double phase encoding is nonessential for ss-MGOT), the ss-MGOT signal remains flatter throughout the echo train and sees less decay than the nCPMG SS-FSE sequence. b) The calculated point spread functions based on the echo train modulation are plotted for both nCPMG SS-FSE and ss-MGOT. The nCPMG SS-FSE PSF is considerably broader than the ss-MGOT PSF. The calculated full width at half maximum (FWHM) is 3.23 times larger for nCPMG SS-FSE compared to ss-MGOT. Consequently, the nCPMG SS-FSE sequence should produce much more phase encode direction blurring compared to the ss-MGOT sequence.
Supporting Figure S2: Bloch simulations of the magnetization signal throughout various points in the Alsop and ss-MGOT pulse sequences. For reference as to where these time points occur in the sequence, please see Figure 1. Point A: the signal after the 180° spin echo pulse in the diffusion preparation module. Both sequences give similar signals, though the ss-MGOT method uses a slab selective preparation to ensure uniform preparation across the thinner excited slice used in imaging. Point B: the signal immediately after the first dephasing gradient which introduces 2 cycles of phase modulation across the excited slice. Both sequences give similar signals, but the wider slab used in ss-MGOT gives a more uniform dephasing across the slice to be imaged than the Alsop approach. Point C: the magnetization after the spoiling portion (for the Alsop method this occurs after the 90° tip up pulse whereas for the ss-MGOT approach this occurs after the 90° re-excitation immediately prior to the echo train portion of the sequence). In the Alsop approach, significant net magnetization is left on Mx, which is problematic as it will be recalled during the echo train leading to signal instabilities. Conversely, the Mx signal is nearly non-existent due to the spoiler pulse while the MG portion of the signal was “hidden” on the longitudinal axis prior to re-excitation.
Supporting Figure S3: a) Grid phantom images of the grid phantom with the metal should implant are compared for nCPMG SS-FSE and ss-MGOT. These images show that the nCPMG SS-FSE images show more blur in the phase encode direction when compared to the ss-MGOT sequence. Over an ROI (indicated by a red box), the blur factor for both images are calculated. The blur factor is described in (35) and applied to MRI in (36). The blur factor can range from 0 to 1.0, with higher values indicating more blurring. In these images, the nCPMG SS-FSE image has a higher blur factor than the ss-MGOT image. b) The blurring can also be seen in the line profiles (sampled from the figure as indicated by the yellow line). In this image the ss-MGOT image clearly shows the grid lines, where the nCPMG SS-FSE image does not show the grid lines as clearly.
Supporting Figure S4: Histogram comparison of the ExtPI averaging and magnitude averaging of squash phantom images. These histograms from each image demonstrate a rapidly increasing noise floor in the magnitude averaging case compared to the ExtPI reconstruction.
Acknowledgments
The authors thank Bob Dougherty at the Stanford Center of Cognitive Neurobiological Imaging for scan time to debug the sequence and verify many of the results presented here. The authors also thank David Alsop for the helpful discussion and insight into his pulse sequence.
This work was supported by NIH P41 EB015891, NIH R01 EB009690, NSF DGE-1147470, and GE Medical Systems.
Footnotes
Supporting Information
Additional Supporting Information may be found in the online version of this source.
References
- [1].Hennig J, Nauerth A, Friedburg H. RARE imaging: a fast imaging method for clinical MR. Magn. Reson. Med 1986; 3:823–833. [DOI] [PubMed] [Google Scholar]
- [2].Carr HY, Purcell EM. Effects of diffusion on free precession in nuclear magnetic resonance experiments. Physical Review 1954; 94:630. [Google Scholar]
- [3].Meiboom S, Gill D. Modified spin-echo method for measuring nuclear relaxation times. Review of Scientific Instruments 1958; 29:688–691. [Google Scholar]
- [4].Stejskal EO, Tanner JE. Spin diffusion measurements: spin echoes in the presence of a time-dependent field gradient. The journal of chemical physics 1965; 42:288–292. [Google Scholar]
- [5].Zur Y, Wood M, Neuringer L. Spoiling of transverse magnetization in steady-state sequences. Magnetic Resonance in Medicine 1991; 21:251–263. [DOI] [PubMed] [Google Scholar]
- [6].LeRoux P. Non-CPMG fast spin echo with full signal. Journal of Magnetic Resonance 2002; 155:278–292. [DOI] [PubMed] [Google Scholar]
- [7].LeRoux P, McKinnon G, Yen YF, Fernandez B. Realignment capability of the nCPMG sequence. Journal of Magnetic Resonance 2011; 211:121–133. [DOI] [PubMed] [Google Scholar]
- [8].Gibbons EK, LeRoux P, Pauly JM, Kerr AB. Slice profile effects on ncpmg ss-fse. Magnetic Resonance in Medicine 2017;. [DOI] [PMC free article] [PubMed] [Google Scholar]
- [9].Gibbons E, LeRoux P, Vasanawala S, Pauly J, Kerr A. Body diffusion weighted imaging using non-CPMG fast spin echo. IEEE Trans. Med. Imag 2017; 36:549–559. [DOI] [PMC free article] [PubMed] [Google Scholar]
- [10].Gibbons E, LeRoux P, Vasanawala S, Pauly J, Kerr A. Accelerated body ncpmg ss-fse diffusion weighted imaging. In: Proceedings of the 25th Annual Meeting of ISMRM,, Honolulu, Hawaii, USA, 2015. p. 3514. [Google Scholar]
- [11].Norris DG, Börnert P, Reese T, Leibfritz D. On the application of ultra-fast RARE experiments. Magn. Reson. Med 1992; 27:142–164. [DOI] [PubMed] [Google Scholar]
- [12].Alsop DC. Phase insensitive preparation of single-shot RARE: Application to diffusion imaging in humans. Magn. Reson. Med 1997; 38:527–533. [DOI] [PubMed] [Google Scholar]
- [13].Zhang Q, Coolen BF, Versluis MJ, Strijkers GJ, Nederveen AJ. Diffusion-prepared stimulated-echo turbo spin echo (DPsti-TSE): An eddy current-insensitive sequence for three-dimensional high-resolution and undistorted diffusion-weighted imaging. NMR in Biomedicine 2017;. [DOI] [PubMed] [Google Scholar]
- [14].Pipe JG, Farthing VG, Forbes KP. Multishot diffusion-weighted FSE using PRO-PELLER MRI. Magn. Reson. Med 2002; 47:42–52. [DOI] [PubMed] [Google Scholar]
- [15].Deng J, Miller FH, Salem R, Omary RA, Larson AC. Multishot diffusion-weighted PROPELLER magnetic resonance imaging of the abdomen. Investigative Radiology 2006; 41:769–775. [DOI] [PubMed] [Google Scholar]
- [16].Deng J, Omary RA, Larson AC. Multishot diffusion-weighted SPLICE PROPELLER MRI of the abdomen. Magn. Reson. Med 2008; 59:947–953. [DOI] [PubMed] [Google Scholar]
- [17].Jenniskens H, van den Brink J, Folkers J, van Yperen G. Optimising the image quality of diffusion sensitised turbo spin echo sequences In: Proc. Intl. Soc. Mag. Reson. Med, Philadelphia, Pennsylvania, 1999. [Google Scholar]
- [18].Lustig M, Santos J, Pauly JM. A super-fov method for rapid ssfp banding artifact reduction. In: Proceedings of the 13th Annual Meeting of ISMRM, Miami, Florida, 2005. p. 504. [Google Scholar]
- [19].Jou T “Alternating-SSFP for whole-brain functional magnetic resonance imaging”. PhD thesis, Stanford University, 2016. [Google Scholar]
- [20].Buehrer M, Pruessmann KP, Boesiger P, Kozerke S. Array compression for MRI with large coil arrays. Magnetic Resonance in Medicine 2007; 57:1131–1139. [DOI] [PubMed] [Google Scholar]
- [21].Zhang T, Pauly JM, Vasanawala SS, Lustig M. Coil compression for accelerated imaging with cartesian sampling. Magnetic Resonance in Medicine 2013; 69:571–582. [DOI] [PMC free article] [PubMed] [Google Scholar]
- [22].Pauly J, LeRoux P, Nishimura D, Macovski A. Parameter relations for the Shinnar-Le Roux selective excitation pulse design algorithm. IEEE Trans. Med. Imag 1991; 10:53–65. [DOI] [PubMed] [Google Scholar]
- [23].Roux PL, Hinks RS. Stabilization of echo amplitudes in FSE sequences. Magnetic Resonance in Medicine 1993; 30:183–190. [DOI] [PubMed] [Google Scholar]
- [24].Zhang Z, Zhang B, Li M, Liang X, Chen X, Liu R, Zhang X, Guo H. Multishot cartesian turbo spin-echo diffusion imaging using iterative pocsmuse reconstruction. Journal of Magnetic Resonance Imaging 2016;. [DOI] [PubMed] [Google Scholar]
- [25].Busse RF, Hariharan H, Vu A, Brittain JH. Fast spin echo sequences with very long echo trains: design of variable refocusing flip angle schedules and generation of clinical T2 contrast. Magnetic resonance in medicine 2006; 55:1030–1037. [DOI] [PubMed] [Google Scholar]
- [26].Tamir JI, Uecker M, Chen W, Lai P, Alley MT, Vasanawala SS, Lustig M. T2 shuffling: Sharp, multicontrast, volumetric fast spin-echo imaging. Magnetic Resonance in Medicine 2017; 77:180–195. [DOI] [PMC free article] [PubMed] [Google Scholar]
- [27].Gibbons EK, LeRoux P, Vasanawala SS, Pauly JM, Kerr AB. Robust self-calibrating nCPMG acquisition: Application to body diffusion-weighted imaging. IEEE Trans. Med. Imag 2017;. [DOI] [PMC free article] [PubMed] [Google Scholar]
- [28].Pruessmann KP, Weiger M, Scheidegger MB, Boesiger P et al. SENSE: sensitivity encoding for fast MRI. Magn. Reson. Med 1999; 42:952–962. [PubMed] [Google Scholar]
- [29].Uecker M, Lai P, Murphy MJ, Virtue P, Elad M, Pauly JM, Vasanawala SS, Lustig M. ESPIRiT an eigenvalue approach to autocalibrating parallel mri: Where SENSE meets GRAPPA. Magn. Reson. Med 2014; 71:990–1001. [DOI] [PMC free article] [PubMed] [Google Scholar]
- [30].Kerr AB, Larson PE, Lustig M, Cunningham CH, Chen AP, Vigneron DB, Pauly JM. Multiband spectral-spatial design for high-field and hyperpolarized C-13 applications In: Proc. Intl. Soc. Mag. Reson. Med, Toronto, Canada, 2008. p. 226. [Google Scholar]
- [31].Larson PE, Kerr AB, Chen AP, Lustig MS, Zierhut ML, Hu S, Cunningham CH, Pauly JM, Kurhanewicz J, Vigneron DB. Multiband excitation pulses for hyperpo-larized 13 C dynamic chemical-shift imaging. Journal of Magnetic Resonance 2008; 194:121–127. [DOI] [PMC free article] [PubMed] [Google Scholar]
- [32].Conolly S, Nishimura D, Macovski A, Glover G. Variable-rate selective excitation. Journal of Magnetic Resonance (1969) 1988; 78:440–458. [Google Scholar]
- [33].Kwee TC, Takahara T, Koh DM, Nievelstein RA, Luijten PR. Comparison and reproducibility of ADC measurements in breathhold, respiratory triggered, and free-breathing diffusion-weighted MR imaging of the liver. Journal of Magnetic Resonance Imaging 2008; 28:1141–1148. [DOI] [PubMed] [Google Scholar]
- [34].Taouli B, Koh DM. Diffusion-weighted MR imaging of the liver. Radiology 2009; 254:47–66. [DOI] [PubMed] [Google Scholar]
- [35].Crete F, Dolmiere T, Ladret P, Nicolas M. The blur effect: perception and estimation with a new no-reference perceptual blur metric In: Proceedings of SPIE: Human Vision and Electronic Imaging, San Jose, California, 2007. p. 64920. [Google Scholar]
- [36].Iyer SK, Tasdizen T, Burgon N, Kholmovski E, Marrouche N, Adluru G, DiBella E. Compressed sensing for rapid late gadolinium enhanced imaging of the left atrium: A preliminary study. Magnetic Resonance Imaging 2016; 34:846–854. [DOI] [PMC free article] [PubMed] [Google Scholar]
Associated Data
This section collects any data citations, data availability statements, or supplementary materials included in this article.
Supplementary Materials
Supporting Figure S1: Comparison of nCPMG SS-FSE and ss-MGOT echo train signal and point spread functions (PSF). a) An echo train signal is simulated through Bloch simulation. Relaxation time constants are chosen to represent muscle at 3T, similar to other Bloch simulations in this work. Because of the variable flip angle scheme and the shorter effective echo spacing (as double phase encoding is nonessential for ss-MGOT), the ss-MGOT signal remains flatter throughout the echo train and sees less decay than the nCPMG SS-FSE sequence. b) The calculated point spread functions based on the echo train modulation are plotted for both nCPMG SS-FSE and ss-MGOT. The nCPMG SS-FSE PSF is considerably broader than the ss-MGOT PSF. The calculated full width at half maximum (FWHM) is 3.23 times larger for nCPMG SS-FSE compared to ss-MGOT. Consequently, the nCPMG SS-FSE sequence should produce much more phase encode direction blurring compared to the ss-MGOT sequence.
Supporting Figure S2: Bloch simulations of the magnetization signal throughout various points in the Alsop and ss-MGOT pulse sequences. For reference as to where these time points occur in the sequence, please see Figure 1. Point A: the signal after the 180° spin echo pulse in the diffusion preparation module. Both sequences give similar signals, though the ss-MGOT method uses a slab selective preparation to ensure uniform preparation across the thinner excited slice used in imaging. Point B: the signal immediately after the first dephasing gradient which introduces 2 cycles of phase modulation across the excited slice. Both sequences give similar signals, but the wider slab used in ss-MGOT gives a more uniform dephasing across the slice to be imaged than the Alsop approach. Point C: the magnetization after the spoiling portion (for the Alsop method this occurs after the 90° tip up pulse whereas for the ss-MGOT approach this occurs after the 90° re-excitation immediately prior to the echo train portion of the sequence). In the Alsop approach, significant net magnetization is left on Mx, which is problematic as it will be recalled during the echo train leading to signal instabilities. Conversely, the Mx signal is nearly non-existent due to the spoiler pulse while the MG portion of the signal was “hidden” on the longitudinal axis prior to re-excitation.
Supporting Figure S3: a) Grid phantom images of the grid phantom with the metal should implant are compared for nCPMG SS-FSE and ss-MGOT. These images show that the nCPMG SS-FSE images show more blur in the phase encode direction when compared to the ss-MGOT sequence. Over an ROI (indicated by a red box), the blur factor for both images are calculated. The blur factor is described in (35) and applied to MRI in (36). The blur factor can range from 0 to 1.0, with higher values indicating more blurring. In these images, the nCPMG SS-FSE image has a higher blur factor than the ss-MGOT image. b) The blurring can also be seen in the line profiles (sampled from the figure as indicated by the yellow line). In this image the ss-MGOT image clearly shows the grid lines, where the nCPMG SS-FSE image does not show the grid lines as clearly.
Supporting Figure S4: Histogram comparison of the ExtPI averaging and magnitude averaging of squash phantom images. These histograms from each image demonstrate a rapidly increasing noise floor in the magnitude averaging case compared to the ExtPI reconstruction.


