

Abstract
Extending on earlier work, trends in bovine tuberculosis (bTB) from 2003 to 2015 are described for the countries of the UK and the Republic of Ireland using standardised definitions and measures. Based on measures of animal and herd incidence, there remains a stable situation of extremely low prevalence in Scotland and the Low Risk Area of England, and a higher but ongoing reduction in prevalence in the Republic of Ireland. In Northern Ireland, there has been a rising bTB trend during 2010–2015, although not to levels experienced during 2002–2004. In the High Risk Area and Edge Area of England during 2010–2015, the rising bTB trends have continued but with some recent evidence of stabilisation. In Wales, prevalence has fallen subsequent to a peak in 2008. The paper considers country-level differences in the light of key policy changes, which are presented in detail. This work is unique, and will assist policymakers when critically evaluating policy options for effective control and eradication. Ongoing updates of this analysis would be useful, providing an evidence base for country-level comparison of bTB trends into the future. The use of multivariable analytical methods should be considered, but will rely on substantial sharing of raw data across the five countries.
Keywords: bovine tuberculosis, Republic of Ireland, United Kingdom, epidemiology, eradication
Introduction
Control of bovine tuberculosis (bTB, caused by infection with Mycobacterium bovis) is a major global challenge. Cattle are the primary host species, however, a number of other species, including the Eurasian badger (Meles meles), are important contributors to the epidemiology of M bovis in cattle. bTB eradication has proved particularly challenging in the UK (encompassing the countries of England, Northern Ireland (NI), Scotland and Wales) and the Republic of Ireland (subsequently termed Ireland). Current control measures to prevent transmission from animals to the human population are generally effective, and zoonotic M bovis infection in the UK and Ireland has only occurred in a few isolated incidents and as sporadic events.1–4 During 2002–2014, most cases in England, Wales and NI were in people greater than 65 years of age and born in the UK. Further, consumption of unpasteurised milk was identified as a risk factor among 74 per cent of patients for M bovis acquisition.1
In each of these countries, compulsory bTB eradication programmes commenced in the 1950s and are ongoing. Although each programme conforms to common EU legislation relating to surveillance and control measures, principally Directives 64/432/EEC5 and 78/52/EEC,6 country-level differences in programme strategy and management have emerged, reflecting political, geographical and other differences.7 Each programme is underpinned by ongoing scientific research and there is an increasingly detailed understanding of opportunities and constraints to progress.
Abernethy et al investigated bTB trends in the UK and Ireland from 1995 to 2010.7 In this earlier work, for the first time, standardised definitions and measures of bTB frequency and distribution were developed, which allowed progress of the disease eradication programmes to be evaluated across the five different countries. The work highlighted differences in cattle demography, bTB programme structure and test results, particularly between the island of Ireland (Ireland and NI) and Great Britain (GB: England, Scotland and Wales). During this period, bTB trends indicated a stable situation of very low prevalence in Scotland and, over most of the period, a rising prevalence in England and Wales. The prevalence in Ireland declined, while NI experienced both a rise and fall. The authors highlighted several issues requiring further consideration. First, they proposed a review of the epidemiological basis of each of the bTB eradication programmes, and of underpinning legislation, to ensure that they are fit for purpose to adequately address risk factors for bTB. Secondly, they suggested that observed differences be formally explored to maximise the effectiveness and efficiency of each of the country programmes.
The current analysis is an extension of the earlier work by Abernethy et al.7 Building on this earlier progress, we have extended both the period of interest (now to 2015) and measures of progress, now also incorporating the herd incidence density rate plus measures relevant to the management of bTB episodes, including frequency, duration and severity. As previously, we have sought to draw on the differing experiences and perspectives from each of the five countries. The objective of the current study is to further describe bTB trends in the UK and Ireland, during 2003–2015.
Materials and methods
Glossary of terms
A glossary of terms is presented in table 1.
Table 1.
Glossary of terms
| Abattoir case | A bovine animal, slaughtered under routine farm management, in which bTB was suspected following detection of suspicious lesions at slaughter and subsequently confirmed by laboratory testing (ie, histological or bacteriological techniques). In GB, only bacteriological confirmation is used. |
| Active herd | A herd engaged in cattle production (milk, beef, breeding) |
| Apparent animal prevalence | The sum of test reactors and abattoir cases as a percentage of the total cattle population |
| Apparent herd incidence | Percentage of active herds, unrestricted on January 1, with at least one test reactor or abattoir case during a defined period (one year for annual herd incidence). See standardised herd incidence (SHI) for adjustments due to differences in mean herd size between countries. |
| Apparent herd prevalence | Percentage of active herds with at least one test reactor or abattoir case during a defined period (one year for annual herd prevalence). See standardised herd prevalence (SHP) for adjustments due to differences in mean herd size between countries. |
| bTB | ‘Bovine tuberculosis’, namely infection of cattle with Mycobacterium bovis |
| bTB episode | Synonymous with bTB restriction |
| bTB-positive animal | Animal removed from a herd following a positive reaction to the skin test, or an abattoir case |
| bTB reactor | A bovine with a positive tuberculin skin (either standard or non-standard reactor) or interferon-γ blood test result that was removed from the herd. Animals with inconclusive results on two consecutive skin tests were included once this became policy (ie, from 2009 in Wales and 2010 in England, Scotland and NI). |
| bTB restriction | A period during which out-movement of cattle is prohibited, other than to slaughter, due to presence of one or more reactors or abattoir cases. Synonymous with ‘bTB episode’. |
| Confirmed abattoir case | An abattoir case from which tissue samples were positive for M bovis on histology or bacteriology. In GB, histology on its own is not confirmatory. |
| Confirmed reactor | A reactor to the skin test (or interferon-γ test in the UK) and in which bTB-like lesions were detected at postmortem examination or from which tissue samples were positive for M bovis on histology or bacteriology. In GB, histology on its own is not confirmatory. |
| Cumulative apparent animal prevalence | The animal-level prevalence used in the multiple year maps and calculated as the sum of reactors per hexagon divided by the sum of the mean population per herd per hexagon, each during a four-year period |
| Cumulative herd risk | The herd-level prevalence used in the multiple year maps and calculated as the percentage of herds in each hexagon with at least one bTB-positive animal in the four-year period |
| Herd incidence density rate | The total number of new bTB episodes that started during the year (the numerator) divided by ‘the time at risk’ (period in the year when herd was not under bTB restriction, denominator) |
| Herd size | Herd size was calculated as the mean number of cattle tested at all whole-herd tests during the period in question. |
| Interferon-γ test | Diagnostic blood test that uses an ELISA to detect interferon-γ, a component of cell-mediated immune response to M bovis. The interferon-γ test is a supplementary antemortem test for bTB, generally used in confirmed bTB episodes, in conjunction with the skin test. |
| Interepisode interval | The period between the start of the current restriction and the end of the previous restriction |
| Non-standard reactor | A bovine animal slaughtered as a reactor to the SICTT test, where the reaction to bovine tuberculin was 4 mm or less than the reaction to avian tuberculin |
| OTF | Officially bTB free, as defined in Council Directive 64/432/EEC |
| OTFS | OTF status suspended, due to unresolved or as yet undetermined status pending a decision as to the true bTB status of the herd, or where all bTB-positive animals have no lesions or positive bacteriology. As defined in Council Directive 64/432/EEC. |
| OTFW | OTF status withdrawn, due to presence of bTB in the herd. As defined in Council Directive 64/432/EEC. |
| Prolonged restriction | By definition, a restriction of >550 days in duration |
| Positive herd | A herd under bTB restriction |
| Restricted herd | A herd under bTB restriction |
| Restriction length | The number of days between the start and end of the current restriction |
| Short interepisode interval | By definition, an interepisode interval of ≤365 days |
| Six-month post-restriction test | The whole-herd test conducted six months after OTF herd status has been reinstated |
| Skin test | The Single Intradermal Comparative Cervical Tuberculin Test (variously abbreviated as SICTT or SICCT), which is the primary antemortem test for bTB in the UK and the Republic of Ireland |
| Standard reactor | A bovine animal showing a positive response to the skin test where the reaction to bovine tuberculin was more than 4 mm greater than the reaction to avian tuberculin |
| Standardised herd incidence (SHI) | As for apparent herd incidence, but adjusted for differences between countries in tested herd size by direct standardisation, using the sum of cattle populations across countries as the reference population |
| Standardised herd prevalence (SHP) | As for apparent herd prevalence, but adjusted for differences between countries in tested herd size by direct standardisation, using the sum of cattle populations across countries as the reference population |
| Study herd | Different definitions were used depending on the context, either ‘Extending earlier measures of bTB frequency and recurrence’ or ‘New descriptive statistics: frequency, duration and severity of bTB restrictions’. See text for further details. |
bTB, bovine tuberculosis.
Data
Data were obtained for the period 2003–2015. In NI, bTB test data were extracted from the Animal and Public Health Information System.8 In Ireland, bTB test data were obtained from the national database (Nixdorf for data prior to February 2005, the Animal Health Computer Information System subsequently). Prior to analysis, these data were transformed into a bTB episode file, using methods as described previously9 and as explained in detail below. In GB, bTB testing and postmortem data were obtained from the Animal and Plant Health Agency’s (APHA) disease management system (Sam), and movement data were obtained from the British Cattle Movement Service’s (BCMS) Cattle Tracing System (CTS) to inform activity of herds.
Data analysis
General
Standardised case definitions were developed following detailed discussion within the project team, cognisant of country-level differences in data collection, management and interpretation. Some of these definitions had been agreed previously,7 and new measures have since been defined. Country-level summary bTB statistics were then calculated separately in Belfast (for NI), Dublin (for Ireland) and Weybridge (for GB: England, Scotland and Wales). For the period of interest (2003–2015), we calculated multiannual and annual summary statistics for all study herds, and by year, herd size and (in England) by risk area. The risk areas in England are geographically defined according to the nature of the bTB epidemic. In this paper, we present by the geographically defined areas throughout 2003–2015, even though the risk areas did not come into active use, with area-specific strategic objectives and control policies, until January 2013.
These data were then collated for comparison and presentation. A range of software were used, including SAS V.9.3 (in Ireland), SQL (in GB) and Microsoft Access (Microsoft, Redmond, WA, USA, in NI and GB) and StataIC V.12 (in NI).
Extending earlier measures of bTB frequency and recurrence
We used a number of summary statistics exactly as described previously by Abernethy et al,7 including standardised herd prevalence (SHP), standardised herd incidence (SHI), apparent herd prevalence, percentage of new bTB episodes (unrestricted on January 1 that were subsequently restricted with bTB) that were detected by abattoir inspection and percentage of herds positive at the six-month post-restriction test.
In these calculations, study herds included all herds considered to be actively holding or trading cattle at the start of each year during the study period, as per the following definitions:
- That met at least two of the following criteria (England, Scotland, Wales):
- The herd was considered to be active according to administration dates at the start of the year.
- The herd had a bTB test, a marked exempt test (a scheduled routine test that does not have to be performed because the herd is deemed low risk and therefore exempt from testing; in Scotland only), or an abattoir case during the study year or within 15 to 51 months prior to the study year depending on its area testing interval.
- The farm (which may include a herd or herds over more than one location) had cattle in both the year of interest and the previous year according to the BCMS CTS.
That presented cattle for bTB testing in the previous year or through which cattle moved in the previous two years (NI).
In which cattle were tested during the year or otherwise within the 15 months prior to January 1 of that year (Republic of Ireland).
In the previous study,7 trends were described during 1995–2010. Here, these measures were updated to incorporate data from 2011 to 2015.
In addition, we calculated the herd incidence density rates during each year of interest as the total number of new bTB episodes that started during the year (the numerator) divided by ‘the time at risk’ (denominator). The time at risk was the sum of all time periods for all herds within the year of interest with the exception of periods of herd restriction (bTB episodes) as a consequence of bTB infection. Herds that were rendered inactive or going out of business during the year contributed to the time at risk for the full year. The herd incidence density rate was calculated as numerator/(denominator/365)*100, and expressed as restrictions per 100 herd-years at risk.
New descriptive statistics: frequency, duration and severity of bTB restrictions
A different definition for study herd was used for this aspect of the work. In all countries, a study herd included all herds with at least one test (any test: animal, part herd, full herd (in Scotland, also marked exempt test)) during each of the following periods: 2002–2005 (2001–2005 in England, Scotland and Wales on account of the foot and mouth disease epidemic), 2006–2010, 2011–2015, thus representing long established and consistently active herds.
A bTB episode is considered to encompass the period of herd restriction triggered by the discovery of infection, either as a bTB reactor or an abattoir case. Episodes are triggered either by field surveillance (commencing at the time of the disclosing test) or abattoir surveillance (commencing at the time that the abattoir lesion is disclosed), resulting in officially bTB Free (OTF) status being either suspended (unresolved or as yet undetermined status pending a decision as to the true bTB status of the herd) or withdrawn (OTFW, presence of bTB in the herd). An episode ends once OTF status is restored and the herd is eligible to trade. In the different countries, the period of herd restriction was calculated as follows:
In NI, a bTB episode is defined as a period of herd restriction during which infection is discovered either as a bTB skin reactor or an abattoir case. Episodes are initiated at the date a herd loses its OTF status and end at the point their OTF status is reinstated, which is concurrent with the herd eligibility to trade and in the large majority of cases no more than a few days after the clearing test.
In Ireland, a bTB episode begins when a herd loses its OTF status due to either a bTB skin reactor(s) or an abattoir case and ends following two clear consecutive bTB skin tests, with a minimum of a 60-day interval, the second of which must be carried out at a minimum of four months after removal of the last positive animal from the herd. Details of how the episode data were compiled are outlined by Gallagher et al 9 (in the online supplementary material of that paper). For episodes triggered by abattoir surveillance the date of first full-herd test is recorded, whereas the date of lesion disclosure was not available for all episodes. Therefore, a median time between the slaughter date of the positive animal and the first subsequent full-herd bTB test (so-called factory lesion test) was calculated each year for episodes where this information was available. For all episodes that were triggered by abattoir surveillance, the start of each episode was estimated as the date of the first full-herd test less this median time, appropriate to the year in question.
In GB, bTB episodes start on the date a herd loses its OTF status following detection of a skin test reactor or abattoir case, and end when a TB10 legal notice is served to end restrictions and restore OTF herd status. The date of service of the TB10 notice can be recorded on the APHA Sam system any time from a few days to much longer after the clearing test, either due to administrative delays or the need for evidence that cleansing and disinfection of the infected premises has taken place. To achieve alignment with Ireland and NI, which mainly lift restrictions at the clearing test, the clearing test date has been used in GB where the restriction appears to have ended with this expected clear test, otherwise the official TB10 has been used. For the study herds from 2002, 95 per cent of the episode end dates were either adjusted to the clearing test or were already officially set to the clearing test (88.5 per cent adjusted).
Table 2 outlines the study population, the study period and the restriction of interest that were used when calculating measures of restriction frequency, duration and severity. In this paper, a prolonged restriction length was defined as more than 550 days and a short interepisode interval as up to 365 days.
Table 2.
Measures of restriction frequency, duration and severity, including the relevant study population, study period and restriction(s) of interest. See glossary (table 1) for definition of terms
| Measure | Study population | Study period | Restriction(s) of interest | ||||
| All study herds | Study herds with a restriction starting during the study period | Study herds with a restriction ending during the study period | All restrictions | All restrictions starting during the study period | All restrictions ending during the study period | ||
| Frequency | |||||||
| Number of new restrictions | |||||||
| Over the full 13-year period | ✔ | The full 13-year period | ✔ | ||||
| Each year | ✔ | Each year | ✔ | ||||
| Interepisode interval (IEI)* | |||||||
| IEI | ✔ | Each year | ✔† | ||||
| % IEI≤365 days | ✔ | Each year | ✔† | ||||
| Duration | |||||||
| Restriction length‡ | |||||||
| Restriction length | ✔ | Each year | ✔ | ||||
| % Restriction≥550 days | ✔ | Each year | ✔ | ||||
| Severity | |||||||
| Total number of reactors and abattoir cases detected during the restriction§ | ✔ | Each year | ✔ | ||||
*The IEI was not calculated for the first restriction during the study period. If the end of the last restriction is more than 730 days prior to the start of the study period (January 1, 2003), the days contributing to the interepisode interval prior to 2003 will be left-censored at 730 days (ie, January 1, 2001).
†The first restriction, if there is more than one during the study period.
‡In Northern Ireland, if the restriction started prior to January 1, 2001, the restriction length was left censored at January 1, 2001, in GB and Ireland no censoring was applied.
§Reactors and abattoir cases detected prior to January 1, 2003 were not included. In Northern Ireland prior to this date, it was difficult to accurately allocate them to an individual restricted period.
Mapping
The techniques used to generate maps in this study were identical to methodology described previously.7 These methods were established in an earlier collaborative exercise between the Republic of Ireland and NI.10 As described in Abernethy et al’s7 study, GB has a National Grid projection separate from that of the island of Ireland, thus a map of the latter was transformed into World Geodetic System 84 format and then reprojected into British National Grid format. This caused a very slight distortion in the west/northwest of Ireland and, for this reason, a north arrow and graticule reference are not included in the maps. For aggregated spatial data, a uniform surface of 1542 hexagons, each with an effective diameter of 20 km, was created over the area of GB and the island of Ireland, using a custom script in ArcGIS V.10.3 (ESRI, Redlands, California, USA). All farm points were then associated with the hexagon in which they were contained using a point in polygon analysis. Thereafter, animal and herd-level data for all farms were summarised for each hexagon, enabling the creation of thematic maps.
For the earlier measures of bTB frequency and recurrence, updated maps were created using the original methodologies to enable a comparison between the previous two time periods presented in the manuscript by Abernethy et al.7 The maps for the new descriptive statistics (frequency, duration and severity) are all drawn from the study population as described in table 2, except that some denominators were adjusted to represent the positive population for the measure of interest, to emphasise differences in the infected population over time in isolation of the total population. This is noted in the description of the numerator and denominator in relevant figures.
Policy changes
Substantial policy changes to the respective bTB eradication programmes during 2003–2015 were documented by policy colleagues in each of the five countries and are summarised in online supplementary table S1.
vetrec-2017-104718supp001.docx (35.3KB, docx)
Results
Demographics and geographical boundaries
The herd and cattle densities in 2012–2015 are presented in the online supplementary figure S1 and S2 figures S1 and S2, extending information for 1995–1998 and 2006–2009 presented previously (figures 3 and 4, respectively, in Abernethy et al’s study).7 A map of the UK and the Republic of Ireland, including national boundaries and the bTB risk areas in England, is presented in figure 1.
Figure 1.
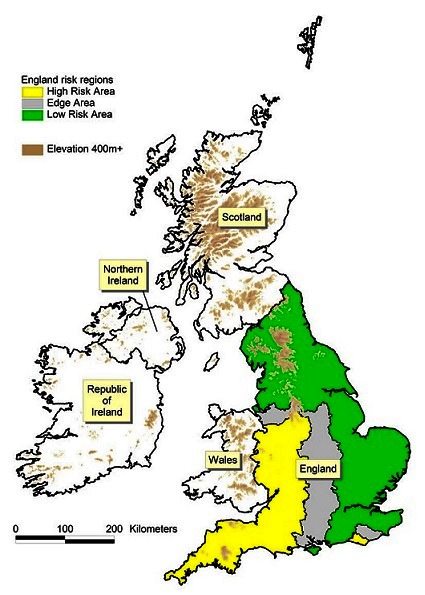
The UK and Republic of Ireland illustrating political boundaries and the bovine tuberculosis (bTB) risk areas (High Risk Area, Edge Area, Low Risk Area) in England.
vetrec-2017-104718supp002.docx (544.7KB, docx)
vetrec-2017-104718supp003.docx (577.4KB, docx)
bTB trends
Extending earlier measures of bTB frequency and recurrence
Animal-level summary measures
There are differing trends between countries in the proportion of the total cattle population with bTB disclosed (apparent animal prevalence) (figure 2). In England, the apparent annual animal prevalence has increased steadily since 2001 in both the High Risk Area (HRA) and Edge Area, in 2015 to 0.93 and 0.16 per cent, respectively. In Ireland, there has been a progressive decline from a peak of 0.63 per cent in 1999 to 0.26 per cent in 2015. In NI, there has been an increase in apparent annual animal prevalence in recent years to 0.73 per cent in 2015 from an earlier peak of 1.01 per cent in 2003. In Wales, there has been a fall to 0.53 per cent in 2015 from a peak of 0.83 per cent in 2008. Apparent animal prevalence in the Low Risk Area (LRA) of England and in Scotland has remained very low, reaching a maximum of 0.019 per cent in 2015 and 0.015 per cent in 2012, respectively. The cumulative apparent animal prevalence for 2012–2015 (figure 3) continues the earlier series for 1995–1998 and 2006–2009 (figure 18 in Abernethy et al’s study).7 Comparing 2012–2015 with 2006–2009, in GB there has been ongoing expansion of the geographic area of highest cumulative apparent animal prevalence in the HRA of England. In NI, areas of high cumulative apparent animal prevalence have persisted in the east and west of the country, whereas in Ireland there are now fewer areas of high cumulative apparent animal prevalence. The distribution of bTB reactors in 2014 is presented in online supplementary figure S3, extending earlier maps from 1997 and 2008 (figure 19 from Abernethy et al’s study).7
Figure 2.

Annual apparent animal prevalence. The risk areas in England are only presented from 2001 (a continuation of figure 17 from Abernethy et al’s 7 study). The shaded area represents the duration of the foot and mouth epidemic.
Figure 3.

Cumulative apparent animal prevalence, 2012–2015 (sum of reactors (2012–2015) per hexagon divided by the sum of the mean population per herd (2012–2015) per hexagon) (a continuation of figure 18 from Abernethy et al’s 7 study). The yellow and green lines delineate the boundaries between the High Risk Area and the Edge Area, and between the Edge Area and the Low Risk Area, respectively.
vetrec-2017-104718supp004.docx (514.6KB, docx)
Herd-level summary measures
The standardised annual herd prevalence (SHP) and standardised annual herd incidence (SHI) are presented in figures 4 and 5, respectively, noting that the within-country trends in SHP and SHI are similar, apart from NI where there has been an increase in SHI in recent years and a relatively stable SHP. In England, there has been a substantial increase in SHI during the 20-year period in both the HRA and Edge Area, though at a much lower level in the Edge Area. In the HRA and the Edge Area, SHI increased from 1.4 and 0.2 per cent in 1995 to 12.5 and 4.0 per cent in 2015, respectively. In England, there are signs in the HRA that the epidemic has stabilised to some degree. In Ireland, SHI has progressively fallen from 6.5 per cent in 1995 to 3.7 per cent in 2015. NI experienced a rise in SHI from 5.4 per cent in 1995 to 11.7 and 11.4 per cent in 2002 and 2004, respectively, followed by a fall to 6.8 per cent in 2010. Subsequently, the SHI has again risen to 10.3 per cent in 2015, but not to levels experienced during 2002–2004. Throughout the period, SHI has not exceeded 0.4 per cent in Scotland and 0.7 per cent in the LRA of England. In Wales, SHI rose to 8.2 per cent in 2009 from 0.8 per cent in 1995, but has since fallen to 6.3 per cent in 2015 (figure 5). The annual herd incidence density rate in the HRA of England almost doubled between 2003 (8.7 cases per 100 herd-years at risk) and 2015 (16.8), and in 2015 was almost twice that experienced in that year in NI (8.3) and Wales (7.6) (figure 6). There has been ongoing geographic expansion of areas of high cumulative herd risk from 1995 to 1998 (figure 14 in Abernethy et al’s study)7 through to 2012–2015 (figure 7).
Figure 4.

Standardised annual herd prevalence (a continuation of figure 9 from Abernethy et al’s 7 study). The shaded area represents the duration of the foot and mouth epidemic.
Figure 5.

Standardised annual herd incidence (a continuation of figure 11 from Abernethy et al’s 7 study). The shaded area represents the duration of the foot and mouth epidemic.
Figure 6.

Annual herd incidence density rate per 100 herd-years at risk.
Figure 7.

Cumulative herd risk, 2012–2015 (count of herds with ≥1 reactor for the period 2012–2015 divided by count of active herds per hexagon 2012–2015) (a continuation of figure 14 from Abernethy et al’s 7 study). The yellow and green lines delineate the boundaries between the High Risk Area and the Edge Area, and between the Edge Area and the Low Risk Area, respectively.
Additional measures
The percentage of bTB restrictions detected by abattoir surveillance is presented in figure 8. Although Ireland and NI were similar up until 2001, Ireland is now substantially different from each of the other countries. During 2005–2015, between 26.8 per cent (in 2012) and 36.4 per cent (2006) of bTB restrictions in Ireland were detected by abattoir surveillance. In each of the other countries and bTB risk areas, the equivalent figure is much lower: in 2015, the equivalent percentage was 15.8 per cent (NI), 15.4 per cent (England, LRA), 14.9 per cent (England, HRA), 11.5 per cent (England, Edge Area), 10.3 per cent (Scotland) and 8.3 per cent (Wales).
Figure 8.

Percentage of bovine tuberculosis (bTB) restrictions detected by abattoir surveillance (a continuation of figure 23 from Abernethy et al’s 7 study). The shaded area represents the duration of the foot and mouth epidemic.
The percentage of herds positive at the six-month post-restriction test is highest in the HRA of England, being 17.8 per cent in 2015 (figure 9). In most other countries and bTB risk areas, the breakdown rate is much lower: 10.0 per cent in the Edge Area of England, 9.6 per cent in Wales during 2015 and 9.4 per cent in Ireland during 2015. In NI, however, the situation has worsened between 2013 and 2015, with 13.4 per cent of herds positive at the six-month post-restriction test in 2015. In both figures 8 and 9, low herd numbers in Scotland and parts of England (the LRA, also the Edge Area to some degree) have resulted in a more erratic trend line.
Figure 9.

Percentage of herds positive at the six-month post-restriction test. No data are presented for Scotland after 2010, where the six-month post-restriction test was abolished for OTFS (officially bTB free status suspended) unconfirmed episodes (a continuation of figure 25 from Abernethy et al’s 7 study). The shaded area represents the duration of the foot and mouth epidemic.
New descriptive statistics: frequency, duration and severity of bTB restrictions
Study population comparison
There were fewer herds that met the study herd definition for the new descriptive statistics as described in section ‘Extending earlier measures of bTB frequency and recurrence’ (frequency, duration and severity of restrictions) compared with the number of study herds used for the previous measures as described in section ‘General’ (extending existing measures), as illustrated in online supplementary figure S4. To quantify the extent and the spatial distribution of herds excluded due to the herd selection criteria in the new measures versus the previous measures study populations, a number of spatial calculations were performed (online supplementary figure S4 (a–f)). Online supplementary figure S4 (a–c) shows the count of herds as per selection criteria for the previous measures as a single year, 2014 (a) and as a rolling period, 2012–2015 (b), and for the new measures period, 2003–2015 (c). The selection criteria yielding the highest herd count per hexagon (a) represent herds that were registered as active in 2014 (213,802 herds). Online supplementary figure S4 (b) shows the number of herds per hexagon that returned a bTB test result in the period 2012–2015 (197,552 herds) selected from herds defined as active in 2014, online supplementary figure S4 (a). Online supplementary figure S4 (c) shows the number of herds per hexagon as per the new descriptive measures selection criteria for 2003–2015 (184,414 herds). The differences in herd counts per hexagon according to selection criteria are displayed in online supplementary figure S4 (d and e); online supplementary figure S4 (d) showing the number of herds less per hexagon between the selection criteria with the highest count (a) and the lowest count (c); and online supplementary figure S4 (e) showing the difference between herds active in 2014 requiring a bTB test between the 2012–2015 (b) and the 2003–2015 (c) period. Finally, online supplementary figure S4 (f) shows the approximate number of cattle excluded from the new descriptive measures population when compared with all active herds in 2014 (3,464,980). In the new descriptive statistics, there were fewer study herds per hexagon in large parts of Scotland and the LRA of England. The differences in herds per hexagon when comparing all active herds on January 1, 2014 with those when applying the new measures criteria (2003–2015) are presented as a percentage herd loss in online supplementary figure S5.
vetrec-2017-104718supp005.docx (541.9KB, docx)
vetrec-2017-104718supp006.docx (577.1KB, docx)
Frequency
Number of restrictions
The mean number of restrictions per study herd during 2003–2015, by herd size, is presented in figure 10, and the mean number of restrictions per study herd annually in figure 11. There is an increase in the mean number of restrictions with herd size (figure 10), even in areas of low bTB risk, indicating that herd size is a risk factor for bTB restrictions in all areas and countries. In the HRA of England, there has been an increase in the mean number of restrictions per herd annually from 0.101 in 2003 to 0.170 in 2011 then a steady fall to 0.157 in 2015, whereas the Edge Area has continued to rise from 0.016 in 2003 to 0.055 in 2015 (figure 11). In 2015, the mean number of restrictions per herd was substantially higher in the HRA of England (0.157) compared with NI (0.083) where it has been rising, and Wales (0.075) and Ireland (0.034), which have both been decreasing. Figure 12 presents the mean number of restrictions per study herd per hexagon during 2003–2015 for herds with at least one restriction during this period. Among these herds during this period, the mean number of restrictions was greatest in the southwest of Wales and most of the HRA of England, indicating a high level of recurrence, more so than that observed in Ireland and NI.
Figure 10.

Mean number of restrictions per study herd during 2003–2015, by herd size.
Figure 11.

Mean number of restrictions per study herd annually.
Figure 12.

Mean number of restrictions per study herd per hexagon during 2003–2015 for those study herds with at least one restriction during this period (total restrictions per hexagon for 2003–2015 divided by the number of herds with a restriction per hexagon 2003–2015). The yellow and green lines delineate the boundaries between the High Risk Area and the Edge Area, and between the Edge Area and the Low Risk Area, respectively.
Interepisode interval
The annual percentage of study herds restricted during the year of interest with a short interepisode interval (ie, ≤365 days) is presented in figure 13. During 2003–2015, there has been a general fall in the percentage of herds restricted with a short interepisode interval across all countries and areas although the trend line is erratic in low bTB areas. In 2015, this was 33.3 per cent in the Edge Area of England, 30.5 per cent in the HRA of England, 19.0 per cent in NI, 18.5 per cent in Wales and 13.5 per cent in Ireland (figure 13). Figure 14 presents the mean interepisode interval per hexagon during 2005, 2010 and 2015, but limited to those study herds that were restricted during the year of interest with an interepisode interval up to 730 days.
Figure 13.

Annual percentage of study herds restricted during the year of interest with a short interepisode interval (≤365 days).
Figure 14.

Mean interepisode interval per hexagon during 2005, 2010 and 2015 for those study herds that were restricted during the year of interest with an interepisode interval up to 730 days. The yellow and green lines delineate the boundaries between the High Risk Area and the Edge Area, and between the Edge Area and the Low Risk Area, respectively.
Duration
The median restriction length for restrictions ending during the year of interest is presented in figure 15, and the percentage of prolonged restrictions (>550 days) in figure 16. In 2015, the percentage of prolonged restrictions was highest in the HRA of England (6.4 per cent), Wales (5.1 per cent) and NI (4.3 per cent), and consistently less over the study period in the Edge Area and LRA of England (2.3 and 0.93 per cent in 2015, respectively) and in Ireland (1.4 per cent). During 2011–2015, there were no prolonged restrictions in Scotland (figure 16). Figure 17 presents the mean restriction length (top) and the percentage of prolonged restrictions (>550 days) (bottom), by hexagon during 2007, 2011 and 2015.
Figure 15.

Median restriction length for restrictions ending during the year of interest.
Figure 16.

Percentage of restrictions more than 550 days in duration (prolonged restrictions).
Figure 17.

Mean restriction length (top) and the percentage of prolonged restrictions (>550 days) (bottom), by hexagon during 2007, 2011 and 2015 (restriction length per hexagon divided by the number of restricted herd per hexagon 2007, 2011 and 2015 (top), percentage of restricted herds with a restriction length >550 days per hexagon 2007, 2011 and 2015 (bottom)). The yellow and green lines delineate the boundaries between the High Risk Area and the Edge Area, and between the Edge Area and the Low Risk Area, respectively.
Severity
The mean number of reactors and abattoir cases per restriction, limited to study herds with a restriction ending during the year of interest is presented in figure 18. In comparison to 2005, this number was higher in 2015 in the High Risk Area (6.1 in 2005 and 7.7 in 2015) and the Edge Area (3.8 and 9.8) of England, but not in other countries and bTB risk areas: the LRA of England (3.5 and 3.7), Ireland (3.9 and 4.0), NI (5.3 and 5.9), Scotland (5.3 and 4.1) or Wales (6.1 and 6.7), although a rising trend in Wales had been observed up to 2013. The mean number per restriction per hexagon in 2007, 2011 and 2015 is presented in figure 19.
Figure 18.

Mean number of reactors and abattoir cases per restriction, limited to study herds with a restriction ending during the year of interest.
Figure 19.

Mean number of reactors and abattoir cases per restriction per hexagon in 2007, 2011 and 2015. For each hexagon, colour is used to indicate the mean number of reactors and abattoir cases per restriction, and column height to reflect the total number of study herds with a restriction ending during the year of interest.
Policy changes
A summary of current policy and a timeline of substantial policy changes relating to bTB surveillance and control in the five countries during 2003–2015 are presented in online supplementary table S1.
In 2013, England was regionalised for bTB surveillance purposes into an LRA of background four-yearly herd testing counties and an HRA of annually tested herds, separated by a continuous ‘buffer’ zone known as the Edge Area where herds are tested every six or 12 months (figure 1). Building on this, a new strategy was launched in April 2014 with the aim of gradually achieving OTF status for the whole country by 2038. The strategy takes account of the heterogeneous spatial distribution and epidemiology of the disease across the country. It consists of a comprehensive package of measures to tackle all sources of infection for cattle, including progressively more frequent and sensitive herd testing regimes, tighter cattle movement controls (eg, before and after movement testing), enhancing farm biosecurity and resilience to infection risks, support for injectable vaccination of badgers in the Edge Area and licensed culling of badgers in the HRA and certain parts of the Edge Area, where this species acts as a true maintenance host of M bovis infection.
Ireland has introduced a comprehensive wildlife control programme based on population reduction in areas where epidemiological investigation has identified wildlife as likely source of infection in cattle herd breakdowns.11 Science-based advice has steered advances in policy decisions,12 and an evolving quality control system on all elements of the programme has been introduced.
In contrast to Ireland, NI has not implemented a wildlife control programme but instead focused efforts on cattle controls. The measures introduced over the duration of this study which are considered to be the most important in reducing the spread of TB were the automatic ban on moves out of herds with overdue TB tests (2004), the introduction of interferon-γ testing as an integral part of the bTB programme (2007) and the removal as reactors those animals that give an inconclusive result to a second consecutive bTB test (2010).
Scotland has maintained a relatively low and stable incidence of bTB over the period, which probably represents the lowest baseline incidence that is consistent with maintaining risk-mitigated trade with the rest of the UK, where incidence is significantly higher. There remains no evidence of significant wildlife reservoirs of infection to cattle in Scotland, as evidenced by the absence of recurrence of disease on farms and the absence of breakdowns on neighbouring farms. As such, Scotland’s policies concentrate on early identification and eradication (before and after movement testing of cattle coming to Scotland from HRAs since 2005 and mandatory supplementary interferon-γ testing in any new confirmed (OTFW) breakdowns since 2006). Since the introduction of interferon-γ there have been no herd slaughters for bTB in Scotland. The final policy with a significant impact has been the introduction of risk-based routine surveillance to minimise unnecessary testing in the lowest risk herds, although the impact is related to surveillance efficiency rather than reduced incidence.
After the introduction of annual testing in 2010, Wales TB control policy sought to address TB test sensitivity, expansion of cattle controls and enhanced management of prolonged breakdowns. Policy changes which have come into effect in the depicted supervisory period include the withdrawal (rather than suspension) of OTF status on epidemiological grounds other than confirmation of disease; necessitating two clear tests after most TB breakdowns (October 2011). Since 2012, the Intensive Action Area (IAA), the area with the highest TB breakdown density in Wales, has seen ‘combined cattle controls’ incorporating the deployment of a TB badger vaccination programme (until 2015), passive badger surveillance and six monthly TB testing. In 2014, the All Wales Badger Found Dead Survey commenced, the largest passive surveillance programme of bTB in wildlife in Wales to date, which has fed into bTB policy decision-making. In the same year, the enhanced management of persistent breakdowns was initiated, entailing among others, enforcement of biosecurity measures and an immediate increase in the use of targeted interferon-γ testing.
Discussion
Among policymakers, there is considerable interest in comparison of bTB trends across countries. Indeed, this information is needed to facilitate critical evaluation of policy options for effective control and eradication. This study, and the earlier work by Abernethy et al,7 are unique, offering an example of harmonised approaches to measuring progress towards bTB control and eradication across a number of countries. The approach is consistent with recommendations from the European Commission13 which highlighted the importance of epidemiological data analysis using agreed epidemiological indicators for continuous assessment and subsequent enhancement of an eradication programme. Extending on the earlier work,7 we describe bTB trends in the UK and Ireland during 2003–2015. We extend both the period of interest (previously to 2010, now to 2015) and the measures of progress, which now include the herd incidence density rate plus measures relevant to the management of bTB episodes, including frequency, duration and severity. England is now presented as three risk areas (HRA, Edge Area, LRA), which were outlined in 201114 and in active use, with area-specific strategic objectives and control policies, from January 2013. Further, in online supplementary table S1, we document current policy and a timeline of substantial policy changes relating to bTB surveillance and control in the five countries during 2003–2015. We also draw on the differing experiences and perspectives across the five countries.
We have introduced a number of new measures of progress relating to restriction frequency, duration and severity. Whereas incidence and prevalence report absolute numbers at an area level, these new measures place greater focus in each area on the burden of disease at the farm level, such as how many animals they are losing, how long farms are under restrictions and how many times farms are under restriction. Nonetheless, the new measures relevant to the management of bTB episodes need to be interpreted with care for several reasons. The two measures of frequency (number of new restrictions, interepisode interval) are associated, as are these measures of frequency and duration (restriction length). Increasing restriction frequency would generally be associated with decreasing interepisode interval, and restriction frequency should decrease with increasing restriction length. Similarly, with a general (ie, national) increase in bTB, restriction frequency will increase and interepisode interval will decrease, given that bTB clusters in the same herds.15 In addition, some of the measures are influenced by factors related both to disease management and disease control. If there were a national decision to extend restriction length, for example, under risk averse management, this would likely lead to a decrease in the number of new restrictions per unit time and the potential for increase in interepisode duration, as has occurred to some extent in the more chronic areas with increases to the number of control tests and a more severe interpretation of skin testing. This effect is ameliorated to a large degree, but not completely, given the application under common EU legislation5 6 of similar cattle controls in each country. We contend that these complexities are a feature of bTB programmes, where multiple measures are useful when critically evaluating programme progress. There is a need to collectively consider trends across a range of measures and to account for the direct impact on these measures of any management decisions. Therefore, the measures need to be interpreted collectively and with care.
In this study, the temporal trends were undertaken using country-level aggregate data. The work was undertaken separately at three centres (Belfast, Dublin, Weybridge), working with different IT systems and national databases, to develop agreed summary measures of trends in time. As mentioned previously, standardised case definitions were developed following detailed discussion within the project team, cognisant of country-level differences in data collection, management and interpretation. A different approach was used for the spatial trends, noting the development of maps to a much finer scale. Here, under appropriate data sharing agreements, herd-level data were shared, which allowed us to create polygon-level spatial summary statistics. Using this approach, there were limited opportunities for detailed data analysis. SHI and SHP were calculated to adjust for differing herd demographics (specifically herd size) and time at risk across the five countries.
In the preceding paper, covering bTB trends in the five countries during the period from 1995 to 2010, Abernethy et al 7 highlighted a stable situation of extremely low prevalence in Scotland, a higher but reducing prevalence in Ireland, and up to 2009, rising trends in England, Wales and NI. In this current work, this situation has continued during 2010–2015 in Scotland, the LRA of England and Ireland, including ongoing falls in both animal (figure 2) and herd (figure 4) prevalence in Ireland. In the HRA and the Edge Area of England during 2010–2015, the rising bTB trends have continued, as highlighted in measures of animal and herd prevalence and herd incidence (figures 3–6), though at a much lower level in the Edge Area. However, there are signs of stabilisation of trends in these measures in the HRA. In NI, there has been a rising bTB trend during 2010–2015, although not yet back to levels experienced during 2002–2004. In Wales, animal and herd prevalence have each fallen subsequent to a peak in 2008.
The new measures of restriction frequency, duration and severity generally follow the same patterns as animal and herd prevalence and incidence. Each reflects an improving situation, though due to the cyclical nature of many of these trend lines, a sustained fall over several years may need to be observed to have confidence in these recent falls. As expected, the new measures have generally been higher in the HRA of England and in Wales compared with most other countries/areas during the study period. In recent years, there has been a downward trend in Wales, and to a lesser extent in the HRA of England, with respect to restriction frequency (specifically, the percentage of restricted herds with a short interepisode interval, figure 13), duration (the percentage of prolonged restrictions, figure 16) and severity (figure 18). In NI, these measures are generally comparable to other countries/areas, although restriction length (figure 15) (but not the percentage of prolonged restrictions, figure 16) is increased, possibly impacted by a large proportion of small herds in NI. Wales also has a relatively high restriction length (figure 15), increased in recent years and is likely associated with many bTB episodes without observed lesions since 2012 that have been subject to the same and increased number of control tests as lesioned incidents, due to a perceived heightened epidemiological risk. In the HRA of England and in Wales and NI, there has been a recent fall in the percentage of prolonged restrictions (figure 16, percentage of restrictions >550 days), coincident with a fall in the HRA of England and in Wales of restriction severity (figure 18, the mean number of reactors and abattoir cases per restriction). The results in figure 16 may in part reflect differences in the average herd size in GB compared with the island of Ireland,7 noting the recognised association between herd size and bTB persistence.16 This is also illustrated by the change that occurs in incidence in NI relative to other countries/areas when herd size is controlled (figure 5, standardised annual herd incident) compared with when it is not (figure 6, annual herd true incidence rate). In Scotland and the LRA of England, the mean number of restrictions per study herd (figure 11) is very low, and the median restriction length for restricted herds (figure 15) is lower than other countries/areas. Due to small numbers, the results for Scotland in several figures (figures 13, 15 and 18) need to be interpreted with care.
Policy impact is of acute interest in each of these five countries, specifically the policies that have led to the greatest positive impact on bTB control. However, it is extremely difficult to attribute specific policy decisions to an observed bTB trend, due both to the complexity and fluidity of the policy mix in each of the national programmes. In other words, bTB policy and impact on bTB trends have been very difficult to disentangle. As highlighted in online supplementary table S1, there are ongoing changes to bTB policy in each of the five countries. Further, the impact of any specific policy may vary in different countries as a consequence of multiple factors, including those relating to farming (eg, livestock movement, animal housing and grazing) and the environment (M bovis survival, badger density).
Throughout the five countries, those bTB policies that relate to cattle are generally quite similar, whereas those relating to wildlife are not. This reflects the focus of the relevant European legislation, principally 64/432/EEC5 and 78/52/EEC,6 which is prescriptive with respect to controls on cattle but essentially silent on those relating to wildlife. Key areas of difference with cattle controls include implementation of risk-based routine surveillance in Scotland and of bTB risk areas in England (this concept has been extended to Wales since October 2017).17 In addition, there have been differences in the use of the interferon-γ test (online supplementary table S1) as there is scope within 64/432/EEC5 for each country to decide how they use the test to best suit local conditions. Introduction and increased use of the interferon-γ test are each likely to be followed by an increase in the detection and removal of reactors (figures 18 and 19). Wales used different interpretation thresholds for field surveillance under severe interpretation by including the additional result ‘severe inconclusive reactor’ which would be classed as ‘clear testing’ in the rest of the UK and which can trigger γ-testing and animal removal.
Throughout the UK and Ireland, there is general agreement on the role of the Eurasian badger (M meles) as a maintenance host of M bovis and a contributor to the persistence of bTB in cattle, although in Scotland and the low incidence areas of England there is little evidence of any significant wildlife reservoirs of infection for cattle. Further, badgers are a protected species both in Ireland and the UK and listed under the Bern Convention. Nonetheless, there are substantial country-level differences in approaches to wildlife as part of national bTB control (online supplementary table S1). In Ireland, reactive badger removal from areas of high bTB prevalence in cattle has been used for many years, but with a recent, progressive shift to vaccination. In England, emphasis has been placed on licensed industry-led culling and voluntary vaccination in areas of endemic bTB incidence (ie, in the HRA and parts of the Edge Area). A badger vaccination programme has been part of a suite of bTB controls within the IAA of Wales, areas where herd bTB prevalence has fallen by 35 per cent between 2010 and 2016.18 In NI, badger vaccination or culling is not a current policy, rather there has been a focus on evidence gathering through a ‘Test and Vaccinate or Remove’ wildlife intervention research project, a long-standing Road Traffic Accident survey and comparison of genotype data from cattle and badger M bovis positive cultures. In Scotland, routine wildlife surveillance is limited to the investigation and culture of any suspect cases in wild deer. These differing approaches to limiting infection from badgers may contribute to the observed differences in bTB trends across countries, however, this remains a point of contention.11 19 20 Nonetheless, there is the potential for increasing convergence into the future, particularly with respect to badger vaccination. There has been substantial progress towards a field vaccination for badgers, by collaborating research groups in the UK and Ireland,21 22 and results from the Kilkenny badger vaccine trial have been encouraging.23 24 Oral badger vaccination against M bovis infection is still at the research stage, including the formulation of a suitable oral bait, efficacy and safety studies, field deployment studies and compilation of an evidence dossier in support of a marketing authorisation for the oral vaccine.
One of the most striking results, noted previously,7 relates to the percentage of bTB restrictions detected by abattoir surveillance, being much higher in Ireland (28.9 per cent in 2015) than in other countries (eg, 14.9 per cent in the HRA of England and 8.3 per cent in Wales in 2015, figure 8). Field and abattoir surveillance is used in each national eradication programme, with abattoir surveillance of particular importance where active testing intervals are higher, as in Scotland and the LRA of England. Given their complementary roles, country-level differences could possibly be due to country-level differences in detection sensitivity (eg, the Irish results could be due to higher sensitivity of abattoir surveillance and/or lower sensitivity for field surveillance). As explained below, however, evidence in support remains incomplete.
With respect to abattoir surveillance, there is evidence of country-level differences in detection sensitivity. In published studies investigating the effectiveness of abattoir surveillance, submission rates were substantially lower in England as a whole (1.4–4.1 lesions submitted per 10,000 animals killed, in 2003 and 2008, respectively),25 compared with Ireland (22 per 10,000 in 2003–2004,26 25 per 10,000 in 2005–2007)27 and NI (29 per 10,000 in 2011–2013).28 In this context, submission refers to the submission of material from animals presenting with bTB-like lesions at routine slaughter. In contrast, confirmation rates were very similar across these three countries (67.4 per cent in England during 2003–2008,25 63.9 per cent in Ireland during 2003–2004,26 64.2 per cent in NI during 2011–2013).28 This comparison does not control for bTB prevalence among slaughtered cattle, but may in part reflect country-level differences in detection sensitivity during abattoir surveillance. Recent work has estimated the herd-level detection sensitivity during meat inspection in Irish abattoirs,29 which at 24 per cent would indicate that a substantial number of infected herds are not currently being detected during this procedure.
With respect to field surveillance, no direct country-level comparisons have yet been made. In all five countries, the same paired avian and bovine tuberculins from Lelystad (The Netherlands) have been used since October 2009, which is important given observed differences in test performance between tuberculin purified protein derivative (PPD) combinations from different manufacturers and potencies.30 31 Prior to October 2009, Downs et al 32 found that the use of Weybridge tuberculin was associated with slightly higher test sensitivity and lower test specificity, compared with Lelystad. During the period of interest, there have been changes to aspects of field surveillance in several countries, each with the potential to influence the sensitivity of the tuberculin skin testing regime. For example, interferon-γ testing during restrictions may lead to the identification of infected animals that may otherwise have become abattoir cases after restrictions are lifted. Further, Duignan et al 33 outline quality control measures within the Irish programme, including the ongoing assessment of tuberculin potency in cattle, and the introduction in 2010 of a means to routinely assess and rank individual testers against measures of administrative and field performance. These Irish measures may possibly have contributed to the observed fall in recent years of the percentage of bTB restrictions detected by abattoir surveillance (figure 8). In NI since September 2009, at least one veterinary officer from Standards and Compliance Branch has attended each skin test supervision to ensure a consistent approach to the audit on farm and to quality assure reports submitted to bTB programme managers. A review of bTB test audit was undertaken in 2015 and one of the early outcomes was a revised procedure at bTB test supervisions. Similarly, there have been substantial changes to the processes of approval and auditing of skin testers across GB. In 2013, APHA launched a new field audit system for official veterinarians (OV), private veterinarians who undertake the majority of skin tests. Subsequently, an enhanced OV auditing programme has been developed and implemented by APHA to deliver a more robust quality assurance of veterinary training and skills on bTB to supplement existing training. In 2015, bTB testing in England and Wales came under a new contractual framework, so that virtually all skin testing is undertaken by regional suppliers (delivery partners) responsible for allocating tests to OVs and ensuring that testing is carried out to a high standard. Each delivery partner provides a managed service of OV testers, which includes an internal auditing system in addition to the unannounced on-farm inspection visit carried out by APHA auditors.
Divergence with respect to the percentage of herds positive at the six-month post-restriction test is highlighted in figure 9, being highest in the HRA of England (17.8 per cent in 2015) and NI (13.4 per cent). Herd recurrence is an important feature of bTB persistence, which can be attributed either to residual infection in cattle (ie, cattle infected but missed during testing) or reinfection, either from local sources (such as spread from the environment, wildlife or neighbouring farms) or following cattle introduction. A detailed review of bTB persistence is available,12 noting that there will be regional differences in the relative importance of these infection sources. Based on modelling work reported by Conlan and et al,34 up to 21 per cent of herds in the HRA of England may be harbouring at least one infected animal after they clear restrictions. Similarly, Clegg et al 35 confirm the importance of previous bTB exposure as a significant risk factor for large bTB breakdowns in Ireland. Abernethy et al 7 previously highlighted the challenges faced with current EU legislation, where herds are free to trade once two clear tests are achieved, that is, a minimum four months after the last test on positive animals has been disclosed. In contrast, in the successful Australian bTB eradication programme, infected herds did not gain ’confirmed free 3' status until eight years after the last known infected animal had been removed.36 In Ireland, Gallagher et al describe a significant improvement in herd recurrence between 1998 and 2008.9 In Scotland, where recurrent disease has not been a feature, under 2 per cent of OTFW episodes can be ascribed to a failure to completely eradicate a specific genotype on the first occasion, but disease has never recurred more than once (unpublished data). In addition, routine six monthly post-restriction testing was dropped in 2010 in Scotland, following a retrospective analysis of 10 years’ worth of data showing that no confirmed reactors were found in that period at the six months after breakdown test.
Methodological challenges
As with the previous work,7 we faced a number of methodological challenges during this work. Many of these relate to differences either between the national programmes or the national programme databases. The glossary of terms (table 1) and measures of restriction frequency, duration and severity (table 2), including the relevant study population, study period and restriction(s) of interest, were developed to ensure equivalence across the five countries.
As illustrated in online supplementary figure S4, there are differences between the study populations that were used for the existing measures and for the new descriptive measures calculating restriction frequency, duration and severity. The former existing measures relate to herds registered as active on January 1 in the year of interest (2014 in the case of online supplementary figure S4 (a)) and a subset of these herds that yielded a bTB test in a rolling period two years prior to and after this date (2012–2015, online supplementary figure S4 (b)). In contrast, the latter new descriptive measures represent the cohort of herds that were present throughout the full study period, 2003–2015 (specifically, presented for testing in each of the following periods: 2002–2005 (2001 England, Scotland and Wales due to a foot and mouth disease outbreak), 2006–2010, 2011–2015, online supplementary figure S4 (c)). These selection criteria would exclude herds in areas with long test intervals or with test exempt status. Herds that were depopulated, changed ownership, changed registration number or went dormant, as well as reactivated or newly registered herds, would all have been lost from the study population. These differences are greatest along the eastern half of England and Scotland, which is most likely to be a product of testing every four years instead of annually which is mostly the case elsewhere. A herd without cattle eligible for testing at its scheduled test in a four-yearly testing area cannot qualify for the study cohort through this test and it may be four years until its next test, whereas in an annually tested area the next scheduled test will be in just one year’s time. It is thus far more likely for a four-yearly tested herd not to be tested in one of the five-year study periods, and throughout the study period this would include areas of varying sizes in western England and Wales too. Around 21 per cent of herds contributing to existing measures in 2014 in GB were not formed until after 2005 and thus could not qualify in the new measures study cohort. The percentage herd loss per hexagon shown in online supplementary figure S5 will include such herds in calculating this loss.
Some difficulties were faced when seeking equivalence with respect to the start and end of bTB restrictions. In NI, for example, the period of restriction is initiated on the date that a herd loses its OTF status. However, the initiation date does not correspond exactly with the bTB disclosure date for those restrictions where the test date has been delayed. After considering all restricted periods during 2010–2015, this equates to a duration increase of 2.92 days (95% CI 2.87 to 2.97) per restriction; therefore, the impact of this discrepancy is minor (but does contribute to the higher trend line for NI in figure 15). In GB, restrictions are lifted by the service of the TB10 notice, but this can be weeks or months after the final control test, which in Ireland and NI is typically when restrictions are lifted. Adjustments were therefore made to the restriction end date in GB so that they equated to that final control test in order to replicate as far as possible the situation in Ireland and NI. Five per cent could not be confidently adjusted and the official TB10 date retained. In the study, herd incidence density rates were introduced to account for herd-years at risk. Equivalent methods have been used to allow comparison between countries. However, no adjustment is made for herd size, and therefore comparison between GB and the island of Ireland is difficult as the latter is characterised by smaller herds.7 Further, direct comparison with current published GB figures on herd incidence density rates is not possible due to differing methodologies (the denominator here accounts for the number of days unrestricted during the year of interest; in the current published official GB figures,37 account is taken of the number of days from the start of restriction back to the last measure of a herd’s bTB free status, which would be either the preceding clear whole herd test or the end of the previous restrictions). This was necessary due to differences between countries in data management and interpretation. To account for country-level differences, left censoring was applied (table 2), therefore care is needed when interpreting measures of restriction duration earlier in the study period.
Conclusions and recommendations for further research
In conclusion, we have presented a further description of bTB trends in the UK and Ireland, during the period from 2003 to 2015, building on earlier work.1 This work is unique in that it uses a common framework across five countries, and will assist policymakers when critically evaluating policy options for effective control and the progress of eradication programmes. Ongoing updates would be useful, potentially every five years, providing an evidence base for country-level comparison of bTB trends into the future. There is a need to critically evaluate the usefulness of existing statistical measures to describe the progress of bTB, and to introduce and evaluate new concepts as they become available, such as whole genome sequencing. The use of multivariable analytical methods should be considered, but will rely on substantial sharing of raw data across the five countries, as was achieved here in support of the spatial analyses. Spatial and temporal trends could be explored using a range of methodologies, including analytical techniques in geographic information systems (GIS), to evaluate trends and relative changes in bTB prevalence.38
Acknowledgments
We thank Angela McMorland from Scottish Government, and Adam Brouwer and Heather O’Connor from APHA for their assistance during the drafting of this manuscript.
Footnotes
Funding: The authors have not declared a specific grant for this research from any funding agency in the public, commercial or not-for-profit sectors.
Competing interests: None declared.
Provenance and peer review: Not commissioned; externally peer reviewed.
References
- 1. Davidson JA, Loutet MG, O’Connor C, et al. Epidemiology of Mycobacterium bovis Disease in Humans in England, Wales, and Northern Ireland, 2002-2014. Emerg Infect Dis 2017;23:377–86. 10.3201/eid2303.161408 [DOI] [PMC free article] [PubMed] [Google Scholar]
- 2. Jalava K, Jones JA, Goodchild T, et al. No increase in human cases of Mycobacterium bovis disease despite resurgence of infections in cattle in the United Kingdom. Epidemiol Infect 2007;135:40–5. 10.1017/S0950268806006509 [DOI] [PMC free article] [PubMed] [Google Scholar]
- 3. Doran P, Carson J, Costello E, et al. An outbreak of tuberculosis affecting cattle and people on an Irish dairy farm, following the consumption of raw milk. Ir Vet J 2009;62:390–7. 10.1186/2046-0481-62-6-390 [DOI] [PMC free article] [PubMed] [Google Scholar]
- 4. HEALTH PROTECTION SURVEILLANCE CENTRE. (2010) Guidelines on the prevention and control of tuberculosis in Ireland 2010 (amended 2014). https://www.hpsc.ie/a-z/vaccinepreventable/tuberculosistb/publications/File,4349,en.pdf.
- 5. ANON. Council Directive 64/432/EEC of 26 June 1964 on animal health problems affecting intra-Community trade in bovine animals and swine. Official Journal of the European Communities;1964:121:164–84 https://eur-lex.europa.eu/legal-content/EN/LSU/?uri=CELEX:31964L0432. [Google Scholar]
- 6. ANON. Council Directive 78/52/EEC of 13 December 1977 establishing the Community criteria for national plans for the accelerated eradication of brucellosis, tuberculosis and enzootic leukosis in cattle. Official Journal of the European Communities L15/34. 1978. https://eur-lex.europa.eu/legal-content/EN/TXT/?qid=1526633089350&uri=CELEX:31978L0052. [Google Scholar]
- 7. Abernethy DA, Upton P, Higgins IM, et al. Bovine tuberculosis trends in the UK and the Republic of Ireland, 1995-2010. Vet Rec 2013;172:312 10.1136/vr.100969 [DOI] [PubMed] [Google Scholar]
- 8. Houston R. A computerised database system for bovine traceability. Rev Sci Tech 2001;20:652–61. [DOI] [PubMed] [Google Scholar]
- 9. Gallagher MJ, Higgins IM, Clegg TA, et al. Comparison of bovine tuberculosis recurrence in Irish herds between 1998 and 2008. Prev Vet Med 2013;111:237–44. 10.1016/j.prevetmed.2013.05.004 [DOI] [PubMed] [Google Scholar]
- 10. McGrath G, Abernethy D, Stringer L, et al. An all-island approach to mapping bovine tuberculosis in Ireland. Ir Vet J 2009;62:192–7. 10.1186/2046-0481-62-3-192 [DOI] [PMC free article] [PubMed] [Google Scholar]
- 11. Byrne AW, Kenny K, Fogarty U, et al. Spatial and temporal analyses of metrics of tuberculosis infection in badgers (Meles meles) from the Republic of Ireland: Trends in apparent prevalence. Prev Vet Med 2015;122:345–54. 10.1016/j.prevetmed.2015.10.013 [DOI] [PubMed] [Google Scholar]
- 12. More SJ, Good M. Understanding and managing bTB risk: perspectives from Ireland. Vet Microbiol 2015;176:209–18. 10.1016/j.vetmic.2015.01.026 [DOI] [PubMed] [Google Scholar]
- 13. ANON. Working document on eradication of bovine tuberculosis in the EU accepted by the bovine tuberculosis working group of the task force on monitoring animal disease eradication. Brussels: European Commission, 2013. SANCO/1067/2013 https://ec.europa.eu/food/sites/food/files/animals/docs/diseases_erad_tb_workingdoc2006_en.pdf. [Google Scholar]
- 14. ANON. Bovine TB Eradication Programme for England. London: Department of Environment, Food and Rural Affairs, 2011. http://www.defra.gov.uk/publications/files/pb13601-bovinetb-eradication-programme-110719.pdf. [Google Scholar]
- 15. Broughan JM, Judge J, Ely E, et al. A review of risk factors for bovine tuberculosis infection in cattle in the UK and Ireland. Epidemiol Infect 2016;144:2899–926. 10.1017/S095026881600131X [DOI] [PMC free article] [PubMed] [Google Scholar]
- 16. Brooks-Pollock E, Keeling M. Herd size and bovine tuberculosis persistence in cattle farms in Great Britain. Prev Vet Med 2009;92:360–5. 10.1016/j.prevetmed.2009.08.022 [DOI] [PubMed] [Google Scholar]
- 17. ANON. Strengthened approach to tackling bovine TB in Wales announced. Cardiff: Welsh Government, 2017. https://gov.wales/newsroom/environmentandcountryside/2017/170620-strengthened-approach-to-tackling-bovine-tb-in-wales-announced/?lang=en. [Google Scholar]
- 18. ANON. New incidence of TB down 35% in IAA: Welsh Government, 2017. https://gov.wales/newsroom/environmentandcountryside/2017/new-incidence-of-tb-down-in-iaa/?lang=en. [Google Scholar]
- 19. Bielby J, Donnelly CA, Pope LC, et al. Badger responses to small-scale culling may compromise targeted control of bovine tuberculosis. Proc Natl Acad Sci U S A 2014;111:9193–8. 10.1073/pnas.1401503111 [DOI] [PMC free article] [PubMed] [Google Scholar]
- 20. Olea-Popelka FJ, Fitzgerald P, White P, et al. Targeted badger removal and the subsequent risk of bovine tuberculosis in cattle herds in county Laois, Ireland. Prev Vet Med 2009;88:178–84. 10.1016/j.prevetmed.2008.09.008 [DOI] [PubMed] [Google Scholar]
- 21. Chambers MA, Aldwell F, Williams GA, et al. The effect of oral vaccination with Mycobacterium bovis BCG on the development of tuberculosis in captive European badgers (Meles meles). Front Cell Infect Microbiol 2017;7 10.3389/fcimb.2017.00006 [DOI] [PMC free article] [PubMed] [Google Scholar]
- 22. Murphy D, Costello E, Aldwell FE, et al. Oral vaccination of badgers (Meles meles) against tuberculosis: comparison of the protection generated by BCG vaccine strains Pasteur and Danish. Vet J 2014;200:362–7. 10.1016/j.tvjl.2014.02.031 [DOI] [PubMed] [Google Scholar]
- 23. Gormley E, Ní Bhuachalla D, O’Keeffe J, et al. Oral Vaccination of Free-Living Badgers (Meles meles) with Bacille Calmette Guérin (BCG) Vaccine Confers Protection against Tuberculosis. PLoS One 2017;12:e0168851 10.1371/journal.pone.0168851 [DOI] [PMC free article] [PubMed] [Google Scholar]
- 24. Aznar I, Frankena K, More SJ, et al. Quantification of Mycobacterium bovis transmission in a badger vaccine field trial. Prev Vet Med 2018;149:29–37. 10.1016/j.prevetmed.2017.10.010 [DOI] [PubMed] [Google Scholar]
- 25. Shittu A, Clifton-Hadley RS, Ely ER, et al. Factors associated with bovine tuberculosis confirmation rates in suspect lesions found in cattle at routine slaughter in Great Britain, 2003-2008. Prev Vet Med 2013;110:395–404. 10.1016/j.prevetmed.2013.03.001 [DOI] [PubMed] [Google Scholar]
- 26. Frankena K, White PW, O’Keeffe J, et al. Quantification of the relative efficiency of factory surveillance in the disclosure of tuberculosis lesions in attested Irish cattle. Vet Rec 2007;161:679–84. 10.1136/vr.161.20.679 [DOI] [PubMed] [Google Scholar]
- 27. Olea-Popelka F, Freeman Z, White P, et al. Relative effectiveness of irish factories in the surveillance of slaughtered cattle for visible lesions of tuberculosis, 2005-2007. Ir Vet J 2012;65:2 10.1186/2046-0481-65-2 [DOI] [PMC free article] [PubMed] [Google Scholar]
- 28. Pascual-Linaza AV, Gordon AW, Stringer LA, et al. Efficiency of slaughterhouse surveillance for the detection of bovine tuberculosis in cattle in Northern Ireland. Epidemiol Infect 2017;145:995–1005. 10.1017/S0950268816003095 [DOI] [PMC free article] [PubMed] [Google Scholar]
- 29. Willeberg PW, McAloon CG, Houtsma E, et al. The Herd-Level Sensitivity of Abattoir Surveillance for Bovine Tuberculosis: Simulating the Effects of Current and Potentially Modified Meat Inspection Procedures in Irish Cattle. Front Vet Sci 2018;5:82 10.3389/fvets.2018.00082 [DOI] [PMC free article] [PubMed] [Google Scholar]
- 30. Good M, Clegg TA, Costello E, et al. The comparative performance of the single intradermal test and the single intradermal comparative tuberculin test in Irish cattle, using tuberculin PPD combinations of differing potencies. Vet J 2011;190:e60–e65. 10.1016/j.tvjl.2011.01.005 [DOI] [PubMed] [Google Scholar]
- 31. Good M, Clegg TA, Murphy F, et al. The comparative performance of the single intradermal comparative tuberculin test in Irish cattle, using tuberculin PPD combinations from different manufacturers. Vet Microbiol 2011;151:77–84. 10.1016/j.vetmic.2011.02.028 [DOI] [PubMed] [Google Scholar]
- 32. Downs SH, Clifton-Hadley RS, Upton PA, et al. Tuberculin manufacturing source and breakdown incidence rate of bovine tuberculosis in British cattle, 2005-2009. Vet Rec 2013;172:98 10.1136/vr.100679 [DOI] [PubMed] [Google Scholar]
- 33. Duignan A, Good M, More SJ. Quality control in the national bovine tuberculosis eradication programme in Ireland. Rev Sci Tech 2012;31:845–60. [DOI] [PubMed] [Google Scholar]
- 34. Conlan AJ, McKinley TJ, Karolemeas K, et al. Estimating the hidden burden of bovine tuberculosis in Great Britain. PLoS Comput Biol 2012;8:e1002730 10.1371/journal.pcbi.1002730 [DOI] [PMC free article] [PubMed] [Google Scholar]
- 35. Clegg TA, Good M, Hayes M, et al. Trends and predictors of large tuberculosis episodes in cattle herds in Ireland. Front Vet Sci 2018;5:6 10.3389/fvets.2018.00086 [DOI] [PMC free article] [PubMed] [Google Scholar]
- 36. More SJ, Radunz B, Glanville RJ. Lessons learned during the successful eradication of bovine tuberculosis from Australia. Vet Rec 2015;177:224–32. 10.1136/vr.103163 [DOI] [PMC free article] [PubMed] [Google Scholar]
- 37. ANON. Bovine TB statistics: Department of Environment, Food & Rural Affairs, Animal and Plant Health Agency, 2018. https://www.gov.uk/government/collections/bovine-tb. [Google Scholar]
- 38. McGrath G, Clegg TA, More SJ. Recent spatial changes in bovine tuberculosis in the Republic of Ireland. Vet Rec 2014;175:45 10.1136/vr.101977 [DOI] [PubMed] [Google Scholar]
Associated Data
This section collects any data citations, data availability statements, or supplementary materials included in this article.
Supplementary Materials
vetrec-2017-104718supp001.docx (35.3KB, docx)
vetrec-2017-104718supp002.docx (544.7KB, docx)
vetrec-2017-104718supp003.docx (577.4KB, docx)
vetrec-2017-104718supp004.docx (514.6KB, docx)
vetrec-2017-104718supp005.docx (541.9KB, docx)
vetrec-2017-104718supp006.docx (577.1KB, docx)