

Abstract
The validity of the classification of non‐affective and affective psychoses as distinct entities has been disputed, but, despite calls for alternative approaches to defining psychosis syndromes, there is a dearth of empirical efforts to identify transdiagnostic phenotypes of psychosis. We aimed to investigate the validity and utility of general and specific symptom dimensions of psychosis cutting across schizophrenia, schizoaffective disorder and bipolar I disorder with psychosis. Multidimensional item‐response modeling was conducted on symptom ratings of the Positive and Negative Syndrome Scale, Young Mania Rating Scale, and Montgomery‐Åsberg Depression Rating Scale in the multicentre Bipolar‐Schizophrenia Network on Intermediate Phenotypes (B‐SNIP) consortium, which included 933 patients with a diagnosis of schizophrenia (N=397), schizoaffective disorder (N=224), or bipolar I disorder with psychosis (N=312). A bifactor model with one general symptom dimension, two distinct dimensions of non‐affective and affective psychosis, and five specific symptom dimensions of positive, negative, disorganized, manic and depressive symptoms provided the best model fit. There was further evidence on the utility of symptom dimensions for predicting B‐SNIP psychosis biotypes with greater accuracy than categorical DSM diagnoses. General, positive, negative and disorganized symptom dimension scores were higher in African American vs. Caucasian patients. Symptom dimensions accurately classified patients into categorical DSM diagnoses. This study provides evidence on the validity and utility of transdiagnostic symptom dimensions of psychosis that transcend traditional diagnostic boundaries of psychotic disorders. Findings further show promising avenues for research at the interface of dimensional psychopathological phenotypes and basic neurobiological dimensions of psychopathology.
Keywords: Psychosis, transdiagnostic phenotypes, schizophrenia, schizoaffective disorder, bipolar disorder with psychosis, general symptom dimensions, specific symptom dimensions, biotypes
The validity of categorical classification in psychiatry is disputed, because the clinical and neurobiological boundaries between disorders are dubious1, 2, 3, 4, 5, 6, 7, 8, 9, 10, 11, 12, 13, 14, 15, 16, 17. Therefore, there have been calls for alternative approaches to psychiatric classification that are empirically and psychometrically informed through the investigation of neural and psychological mechanisms that transcend current syndromes3, 18, 19.
Some projects address the shortcomings of classic psychiatric classification, such as the Research Domain Criteria (RDoC) framework, that integrates many levels of information (from genes to self‐report) to further our understanding of basic cross‐disorder dimensions of functioning6, 7, 20, 21. The Bipolar‐Schizophrenia Network on Intermediate Phenotypes (B‐SNIP)22, 23 addresses the overlap across psychosis syndromes by examining a broad array of endophenotypes. Recently, the Hierarchical Taxonomy of Psychopathology (HiTOP) consortium has emerged as a research effort that quantifies disorders according to several levels of psychopathology, including spectra, syndromes and symptom components, and characterizes them dimensionally24. However, to date, evidence on the link between transdiagnostic dimensions of clinical phenotypes and basic brain‐based biomarkers is limited.
In psychosis, the overlap of symptoms across diagnostic categories is especially prevalent, which leads to high comorbidity, as seen with schizophrenia, schizoaffective disorder and bipolar disorder25, 26. While the Kraepelinian dichotomy regarded dementia praecox/schizophrenia and manic depressive illness as distinct diagnostic entities, recent research has challenged this dichotomy4, 5 and places schizophrenia and bipolar disorder on a transdiagnostic psychosis spectrum4, with schizoaffective disorder as an intermediate diagnostic category22. This overlap may be a result of shared genetic and environmental etiological factors4, 27, 28, 29. Findings also show, however, non‐shared genetic and environmental risk factors4, 27, 29, which supports the heterogeneity of psychotic disorders.
There remains a dearth of empirical efforts to identify a transdiagnostic phenotype of psychosis. The pentagonal model with five dimensions of positive symptoms, negative symptoms, cognitive disorganization, mania, and depression has received support in previous factor‐analytic work30. However, recent research has demonstrated evidence for a bifactor model, with a general psychosis factor encompassing non‐affective and affective symptoms in patients with schizophrenia, schizoaffective and bipolar disorder, as well as five specific psychosis dimensions of positive, negative, disorganized, manic and depressive symptoms4, 5.
This model was found to better fit empirical symptom data than a pentagonal model4, 5 and a model allowing for distinct non‐affective and affective psychosis factors31. It provides support for a psychosis spectrum ranging from bipolar disorder to schizoaffective disorder to schizophrenia. Further, in this bifactor model, shared etiological factors may be associated with the general psychosis factor, whereas non‐shared etiological factors could contribute to more specific psychosis dimensions4, 5. This approach could also hone the diagnostic process by placing patients broadly on the psychosis spectrum and using the specific symptom dimensions to classify them into specific diagnoses4, 5.
While initial support for the diagnostic utility of these dimensions has been found using the operational criteria system4, such transdiagnostic models and their diagnostic utility need to be further tested with more detailed measures of psychosis, mania and depression, and cross‐validated across a large multisite consortium, such as the B‐SNIP. This would allow for improved understanding of the utility of these dimensions not only for diagnosis in research and clinical care, but also in relation to basic neurobiological constructs such as the three recently identified B‐SNIP psychosis biotypes32, in an attempt to connect dimensional psychopathological phenotypes with neurobiological mechanisms12, 14, 24.
This study aimed to investigate transdiagnostic dimensions of psychosis spectrum disorders cutting across non‐affective and affective psychotic symptoms in patients with schizophrenia, schizoaffective disorder and psychotic bipolar I disorder, using widely established measures for assessing psychosis, mania and depression in the B‐SNIP consortium.
We aimed to investigate: a) whether there is a general dimension of psychosis spectrum disorders underlying all affective and non‐affective psychotic symptoms; b) whether formation of specific symptom dimensions (positive, negative, disorganized, depressive and manic symptoms) and distinct dimensions of affective and non‐affective psychosis is justified in addition to a general psychosis dimension; c) associations of socio‐demographic and clinical variables with general, affective, non‐affective and specific symptom dimensions; and d) the utility of these dimensions for classifying patients into categorical DSM diagnoses of psychotic disorders and the B‐SNIP biotypes.
METHODS
Sample and measures
This study used data collected as part of the multisite B‐SNIP consortium22. Specifically, patients with a DSM‐IV diagnosis of schizophrenia, schizoaffective disorder or psychotic bipolar I disorder (ascertained through the Structured Clinical Interview for DSM‐IV Axis I Disorders, SCID‐I33) were recruited from five sites in the US through regional advertising and from inpatient and outpatient clinics. Patients were in a non‐acute symptom state, clinically stable, and provided informed consent.
Participants were assessed extensively for their socio‐demographic and clinical features (including age, gender, ethnicity and DSM diagnosis) with a variety of instruments22, 23. In this study, the responses of three well‐established diagnostic instruments were investigated: the Positive and Negative Syndrome Scale (PANSS)34, which is a 30‐item clinical interview that measures the severity of psychotic symptoms on a scale of 1 to 7; the Young Mania Rating Scale (YMRS)35, a 11‐item measure to assess manic symptoms; and the Montgomery‐Åsberg Depression Rating Scale (MADRS)36, a 10‐item measure to assess depressive symptoms. Social functioning was measured using the Birchwood Social Functioning Scale (SFS)37.
Statistical analysis
Multidimensional item response modeling was conducted with the mirt package of the R environment (i.e., the Metropolis‐Hastings Robbins‐Monro algorithm38) for model estimation. Model fit was examined using the log‐likelihood (LL), the Akaike information criterion (AIC), the Bayesian information criterion (BIC), and the sample size‐adjusted BIC (SABIC)39. Better model fit is indicated by lower values than for the comparison model.
Since there is no definite evidence on the factorial structure of the PANSS, we first analyzed symptom ratings on the PANSS only and compared eighteen previously published factor solutions5. We then estimated three alternative item response models: a) a unitary (unidimensional) model with one general factor explaining all symptom ratings to reflect a general dimension of the psychosis spectrum (model A); b) a pentagonal (multidimensional) model to reflect specific positive, negative, disorganized, depressive and manic symptom dimensions (model B); and c) a bifactor model with one general factor independent from five uncorrelated (orthogonal) specific factors (model C; corresponding to the bifactor model in our earlier study5, 40). Since this is a full likelihood method, data was assumed to be missing at random.
Using the best‐fitting model for the PANSS identified in this initial step, we next conducted the primary analysis to investigate general and specific symptom dimensions based on all measures for assessing psychosis, mania and depression (i.e., PANSS, YMRS and MADRS) by comparing models A‐C, additionally allowing for factor loadings for YMRS and MADRS items on the general factor as well as on specific manic and depressive symptom factors, respectively. To investigate whether formation of distinct dimensions for affective and non‐affective psychosis was justified in addition to one general dimension and five specific symptom dimensions, model comparison of the primary analysis further included: d) a bifactor model with one general psychosis dimension, five uncorrelated specific factors (positive, negative, disorganized, depressive and manic symptom dimensions), and two uncorrelated factors to reflect distinct dimensions of affective and non‐affective psychosis (model D); and e) a model with five uncorrelated specific factors (positive, negative, disorganized, depressive and manic symptom dimensions) and two uncorrelated factors (distinct affective and non‐affective psychosis dimensions) but without a general factor (model E). To ensure stable model estimation, the prevalence of responses per category per item was set to be at least 10% of the sample. Due to low coverage in the more severe categories, responses were collapsed into three categories for the PANSS, YMRS and MADRS.
The association of socio‐demographic characteristics (i.e., age, gender, ethnicity), DSM diagnosis, and social functioning (as independent variables) with factor scores of general and specific psychosis dimensions (as outcome variables) were analyzed using linear regression.
Multinomial receiver operating characteristic (ROC) analysis41 was conducted in Stata version 1442 to investigate the extent to which factor scores of general, affective, non‐affective and specific dimensions allow for accurate classification of patients into categorical DSM diagnoses of psychotic disorders and the B‐SNIP biotypes.
RESULTS
Basic sample characteristics
Basic characteristics of the total B‐SNIP sample (N=933 patients) and the B‐SNIP sample used for estimating item response models, that included all response vectors with at least one response to items of the PANSS, YMRS and MADRS (N=860), were almost identical (Table 1). The mean age at interview was 36 years, and approximately half were male. The sample primarily consisted of patients with Caucasian or African American ethnicity. The most common diagnosis was schizophrenia, followed by psychotic bipolar I disorder and schizoaffective disorder.
Table 1.
Basic sample characteristics of B‐SNIP sample
| Total B‐SNIP sample (N=933) | Current B‐SNIP sample (N=860) | |
|---|---|---|
| Age (years, mean±SD) | 36.2±12.6 | 36.1±12.6 |
| Gender, N (%) | ||
| Men | 471 (50.5) | 433 (50.4) |
| Women | 461 (49.4) | 427 (49.7) |
| Ethnicity, N (%) | ||
| Caucasian | 530 (56.8) | 496 (57.7) |
| African American | 338 (36.2) | 306 (35.6) |
| Other | 61 (6.5) | 57 (6.6) |
| DSM diagnosis, N (%) | ||
| Schizophrenia | 397 (42.6) | 353 (41.1) |
| Schizoaffective disorder | 224 (24.0) | 216 (25.1) |
| Psychotic bipolar I disorder | 312 (33.4) | 291 (33.8) |
B‐SNIP – Bipolar‐Schizophrenia Network on Intermediate Phenotypes
Dimensionality of psychotic disorders
Initial analysis of symptom ratings on the PANSS indicated that a bifactor model with one general and five specific factors best matched the B‐SNIP sample data (AIC=53209.8, BIC=53920.0, SABIC=53443.7). Building on this initial step, we next compared item response models for symptom ratings on all measures for assessing psychosis, mania and depression (i.e., PANSS, YMRS, MADRS). This showed that the bifactor model with general, non‐affective, affective and five specific factors (i.e., model D) provided the best model fit, as indicated by the lowest AIC, BIC and SABIC (AIC=65988.4, BIC=67201.4, SABIC=66391.6) compared with alternative models (Table 2).
Table 2.
Model fit statistics for unitary (unidimensional), pentagonal (multidimensional), and bifactor models of psychosis based on PANSS, YMRS and MADRS symptom ratings
| LL | FP | AIC | BIC | SABIC | |
|---|---|---|---|---|---|
| Unidimensional (unitary) model (Model A) | –35660.2 | 153 | 71626.4 | 72354.2 | 71868.3 |
| Multidimensional (pentagonal) model with five correlated specific factors (Model B) | –33615.3 | 163 | 67556.5 | 68331.9 | 67814.3 |
| Bifactor model with one general factor and five specific symptom factors (Model C) | –33253.0 | 204 | 66914.1 | 67884.5 | 67236.6 |
| Bifactor model with one general factor, two factors for non‐affective and affective psychosis, and five specific symptom factors (Model D) | –32739.2 | 255 | 65988.4 | 67201.4 | 66391.6 |
| Bifactor model with two factors for non‐affective and affective psychosis and five specific symptom factors (model E) | –33372.9 | 204 | 67153.7 | 68124.2 | 67476.3 |
PANSS – Positive and Negative Syndrome Scale, YMRS – Young Mania Rating Scale, MADRS – Montgomery‐Åsberg Depression Rating Scale, LL – log‐likelihood, AIC – Akaike information criterion, BIC – Bayesian information criterion, SABIC – sample size‐adjusted Bayesian information criterion. All response vectors with at least one response were analyzed (N=860). Model D provides the best model fit, as indicated by lower BIC, AIC and SABIC compared to other models.
Findings on the best‐fitting model showed that the largest amount of item variance was explained by the general psychosis dimension (ωH=0.67), followed by negative (ωS=0.45), depressive (ωS=0.38) and positive (ωS=0.30) symptom dimensions (Table 3).
Table 3.
Factor loadings in bifactor model with general, non‐affective, affective, and five specific symptom factors based on PANSS, YMRS, and MADRS symptom ratings
| Items | General | Non‐affective | Affective | Positive symptoms | Negative symptoms | Disorganization | Mania | Depression |
|---|---|---|---|---|---|---|---|---|
| PANSS | ||||||||
| Delusions | 0.55 | 0.22 | 0.75 | |||||
| Hallucinatory behaviour | 0.45 | 0.20 | 0.48 | |||||
| Grandiosity | 0.54 | –0.00 | 0.20 | |||||
| Suspiciousness | 0.63 | 0.04 | 0.32 | |||||
| Unusual thought content | 0.55 | 0.34 | 0.53 | |||||
| Lack of judgment and insight | 0.48 | 0.32 | 0.15 | |||||
| Blunted affect | 0.09 | 0.69 | 0.44 | |||||
| Emotional withdrawal | 0.42 | 0.28 | 0.73 | |||||
| Poor rapport | 0.38 | 0.59 | 0.40 | |||||
| Passive social withdrawal | 0.30 | 0.16 | 0.80 | |||||
| Lack of spontaneity | 0.28 | 0.69 | 0.39 | |||||
| Motor retardation | 0.27 | 0.66 | 0.38 | |||||
| Disturbance of volition | 0.55 | 0.30 | 0.35 | |||||
| Active social avoidance | 0.50 | 0.02 | 0.71 | |||||
| Conceptual disorganization | 0.58 | 0.27 | 0.44 | |||||
| Difficulty in abstract thinking | 0.24 | 0.32 | 0.06 | |||||
| Stereotyped thinking | 0.61 | 0.40 | 0.46 | |||||
| Mannerisms and posturing | 0.55 | 0.50 | 0.20 | |||||
| Disorientation | 0.57 | 0.22 | –0.11 | |||||
| Poor attention | 0.67 | 0.27 | 0.15 | |||||
| Preoccupation | 0.68 | 0.23 | 0.34 | |||||
| Excitement | 0.70 | 0.14 | 0.32 | |||||
| Hostility | 0.74 | 0.16 | 0.09 | |||||
| Uncooperativeness | 0.72 | –0.07 | 0.07 | |||||
| Poor impulse control | 0.76 | 0.10 | 0.05 | |||||
| Somatic concern | 0.46 | 0.16 | 0.14 | |||||
| Anxiety | 0.52 | 0.38 | 0.39 | |||||
| Guilt feelings | 0.33 | 0.21 | 0.26 | |||||
| Tension | 0.64 | 0.22 | 0.17 | |||||
| Depression | 0.40 | 0.30 | 0.68 | |||||
| YMRS | ||||||||
| Elevated mood | 0.31 | 0.11 | 0.81 | |||||
| Increased motor activity‐energy | 0.28 | 0.17 | 0.79 | |||||
| Sexual interest | 0.24 | 0.15 | 0.52 | |||||
| Sleep | 0.16 | 0.88 | 0.22 | |||||
| Irritability | 0.48 | 0.44 | 0.16 | |||||
| Speech (rate and amount) | 0.38 | 0.22 | 0.73 | |||||
| Language‐thought disorder | 0.51 | 0.19 | 0.47 | |||||
| Content | 0.55 | 0.10 | 0.35 | |||||
| Disruptive‐aggressive behavior | 0.63 | 0.22 | 0.27 | |||||
| Appearance | 0.26 | 0.07 | 0.16 | |||||
| Insight | 0.38 | –0.11 | 0.12 | |||||
| MADRS | ||||||||
| Apparent sadness | 0.29 | 0.29 | 0.74 | |||||
| Reported sadness | 0.27 | 0.36 | 0.81 | |||||
| Inner tension | 0.39 | 0.52 | 0.38 | |||||
| Reduced sleep | 0.12 | 0.96 | –0.03 | |||||
| Reduced appetite | 0.23 | 0.57 | 0.26 | |||||
| Concentration difficulties | 0.31 | 0.43 | 0.37 | |||||
| Lassitude | 0.24 | 0.36 | 0.56 | |||||
| Inability to feel | 0.30 | 0.39 | 0.55 | |||||
| Pessimistic thoughts | 0.27 | 0.41 | 0.60 | |||||
| Suicidal thoughts | 0.30 | 0.39 | 0.63 | |||||
| ω H / ω S | 0.67 | 0.23 | 0.25 | 0.30 | 0.45 | 0.09 | 0.20 | 0.38 |
PANSS – Positive and Negative Syndrome Scale, YMRS – Young Mania Rating Scale, MADRS – Montgomery‐Åsberg Depression Rating Scale, ωH/ωS – proportion of item variance explained by general, non‐affective and affective factors (ωH) and specific factors (ωS)
Overall, factor loadings were heterogeneous in magnitude across symptom dimensions. Factor loadings for the general psychosis dimension were moderate to strong for most positive, negative, disorganized, manic and depressive symptom ratings of PANSS and YMRS items, but weaker for MADRS items (Table 4). The non‐affective psychosis dimensions showed the strongest factor loadings for negative and disorganized symptom ratings on the PANSS. Factor loadings for the affective psychosis dimension were strongest for MADRS depressive symptom ratings and, to a lesser extent, YMRS manic symptom ratings. Specific positive and negative symptom dimensions demonstrated moderate to strong factor loadings for most items of the PANSS, whereas factor loadings for the specific disorganized symptom dimension were only weak to moderate at most. Factor loadings for specific manic and depressive symptom factors were strongest for YMRS and MADRS, respectively.
Table 4.
Factor scores of general, non‐affective, affective and specific symptom dimensions by socio‐demographic and clinical variables
| General | Non‐affective | Affective | Positive symptoms | Negative symptoms | Disorganization | Mania | Depression | |
|---|---|---|---|---|---|---|---|---|
| B (95% CI), p | B (95% CI), p | B (95% CI), p | B (95% CI), p | B (95% CI), p | B (95% CI), p | B (95% CI), p | B (95% CI), p | |
| Age | –0.00 (–0.01 to 0.00), 0.167 | –0.01 (–0.01 to 0.00), 0.001 | 0.01 (0.00 to 0.01), 0.017 | 0.01 (0.00 to 0.01), 0.010 | 0.00 (–0.00 to 0.01), 0.282 | 0.01 (0.01 to 0.01), <0.001 | 0.00 (–0.00 to 0.01), 0.401 | –0.00 (–0.01 to 0.00), 0.356 |
| Gender | ||||||||
| Women vs. men | 0.09 (–0.04 to 0.22), 0.156 |
–0.33 (–0.44 to –0.22), <0.001 |
0.26 (0.15 to 0.38), <0.001 |
–0.16 (–0.27 to –0.05), 0.006 |
–0.02 (–0.14 to 0.09), 0.683 | –0.07 (–0.17 to 0.03), 0.179 | –0.02 (–0.13 to 0.09), 0.684 | 0.22 (0.10 to 0.34), 0.001 |
| Ethnicity | ||||||||
| African American vs. Caucasian | 0.22 (0.09 to 0.35), 0.001 | 0.05 (–0.08 to 0.17), 0.456 | –0.04 (–0.17 to 0.08), 0.487 | 0.23 (0.11 to 0.35), <0.001 | 0.16 (0.03 to 0.29), 0.013 | 0.20 (0.09 to 0.30), <0.001 | 0.00 (–0.11 to 0.12), 0.977 |
–0.16 (–0.30 to –0.03), 0.017 |
| Other vs. Caucasian | 0.02 (–0.24 to 0.28), 0.855 | 0.00 (–0.24 to 0.24), 0.976 | 0.02 (–0.22 to 0.26), 0.858 | 0.22 (–0.02 to 0.45), 0.071 | 0.12 (–0.12 to 0.37), 0.325 | 0.06 (–0.14 to 0.27), 0.554 | –0.10 (–0.33 to 0.13), 0.377 | 0.09 (–0.17 to 0.35), 0.489 |
| Social functioning |
–0.01 (–0.01 to –0.00), <0.001 |
–0.00 (–0.01 to –0.00), 0.023 |
–0.00 (–0.01 to –0.00), 0.020 |
–0.01 (–0.01 to –0.01), <0.001 |
–0.01 (–0.02 to –0.01), <0.001 |
–0.01 (–0.01 to –0.00), <0.001 |
0.01 (0.01 to 0.01), <0.001 |
–0.01 (–0.01 to –0.00), <0.001 |
| DSM diagnosis | ||||||||
| Schizoaffective vs. bipolar disorder | 0.34 (0.17 to 0.50), <0.001 | 0.27 (0.13 to 0.41), <0.001 | 0.15 (0.01 to 0.30), 0.042 | 0.87 (0.74 to 1.00), <0.001 | 0.58 (0.43 to 0.73), <0.001 | 0.46 (0.33 to 0.58), <0.001 | –0.30 (–0.48 to –0.15), <0.001 | 0.29 (0.13 to 0.45), <0.001 |
| Schizophrenia vs. bipolar disorder | 0.06 (–0.09 to 0.21), 0.417 | 0.70 (0.58 to 0.83), <0.001 |
–0.40 (–0.54 to –0.28), <0.001 |
0.75 (0.63 to 0.87), <0.001 | 0.55 (0.42 to 0.68), <0.001 | 0.53 (0.42 to 0.64), <0.001 | –0.24 (–0.37 to –0.12), <0.001 | –0.08 (–0.22 to 0.06), 0.286 |
| B‐SNIP biotypes | ||||||||
| Biotype 2 vs. biotype 1 | 0.16 (–0.01 to 0.34), 0.070 | –0.13 (–0.29 to 0.04), 0.132 | 0.19 (0.03 to 0.35), 0.022 | –0.09 (–0.25 to 0.07), 0.283 | –0.05 (–0.22 to 0.12), 0.574 |
–0.16 (–0.30 to –0.01), 0.033 |
–0.01 (–0.16 to 0.15), <0.924 | 0.11 (–0.06 to 0.29), <0.001 |
| Biotype 3 vs. biotype 1 | 0.03 (–0.14 to 0.20), 0.712 |
–0.37 (–0.53 to –0.22), <0.001 |
0.12 (–0.03 to 0.28), 0.117 |
–0.26 (–0.42 to –0.11), 0.001 |
–0.21 (–0.37 to –0.05), 0.010 |
–0.30 (–0.44 to –0.16), <0.001 |
0.02 (–0.12 to 0.17), 0.751 | 0.13 (–0.04 to 0.29), 0.129 |
B‐SNIP – Bipolar‐Schizophrenia Network on Intermediate Phenotypes
Symptom profiles showed that, compared with psychotic bipolar I disorder, factor scores on the general, non‐affective, affective, positive, negative, disorganized and depressive symptom dimensions were higher for schizoaffective disorder (all p<0.05) (Table 3). By contrast, factor scores on the specific manic symptom dimension were lower for schizoaffective than psychotic bipolar I disorder (p<0.001). Further, factor scores on the non‐affective, positive, negative and disorganized symptom dimensions were higher, and factor scores on the affective and manic symptom dimensions lower, for schizophrenia than for psychotic bipolar I disorder (all p<0.001).
Table 4 further shows that factor scores for the general psychosis dimension were significantly higher for patients with African American than Caucasian ethnicity (p=0.001) and with lower social functioning (p<0.001). Further, factor scores for the non‐affective psychosis dimension were lower in women (p<0.001), but higher in younger patients (p=0.001) and patients with lower social functioning (p=0.023). Factor scores for the affective psychosis dimension increased with increasing age (p=0.017) and were higher in female patients (p<0.001) and those with lower social functioning (p=0.020). Older patients had higher factor scores on specific positive and disorganized symptom dimensions. Female patients scored lower on the specific positive symptom dimension and higher on the specific depressive symptom dimension (all p<0.05).
Compared with Caucasian patients, patients with African American ethnicity had higher factor scores on the positive, negative and disorganized symptom dimensions and lower scores on the depressive symptom dimension (all p<0.05). Social functioning decreased as scores on positive, negative, disorganized and depressive symptom dimensions increased, whereas social functioning increased with increasing scores on the manic symptom dimension (all p<0.05).
When we examined the utility of symptom dimensions for classifying patients correctly into categorical DSM diagnoses of psychotic disorders using multinomial ROC analysis, this showed that the proportion of patients correctly classified into diagnostic categories based on factor scores of general, non‐affective, affective and specific symptom dimensions (M=0.57, 95% CI: 0.53‐0.62) was higher compared with classifying patients by chance (M=0.39, 95% CI: 0.33‐0.44).
We next examined the utility of symptom dimensions for accurately predicting the B‐SNIP psychosis biotypes. Figure 1 (and Table 4) shows high non‐affective, positive, negative and disorganized symptom factor scores for Biotype 1; high affective, manic and depressive symptom factor scores for Biotype 3; and high general symptom dimension (and moderate other symptom dimension) factor scores for Biotype 2.
Figure 1.
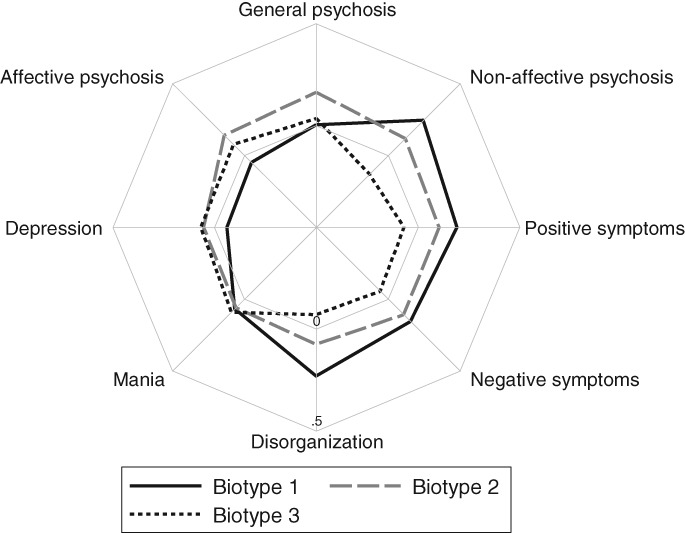
Symptom profiles by the Bipolar‐Schizophrenia Network on Intermediate Phenotypes (B‐SNIP) biotypes
There was evidence that the proportion of patients correctly classified into B‐SNIP biotypes based on factor scores of general, non‐affective, affective and specific symptom dimensions (M=0.41, 95% CI: 0.35‐0.47) was higher than what would be expected by chance (M=0.35, 95% CI: 0.29‐0.41). However, this did not hold for categorical DSM diagnoses (DSM diagnoses: M=0.41, 95% CI: 0.36‐0.46; random accuracy: M=0.38, 95% CI: 0.31‐0.44).
As can be seen in Figure 2, findings on ROC curves further indicated that patients were classified into B‐SNIP biotypes with greater accuracy based on symptom dimensions (AUC=0.87) than DSM diagnoses (AUC=0.68).
Figure 2.
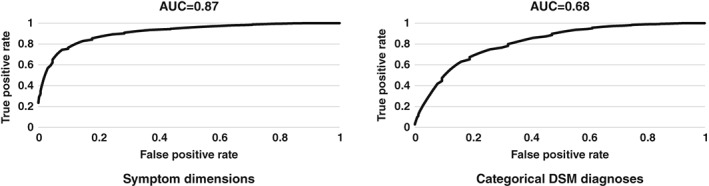
Multinomial receiver operating characteristic (ROC) curves of transdiagnostic symptom dimensions and categorical DSM diagnoses used in the prediction of Bipolar‐Schizophrenia Network on Intermediate Phenotypes (B‐SNIP) biotypes (discontinuities due to rounding of the estimated density functions)
DISCUSSION
Main findings
This study provides evidence of a transdiagnostic dimension underlying affective and non‐affective psychotic symptoms in patients with psychotic disorder in the B‐SNIP consortium. There was further evidence to suggest that formation of distinct dimensions of non‐affective and affective psychosis as well as specific psychosis dimensions of positive symptoms, negative symptoms, disorganization, mania and depression is justified.
Transdiagnostic, non‐affective, affective and specific symptom dimensions were differentially associated with age, gender, ethnicity and social functioning, and classified patients correctly into categorical DSM diagnoses. Finally, there was evidence on the utility of symptom dimensions for predicting the B‐SNIP biotypes with greater accuracy than DSM diagnoses.
Methodological considerations
In the current study, we examined the dimensionality of psychotic disorders in a large sample of patients with schizophrenia, schizoaffective and bipolar I disorder with psychosis. This sample allowed for multidimensional item response modeling to identify variance driven by a transdiagnostic psychosis dimension independent from variance due to non‐affective, affective and specific symptom dimensions based on extensively studied measures of psychosis, mania and depression (i.e., the PANSS, YMRS and MADRS).
While further sub‐dimensions of mania, depression and other specific symptom dimensions (positive, negative and disorganized symptoms) may have been considered, the focus of the current study was on transdiagnostic, affective/non‐affective psychosis and specific symptom dimensions, but not subcomponents of these (e.g., avolition as a subcomponent of the negative symptom dimension; euphoria as a subcomponent of mania; or anhedonia as a subcomponent of depression). Models to account for these subcomponents would have been difficult to estimate even with the sample size obtained in this study, given the high number of items required and free parameters to be estimated in such models. Further, a more stringent measurement design (e.g., a multitrait‐multimethod design) would have been required to disentangle measurement from substantive conceptual variance.
The use of YMRS and MADRS as more detailed measures of mania and depression, however, did allow us to capture a broader spectrum of variance than would have been the case when using the PANSS alone, and hence provided a better reflection of these specific symptom dimensions. They now need to be investigated further to disentangle method and substantive conceptual variance, using comprehensive measures of psychopathology in large samples of psychotic disorders, including psychotic depression.
Comparison with previous research
Evidence on a transdiagnostic dimension underlying affective and non‐affective psychotic symptoms in the current sample of clinically stable patients is consistent with our earlier findings on such a dimension in patients with early and enduring psychosis4, 5. Reverberating the results of numerous previous studies30, including our own4, 5, we identified five specific symptom dimensions of positive symptoms, negative symptoms, disorganization, mania and depression.
Our findings move beyond those from previous research in providing evidence of distinct non‐affective and affective psychosis dimensions in addition to transdiagnostic and specific symptom dimensions. These were primarily characterized by negative and disorganized symptom ratings (for the non‐affective dimension) and depressive and manic symptom ratings (for the affective dimension).
According to the recently proposed hierarchical taxonomy of psychopathology24, the broad transdiagnostic psychosis dimension may best be interpreted at the level of psychopathological super‐spectra or higher‐order dimensions, whereas specific symptom dimensions may be classified at lower levels as symptom components, and non‐affective and affective psychosis dimensions as psychopathological spectra or syndromes24.
While the latter may resemble the previously reported thought disorder and internalizing dimensions2, the extent to which the transdiagnostic psychosis dimension overlaps with, or is independent from, a general psychopathology factor43 remains to be established. As the evidence base on the dimensionality of psychotic disorders continues to emerge and strengthen, the need for transdiagnostic investigations of psychotic and non‐psychotic disorders becomes more pressing to examine important spectra or syndromes across disorders.
Notably, our finding of higher factor scores on the positive, negative and disorganized symptom dimensions and lower scores on the depressive symptom dimension in patients with African American ethnicity compared with Caucasian patients is in line with earlier studies reporting higher positive44, 45, negative45 and disorganized44 symptom scores, as well as lower depressive symptom scores44, in patients with Black African compared with White Dutch and White British ethnicity in the Netherlands45 and the UK44, respectively. Our findings additionally showed that factor scores on the transdiagnostic psychosis dimension were higher for African American than Caucasian patients. Overall, the associations between transdiagnostic, non‐affective, affective and specific symptom dimensions on the one hand, and age, gender, ethnicity and social functioning on the other, were broadly consistent with the clinical and social epidemiology of psychosis and, therefore, in support of their concurrent validity17, 46, 47, 48, 49.
These dimensions, however, need not only be valid but also useful14. In order to elucidate the utility of the symptom dimensions we identified here, we investigated their accuracy for classifying patients into categorical DSM diagnoses and the B‐SNIP psychosis biotypes. Overall, strong diagnostic utility of the transdiagnostic, non‐affective, affective and specific symptom dimensions for allocating patients to DSM diagnoses was demonstrated with the PANSS, YMRS and MADRS, which are all established clinical symptom measures that can be used in both research and routine care. Since our findings on symptom profiles by DSM diagnoses were consistent with operational definitions of current classification systems, these may provide a basis for a psychometrically‐informed approach for more accurate classification of patients into these diagnoses.
When we examined the utility of symptom dimensions in relation to the recently identified B‐SNIP biotypes32, this showed that patients were classified into these biotypes with greater accuracy based on symptom dimensions than categorical DSM diagnoses. Findings further showed more pronounced non‐affective (Biotype 1), affective (Biotype 3) and transdiagnostic (Biotype 2) dimensional symptom profiles for individual B‐SNIP biotypes (Figure 1).
More generally, these findings show how dimensional psychopathological phenotypes can be characterized by connecting them to basic neurobiological constructs and, vice versa, offer valid dimensional psychopathological phenotypes to research into basic neurobiological dimensions of psychopathology such as RDoC12, 20, 21, 24. In other words, joining hands rather than viewing phenomenological and neurobiological approaches as separate or competing endeavors may be the way forward.
CONCLUSIONS
Our findings provide new evidence on the dimensionality of psychosis spectrum disorders and, specifically, suggest that a transdiagnostic psychosis dimension, distinct non‐affective and affective psychosis dimensions and five specific symptom dimensions best account for symptom data collected using widely established measures in patients with schizophrenia, schizoaffective and bipolar I disorder with psychosis. There was also strong evidence on the utility of these dimensions in relation to categorical DSM diagnoses and B‐SNIP psychosis biotypes. This should inform use of dimensional approaches in current diagnostic classification systems.
Findings further show promising avenues for research at the interface of dimensional psychopathological phenotypes and other transdiagnostic approaches such as RDoC focusing on basic neurobiological dimensions of psychopathology1, 2, 3, 4, 5, 6, 7, 8, 9, 10, 11, 12, 13, 14, 15, 16, 17, 20, 21. This needs to be extended to transdiagnostic investigations of shared and non‐shared genetic and socio‐environmental factors of symptom dimensions of psychotic and non‐psychotic disorders to examine overlap (and independence) of important spectra or syndromes and more fully map and model the dimensionality of mental disorders as a basis for (more) valid diagnostic classification systems.
ACKNOWLEDGEMENTS
U. Reininghaus and J.R. Böhnke contributed to this work as joint first authors. The study was supported by the Netherlands Organization for Scientific Research (NOW) Veni grant 451‐13‐022 and the US National Institute of Mental Health (NIMH) grants MH‐077851, MH‐078113, MH‐077945, MH‐077852 and MH‐077862. The authors thank B. Witte and G. Poudyal for their contributions to data management, which allowed for seamless analysis and inspection of all B‐SNIP data resources, and the patient and family volunteers who joined the study and contributed their time and individual data.
REFERENCES
- 1. Carpenter WT, Bustillo JR, Thaker GK et al. The psychoses: cluster 3 of the proposed meta‐structure for DSM‐V and ICD‐11. Psychol Med 2009;39: 2025‐42. [DOI] [PubMed] [Google Scholar]
- 2. Krueger RF, Eaton NR. Transdiagnostic factors of mental disorders. World Psychiatry 2015;14:27‐9. [DOI] [PMC free article] [PubMed] [Google Scholar]
- 3. Krueger RF, Piasecki TM. Toward a dimensional and psychometrically‐informed approach to conceptualizing psychopathology. Behav Res Ther 2002;40:485‐99. [DOI] [PubMed] [Google Scholar]
- 4. Reininghaus U, Bohnke JR, Hosang G et al. Evaluation of the validity and utility of a transdiagnostic psychosis dimension encompassing schizophrenia and bipolar disorder. Br J Psychiatry 2016;209:107‐13. [DOI] [PubMed] [Google Scholar]
- 5. Reininghaus U, Priebe S, Bentall RP. Testing the psychopathology of psychosis: evidence for a general psychosis dimension. Schizophr Bull 2013;39:884‐95. [DOI] [PMC free article] [PubMed] [Google Scholar]
- 6. Cuthbert BN. The RDoC framework: facilitating transition from ICD/DSM to dimensional approaches that integrate neuroscience and psychopathology. World Psychiatry 2014;13:28‐35. [DOI] [PMC free article] [PubMed] [Google Scholar]
- 7. Borsboom D. A network theory of mental disorders. World Psychiatry 2017;16:5‐13. [DOI] [PMC free article] [PubMed] [Google Scholar]
- 8. First MB, Rebello TJ, Keeley JW et al. Do mental health professionals use diagnostic classifications the way we think they do? A global survey. World Psychiatry 2018;17:187‐95. [DOI] [PMC free article] [PubMed] [Google Scholar]
- 9. Jablensky A. Psychiatric classifications: validity and utility. World Psychiatry 2016;15:26‐31. [DOI] [PMC free article] [PubMed] [Google Scholar]
- 10. Kotov R, Krueger RF, Watson D. A paradigm shift in psychiatric classification: the Hierarchical Taxonomy Of Psychopathology (HiTOP). World Psychiatry 2018;17:24‐5. [DOI] [PMC free article] [PubMed] [Google Scholar]
- 11. Maj M. The DSM‐5 approach to psychotic disorders: is it possible to overcome the ‘inherent conservative bias’? Schizophr Res 2013;150:38‐9. [DOI] [PubMed] [Google Scholar]
- 12. Maj M. Narrowing the gap between ICD/DSM and RDoC constructs: possible steps and caveats. World Psychiatry 2016;15:193‐4. [DOI] [PMC free article] [PubMed] [Google Scholar]
- 13. Maj M. The need for a conceptual framework in psychiatry acknowledging complexity while avoiding defeatism. World Psychiatry 2016;15:1‐2. [DOI] [PMC free article] [PubMed] [Google Scholar]
- 14. Maj M. Why the clinical utility of diagnostic categories in psychiatry is intrinsically limited and how we can use new approaches to complement them. World Psychiatry 2018;17:121‐2. [DOI] [PMC free article] [PubMed] [Google Scholar]
- 15. McGorry PD, Hartmann JA, Spooner R et al. Beyond the “at risk mental state” concept: transitioning to transdiagnostic psychiatry. World Psychiatry 2018;17:133‐42. [DOI] [PMC free article] [PubMed] [Google Scholar]
- 16. Owen MJ, O'Donovan MC. Schizophrenia and the neurodevelopmental continuum: evidence from genomics. World Psychiatry 2017;16:227‐35. [DOI] [PMC free article] [PubMed] [Google Scholar]
- 17. van Os J, Reininghaus U. Psychosis as a transdiagnostic and extended phenotype in the general population. World Psychiatry 2016;15:118‐24. [DOI] [PMC free article] [PubMed] [Google Scholar]
- 18. Widiger TA. A dimensional model of psychopathology. Psychopathology 2005;38:211‐4. [DOI] [PubMed] [Google Scholar]
- 19. Barch DM. The neural correlates of transdiagnostic dimensions of psychopathology. Am J Psychiatry 2017;174:613‐5. [DOI] [PubMed] [Google Scholar]
- 20. Cuthbert BN, Insel TR. Toward new approaches to psychotic disorders: the NIMH Research Domain Criteria project. Schizophr Bull 2010;36:1061‐2. [DOI] [PMC free article] [PubMed] [Google Scholar]
- 21. Cuthbert BN, Insel TR. Toward the future of psychiatric diagnosis: the seven pillars of RDoC. BMC Med 2013;11:126. [DOI] [PMC free article] [PubMed] [Google Scholar]
- 22. Tamminga CA, Ivleva EI, Keshavan MS et al. Clinical phenotypes of psychosis in the Bipolar‐Schizophrenia Network on Intermediate Phenotypes (B‐SNIP). Am J Psychiatry 2013;170:1263‐74. [DOI] [PubMed] [Google Scholar]
- 23. Tamminga CA, Pearlson G, Keshavan M et al. Bipolar and schizophrenia network for intermediate phenotypes: outcomes across the psychosis continuum. Schizophr Bull 2014;40(Suppl. 2):S131‐7. [DOI] [PMC free article] [PubMed] [Google Scholar]
- 24. Krueger RF, Kotov R, Watson D et al. Progress in achieving quantitative classification of psychopathology. World Psychiatry 2018;17:282‐93. [DOI] [PMC free article] [PubMed] [Google Scholar]
- 25. Laursen TM, Agerbo E, Pedersen CB. Bipolar disorder, schizoaffective disorder, and schizophrenia overlap: a new comorbidity index. J Clin Psychiatry 2009;70:1432‐8. [DOI] [PubMed] [Google Scholar]
- 26. Rosen C, Marvin R, Reilly JL et al. Phenomenology of first‐episode psychosis in schizophrenia, bipolar disorder, and unipolar depression: a comparative analysis. Clin Schizophr Relat Psychoses 2012;6:145‐51. [DOI] [PubMed] [Google Scholar]
- 27. Cardno AG, Owen MJ. Genetic relationships between schizophrenia, bipolar disorder, and schizoaffective disorder. Schizophr Bull 2014;40:504‐15. [DOI] [PMC free article] [PubMed] [Google Scholar]
- 28. Lichtenstein P, Yip BH, Björk C et al. Common genetic determinants of schizophrenia and bipolar disorder in Swedish families: a population‐based study. Lancet 2009;373:234‐9. [DOI] [PMC free article] [PubMed] [Google Scholar]
- 29. Laursen TM, Munk‐Olsen T, Nordentoft M et al. A comparison of selected risk factors for unipolar depressive disorder, bipolar affective disorder, schizoaffective disorder, and schizophrenia from a Danish population‐based cohort. J Clin Psychiatry 2007;68:1673‐81. [DOI] [PubMed] [Google Scholar]
- 30. van Os J, Kapur S. Schizophrenia. Lancet 2009;374:635‐45. [DOI] [PubMed] [Google Scholar]
- 31. Russo M, Levine SZ, Demjaha A et al. Association between symptom dimensions and categorical diagnoses of psychosis: a cross‐sectional and longitudinal investigation. Schizophr Bull 2014;40:111‐9. [DOI] [PMC free article] [PubMed] [Google Scholar]
- 32. Clementz BA, Sweeney JA, Hamm JP et al. Identification of distinct psychosis biotypes using brain‐based biomarkers. Am J Psychiatry 2016;173:373‐84. [DOI] [PMC free article] [PubMed] [Google Scholar]
- 33. First MB, Spitzer RL, Gibbon M et al. Structured clinical interview for DSM‐IV axis I disorders – clinician version (SCID‐CV). Washington: American Psychiatric Press, 1997. [Google Scholar]
- 34. Kay SR, Fiszbein A, Opler LA. The positive and negative syndrome scale (PANSS) for schizophrenia. Schizophr Bull 1987;13:261‐76. [DOI] [PubMed] [Google Scholar]
- 35. Young R, Biggs J, Ziegler V et al. A rating scale for mania: reliability, validity and sensitivity. Br J Psychiatry 1978;133:429‐35. [DOI] [PubMed] [Google Scholar]
- 36. Montgomery SA, Asberg M. A new depression scale designed to be sensitive to change. Br J Psychiatry 1979;134:382‐9. [DOI] [PubMed] [Google Scholar]
- 37. Birchwood M, Smith J, Cochrane R et al. The Social Functioning Scale. The development and validation of a new scale of social adjustment for use in family intervention programmes with schizophrenic patients. Br J Psychiatry 1990;157:853‐9. [DOI] [PubMed] [Google Scholar]
- 38. Chalmers RP, Flora DB. Maximum‐likelihood estimation of noncompensatory IRT models with the MH‐RM algorithm. Appl Psychol Measur 2014;38:339‐58. [Google Scholar]
- 39. Kass RE, Wasserman L. A reference Bayesian test for nested hypotheses and its relationship to the Schwarz criterion. J Am Stat Assoc 1995;90:928‐34. [Google Scholar]
- 40. Gibbons RD, Hedeker DR. Full‐information bi‐factor analysis. Psychometrika 1992;57:423‐36. [Google Scholar]
- 41. Peterson LE, Coleman MA. Machine learning‐based receiver operating characteristic (ROC) curves for crisp and fuzzy classification of DNA microarrays in cancer research. Int J Approx Reason 2008;47:17‐36. [DOI] [PMC free article] [PubMed] [Google Scholar]
- 42. StataCorp . Stata Statistical Software: release 14. StataCorp, LP, 2015. [Google Scholar]
- 43. Lahey BB, Krueger RF, Rathouz PJ et al. Validity and utility of the general factor of psychopathology. World Psychiatry 2017;16:142‐3. [DOI] [PMC free article] [PubMed] [Google Scholar]
- 44. Kirkbride JB, Hindocha C, Hameed Y et al. Do symptom dimensions vary between ethnic groups at first presentation to early intervention in psychosis services? Evidence from the SEPEA study. Early Interv Psychiatry 2016;10(Suppl. 1):15‐6. [Google Scholar]
- 45. Veling W, Selten JP, Mackenbach JP et al. Symptoms at first contact for psychotic disorder: comparison between native Dutch and ethnic minorities. Schizophr Res 2007;95:30‐8. [DOI] [PubMed] [Google Scholar]
- 46. Cantor‐Graae E, Selten JP. Schizophrenia and migration: a meta‐analysis and review. Am J Psychiatry 2005;162:12‐24. [DOI] [PubMed] [Google Scholar]
- 47. Reininghaus U, Craig TK, Fisher HL et al. Ethnic identity, perceptions of disadvantage, and psychosis: findings from the AESOP study. Schizophr Res 2010;124:43‐8. [DOI] [PubMed] [Google Scholar]
- 48. Reininghaus U, Morgan C, Simpson J et al. Unemployment, social isolation, achievement‐expectation mismatch and psychosis: findings from the AESOP Study. Soc Psychiatry Psychiatr Epidemiol 2008;43:743‐51. [DOI] [PubMed] [Google Scholar]
- 49. van Os J, Reininghaus U. The clinical epidemiology of schizophrenia In: Sadock B, Sadock V, Ruiz P. (eds). Comprehensive textbook of psychiatry (Kaplan & Sadock's). Baltimore: Lippincott Williams & Wilkins, 2017:1445‐56. [Google Scholar]