

Abstract
A timely determination of the risk of post‐traumatic stress disorder (PTSD) is a prerequisite for efficient service delivery and prevention. We provide a risk estimate tool allowing a calculation of individuals’ PTSD likelihood from early predictors. Members of the International Consortium to Predict PTSD (ICPP) shared individual participants’ item‐level data from ten longitudinal studies of civilian trauma survivors admitted to acute care centers in six countries. Eligible participants (N=2,473) completed an initial clinical assessment within 60 days of trauma exposure, and at least one follow‐up assessment 4‐15 months later. The Clinician‐Administered PTSD Scale for DSM‐IV (CAPS) evaluated PTSD symptom severity and diagnostic status at each assessment. Participants’ education, prior lifetime trauma exposure, marital status and socio‐economic status were assessed and harmonized across studies. The study's main outcome was the likelihood of a follow‐up PTSD given early predictors. The prevalence of follow‐up PTSD was 11.8% (9.2% for male participants and 16.4% for females). A logistic model using early PTSD symptom severity (initial CAPS total score) as a predictor produced remarkably accurate estimates of follow‐up PTSD (predicted vs. raw probabilities: r=0.976). Adding respondents’ female gender, lower education, and exposure to prior interpersonal trauma to the model yielded higher PTSD likelihood estimates, with similar model accuracy (predicted vs. raw probabilities: r=0.941). The current model could be adjusted for other traumatic circumstances and accommodate risk factors not captured by the ICPP (e.g., biological, social). In line with their use in general medicine, risk estimate models can inform clinical choices in psychiatry. It is hoped that quantifying individuals’ PTSD risk will be a first step towards systematic prevention of the disorder.
Keywords: Post‐traumatic stress disorder, prediction, risk assessment tool, trauma survivors, clinician‐administered PTSD scale for DSM‐IV (CAPS), female gender, lower education, exposure to prior interpersonal trauma, prevention
Post‐traumatic stress disorder (PTSD) is the most frequent psychopathological consequence of traumatic events1, 2. Chronic PTSD is tenacious, debilitating and frequently intractable3, 4, 5, 6, 7, 8, 9. Early PTSD symptoms are sensitive but non‐specific predictors of chronic PTSD10. They subside in over 70% of those expressing them11, 12, 13, whilst few initially asymptomatic survivors develop delayed‐onset PTSD14.
Early cognitive behavioral interventions significantly reduce the prevalence of PTSD, and their effect is stable8, 15, 16. These interventions, however, are resource‐demanding, and unnecessary for low‐risk survivors, whose symptoms subside spontaneously15, 17. Thus, an accurate individual estimate of survivors’ risk for chronic PTSD is a prerequisite for efficient prevention and service planning18.
Previous studies have had difficulty producing such estimates, due to the multiplicity, complexity and distributional variation of PTSD risk indicators. Additionally, most studies have attempted to predict cases (i.e., who will develop PTSD) rather than produce PTSD likelihood estimates for every participant (i.e., how likely is a person to develop PTSD)19, 20.
Longitudinal studies have nonetheless reported numerous group‐level PTSD risk indicators21, 22, such as female gender23, 24, age23, education25, ethnicity26, lifetime exposure to traumatic events27, and marital status24. Several symptom‐based case predictions have been developed, consistently performing better than chance28, 29, 30, 31, but unable to build a reliable, personalized risk estimator32. Meta‐analyses21, 22 and systematic reviews21, 22, 33, 34 have similarly endorsed group‐level risk indicators without a clear path to clinical implementation34.
Trauma admissions to acute care centers and emergency departments (EDs) offer a first point of contact with numerous survivors at risk. EDs evaluate in the US over 39 million individuals yearly for treatment of traumatic injury35, 36, 37, 38, 39. Worldwide, road traffic accidents, a mainstay cause of ED admissions, cause an estimated 1.25 million deaths and over 20 million non‐fatal injuries yearly40.
The prevalence of PTSD after ED admissions resembles that seen in survivors who do not require or receive ED care – e.g., 52% incidence of new PTSD among women survivors of interpersonal violence admitted to EDs vs. 51‐76% among women surveyed in shelters, domestic‐violence clinics and therapy groups41, 42. The 18‐month prevalence of PTSD among drivers admitted to general hospitals after injury‐producing car crashes (11%) is somewhat higher than that of car drivers not seen in EDs (7%)43.
Quantifying individuals’ PTSD risk following acute care trauma admission could provide an empirical foundation for mitigating and preventing a major public health issue. Towards that goal, members of the International Consortium to Predict PTSD (ICPP) shared item‐level data from ten longitudinal, acute care based studies of the early development of PTSD, performed in the US, Australia, Japan, Israel, Switzerland, and The Netherlands. The data were harmonized, pooled into a single individual participant‐level dataset (IPD) and submitted to data analysis.
An analysis of IPD, or mega‐analysis, offers a sensible approach to aggregating data across studies44, 45. Unlike systematic reviews and meta‐analyses, mega‐analyses do not rely on the original studies’ data analytic approaches and reporting perspectives and enable direct estimates of parameters of interest (i.e., predictors, outcomes). This allows data source heterogeneity and subgroup variations to be examined directly, and makes it possible to interrogate the combined data in ways not considered, or impossible, in the component studies, due to their sample sizes or limited population diversity46, 47.
In line with current medical risk assessment practices (e.g., in oncology48, 49, 50, surgery or cardiology51, 52, 53, 54), we used the ICPP IPD to develop a prediction function that estimates the probability of PTSD given a set of early, observable risk indicators. Following replicated demonstrations of their predictive yield in classification models55, 56, 57, 58, 59, 60, 61, 62, we positioned PTSD symptoms as a key predictor, subsequently enriching the predictive models by including other previously documented and clinically‐obtainable risk indicators available in the ICPP dataset (e.g., gender, trauma type, lifetime trauma history).
METHODS
Studies, participants and variables
Using a previously described literature search strategy63, the ICPP IPD consisted of thirteen longitudinal acute‐care based studies of recent trauma survivors conducted in six countries. Investigators obtained informed consent using procedures approved by their local institutional review boards. Item‐level data from studies were shared, harmonized (see below) and combined into a pooled dataset. All ICPP studies used the DSM‐IV PTSD template to infer PTSD diagnosis and symptom severity. Included in this report are the ten studies15, 64, 65, 66, 67, 68, 69, 70, 71, 72 that used the repeatedly validated Clinician‐Administered PTSD Scale for DSM‐IV (CAPS)73, 74.
Study participants were included if they had an initial CAPS interview within 60 days of the traumatic event, and at least one follow‐up CAPS assessment 4 to 15 months (122 to 456 days) after trauma exposure. These criteria were met by 2,473 participants (Table 1). To maximize the utility of prediction, we used the earliest observation for individuals with two early (<60 days) assessments, and the latest observation for those with multiple assessments during follow‐up.
Table 1.
Key participant characteristics in contributing studies and in the total sample
| Hepp et al64 | Shalev et al65 | Jenewein et al67 | Irish et al68 | Bryant et al69 | Shalev et al70 | Shalev et al15 | Matsuoka et al71 | Mouthaan et al72 | Frijling et al66 | Total sample | |
|---|---|---|---|---|---|---|---|---|---|---|---|
| Country | SUI | ISR | SUI | US | AUS | ISR | ISR | JPN | NLD | NLD | |
| Eligible participants (N) | 109 | 27 | 255 | 143 | 825 | 103 | 529 | 92 | 348 | 42 | 2,473 |
| Age (mean±SD) | 38.0±13.1 | 28.4±10.5 | 41.3±12.9 | 39.1±15.4 | 38.7±13.6 | 31.9±11.7 | 37.2±12.0 | 38.8±16.1 | 44.5±15.7 | 36.9±14.0 | 39.0±13.9 |
| Gender (% male) | 74 | 59 | 67 | 53 | 72 | 60 | 51 | 66 | 61 | 50 | 63 |
| High school education (%) | 85 | NA | 83 | 93 | 68 | 90 | 81 | 83 | 78 | 64 | 77 |
| Trauma type (%) | |||||||||||
| Motor vehicle accident | 60 | 85 | 31 | 100 | 65 | 82 | 82 | 100 | 65 | 69 | 69 |
| Other non‐interpersonal | 40 | 7 | 69 | 0 | 29 | 5 | 6 | 0 | 32 | 21 | 25 |
| Interpersonal | 0 | 7 | 0 | 0 | 6 | 11 | 12 | 0 | 3 | 10 | 6 |
| Prior trauma (%) | |||||||||||
| None | NA | 7 | NA | 48 | 27 | 42 | 33 | 45 | 41 | 50 | 29 |
| Non‐interpersonal | NA | 67 | NA | 42 | 61 | 38 | 32 | 28 | 46 | 50 | 40 |
| Interpersonal | NA | 22 | NA | 7 | 12 | 19 | 27 | 27 | 13 | 0 | 14 |
| Baseline CAPS score (mean±SD) | 21.6±15.3 | 33.8±31.5 | 13.3±13.0 | 24.8±22.6 | 16.9±15.6 | 25.9±24.7 | 57.1±24.9 | 20.0±17.4 | 20.7±18.5 | 38.5±19.4 | 27.4±25.1 |
| Endpoint PTSD (%) | 3.7 | 25.9 | 4.3 | 9.1 | 9.9 | 19.4 | 23.6 | 8.7 | 5.7 | 2.4 | 11.8 |
CAPS – Clinician‐Administered PTSD Scale for DSM‐IV, PTSD – post‐traumatic stress disorder, SUI – Switzerland, ISR – Israel, US – United States, AUS – Australia, JPN – Japan, NLD – The Netherlands, NA – not available
PTSD severity and diagnosis
The CAPS quantifies the frequency and severity of each of the seventeen DSM‐IV PTSD symptom criteria73 by assigning to each symptom a 0‐4 incremental frequency score and a 0‐4 intensity score. A continuous measure of PTSD severity is obtained by adding all individual symptom scores (CAPS total score). A diagnosis of PTSD is determined using DSM‐IV PTSD diagnostic criteria of at least one re‐experiencing (Criterion B), three avoidance/numbing (Criterion C), and two hyperarousal (Criterion D) symptoms73. Following recommendations, a PTSD symptom was deemed “present” if its frequency score was 1 or more, and its intensity score was 2 or more74, 75.
Information on DSM‐IV Criterion E (duration of at least one month) and F (clinically significant distress or impairment) were collected in four out of the ten studies. A sensitivity analysis within these studies found very high concordance between diagnoses determined by meeting DSM‐IV symptom criteria alone (i.e., criteria B through D) and those obtained using both the symptom criteria and the E and F criteria (sensitivity 0.92, specificity 1.00, Cohen's kappa=0.95). We consequently assumed PTSD diagnosis as present, across studies, based on meeting DSM‐IV PTSD symptom criteria alone.
Risk indicators
The study's primary risk indicator was PTSD severity at the initial assessment (CAPS0, range 0‐136), with age, gender, ethnicity, educational attainment, lifetime history of trauma exposure, and current trauma type considered as additional predictors.
Differences in data collection and instruments across studies required harmonization of four risk indicators. Educational attainment, which varied by participating countries’ schooling systems, was recoded into a binary variable of less than secondary education versus completion of at least secondary education. Recoding participants’ lifetime exposure to traumatic events followed a previous demonstration of a strong association between interpersonal trauma and PTSD76 and included: a) exposure to at least one instance of interpersonal violence (e.g., physical or sexual violence, war or terror), b) in the absence of the former, exposure to at least one instance of non‐interpersonal trauma (e.g., road traffic accidents), and c) no trauma exposure. Traumatic events leading to current acute care admission were categorized as motor vehicle accidents, other non‐interpersonal events, and interpersonal violence (e.g., assaults).
Data completeness and handling missing observations
CAPS0 data were available for all 2,473 participants. Data on age, gender, and current trauma were available for >99% of the sample. Marital status was missing in 4.5%, education in 6.2%, ethnicity in 12.3%, and prior trauma in 16.8% of the sample.
Participants missing at least one variable (N=791; 32%) differed from those with complete data (N=1,682) with respect to several risk indicators (Table 2). To address these missing observations, we present analyses in which missing predictors were handled by multiple imputation using chained equations (MICE) performed on the IPD77. Ten imputed datasets were created after twenty iterations and the results were pooled using Rubin's method78. For completeness, we also computed the results using individuals who had complete data (i.e., without imputation). The results did not differ substantially from those obtained after imputation and are available upon request.
Table 2.
Comparison of participants with complete and incomplete data
| Variable | Complete (N=1,682) | Incomplete (N=791) | p |
|---|---|---|---|
| Age (mean±SD) | 37.5±14.1 | 39.0±13.6 | 0.347 |
| CAPS0 (mean±SD) | 21.0±26.0 | 14.0±22.3 | <0.001 |
| Gender, N (%) | |||
| Male | 1,028 (66) | 533 (34) | <0.001 |
| Female | 654 (72) | 251 (28) | |
| Ethnicity, N (%) | |||
| White | 1,502 (76) | 481 (24) | <0.001 |
| Non‐White | 180 (97) | 5 (3) | |
| Education, N (%) | |||
| At least secondary education | 1,389 (73) | 505 (27) | 0.057 |
| Less than secondary education | 293 (69) | 133 (31) | |
| Marital status, N (%) | |||
| Married/living with a partner | 860 (74) | 304 (26) | 0.005 |
| Single/not living with a partner | 822 (69) | 375 (31) | |
| Trauma type, N (%) | |||
| Motor vehicle accident | 1,285 (75) | 421 (25) | <0.001 |
| Other non‐interpersonal | 291 (47) | 329 (53) | |
| Interpersonal | 106 (77) | 31 (23) | |
| Prior trauma, N (%) | |||
| None | 298 (86) | 49 (14) | <0.001 |
| Non‐interpersonal | 626 (87) | 93 (13) | |
| Interpersonal | 758 (76) | 233 (24) | |
| Endpoint PTSD, N (%) | |||
| No | 1,474 (68) | 708 (32) | 0.178 |
| Yes | 208 (71) | 83 (29) |
PTSD – post‐traumatic stress disorder, CAPS0 – baseline score on Clinician‐Administered PTSD Scale for DSM‐IV
Data analyses
Differences in frequency and severity of risk predictors between participants with and without endpoint PTSD were assessed using Mann–Whitney tests for continuous risk predictors and χ2 tests for categorical risk predictors. The number of participants endorsing each CAPS0 severity score (smoothed for five‐points intervals) was visualized using a histogram, separately for all participants and for those with PTSD at the study's endpoint.
The relatively large sample size in the ICPP dataset enabled us to obtain simple raw estimates of the probability of downstream PTSD for each CAPS0 score. The estimator used was the fraction of PTSD cases among all individuals with a given CAPS0 score, smoothed with a window of five adjacent points.
Logistic regression models were obtained using CAPS0 as the only predictor (CAPS0 model), CAPS0 plus all risk predictors (full model), and CAPS0 plus significant predictors only (significant predictors model). The models’ fits were evaluated using the Brier score79, Efron's R2, model's predicted‐to‐raw ratio, and the area under the receiver operating characteristic curve (AUC).
The Brier score79 measures the accuracy of probabilistic predictions. It expresses the mean standard error of the squared difference between the estimated probabilities and the true PTSD classification. Its range is 0 to 1. A Brier score of zero represents a perfect model and scores of 0.25 or greater signal a non‐informative model. Efron's R2 is the correlation between the predicted probabilities and the smoothed probabilities.
Two options were considered for selecting the regression model's intercept: a fixed effects intercept, where a common intercept is estimated after pooling or “stacking” the data together, and a random effects intercept, where the intercept is allowed to vary by study44. Random effects (or stratified approaches) have not been recommended when the prevalence of an outcome varies substantially between studies44, as is the case with the ICPP studies. Alternatively, it could be hypothesized that heterogeneity in endpoint PTSD prevalence across ICPP studies reflected heterogeneity in the distribution of CAPS0 severity across studies, which was due to variability in studies’ sampling routine. Under this hypothesis, ICPP studies could be seen as representing different samplings from a common parent population of acute care trauma admissions.
To evaluate the two models, we compared the predictive fits of the fixed effects and the random effects logistic regressions with CAPS0 as the only predictor, using a bootstrap approach where participants were randomly sampled with replacement, models were obtained, and then predicted probabilities from both models were estimated among the left‐out participants. For each approach, the ratio of expected PTSD diagnoses and actual PTSD diagnoses (expected/observed or E/O), the calibration slope βoverall (the slope from a logistic regression of the predicted probabilities on endpoint PTSD), and the Brier score were obtained. An E/O far from 1 indicates whether the model's intercept, which determines the predicted prevalence of PTSD, is too high or too low, while the calibration slope reflects heterogeneity of the predictor‐outcome associations or over‐fitting of the data44. This process was repeated 100 times with statistics averaged across iterations. A finding of poorer results in the fixed effects model compared to the random effects model would indicate that the studies were too heterogeneous to be analyzed together after accounting for differences in the distribution of CAPS0.
Differences in the predicted probability of PTSD given different risk factors were estimated by drawing 1,000 posterior simulations of each model's β coefficients, predicting endpoint PTSD at each value of CAPS0 with different risk profiles (e.g., male versus female gender), and evaluating the differences in the predicted probabilities across baseline CAPS0 scores80.
The selected time window for determining endpoint PTSD status (122‐456 days; 4‐15 months) maximized the number of ICPP studies included in each time interval. To evaluate whether the substantial width of that time window affected the results, and to additionally produce an estimate of prolonged PTSD likelihood, we repeated the logistic regressions using participants whose PTSD status was obtained 9 to15 months (273‐456 days) after the traumatic events.
RESULTS
Participants’ characteristics, risk predictors, and CAPS0 scores
Participants’ average age at studies’ onset was 39.0±13.9 years. There were fewer female participants (37%) in the sample than males. Motor vehicle accidents (69%) were the most common index trauma, followed by other types of non‐interpersonal trauma (25%) and interpersonal trauma (6%). The median time to the initial assessment was 15±16.7 days (range 1‐60). The median time to the endpoint assessment was 333±103.1 days (range 122‐456).
The prevalence of endpoint PTSD was 11.8% (N=291). Endpoint PTSD was significantly more frequent among female participants (16.4%, compared to 9.2% in males, p<0.001) and among participants who suffered interpersonal trauma compared to a motor vehicle accident or other traumatic events (respectively, 27%, 5% and 13%, p<0.001). No significant differences were observed by ethnicity, marital status, or age (see Table 3).
Table 3.
Sample variables stratified by endpoint post‐traumatic stress disorder (PTSD) status
| Variable | No endpoint PTSD | Endpoint PTSD | Total sample | p |
|---|---|---|---|---|
| N (%) | 2,182 (88) | 291 (12) | 2,473 | |
| Age (mean±SD) | 38.0±14.2 | 39.0±11.8 | 39.0±13.9 | 0.366 |
| CAPS0 (mean±SD) | 23.1±21.4 | 59.6±27.8 | 27.4±25.1 | <0.001 |
| Gender, N (%) | ||||
| Male | 1,418 (91) | 143 (9) | 1,561 | <0.001 |
| Female | 757 (84) | 148 (16) | 905 | |
| Missing | 7 (0.3) | |||
| Ethnicity, N (%) | ||||
| White | 1,742 (88) | 241 (12) | 1,983 | 0.592 |
| Non‐White | 165 (89) | 20 (11) | 185 | |
| Missing | 305 (12.3) | |||
| Education, N (%) | ||||
| At least secondary education | 1,698 (90) | 196 (10) | 1,894 | 0.051 |
| Less than secondary education | 368 (86) | 58 (14) | 426 | |
| Missing | 153 (6.2) | |||
| Marital status, N (%) | ||||
| Married/living with a partner | 1,035 (89) | 129 (11) | 1,164 | 0.780 |
| Single/not living with a partner | 1,060 (89) | 137 (11) | 1,197 | |
| Missing | 112 (4.5) | |||
| Current trauma type, N (%) | ||||
| Motor vehicle accident | 1,485 (87) | 221 (13) | 1,706 | <0.001 |
| Other non‐interpersonal | 588 (95) | 32 (5) | 620 | |
| Interpersonal | 100 (73) | 37 (27) | 137 | |
| Missing | 10 (0.4) | |||
| Prior trauma, N (%) | ||||
| None | 308 (89) | 39 (11) | 347 | 0.061 |
| Non‐interpersonal | 641 (89) | 78 (11) | 719 | |
| Interpersonal | 848 (86) | 143 (14) | 991 | |
| Missing | 416 (16.8) |
Comparisons (p values) are between participants with vs. without endpoint PTSD
CAPS0 – baseline score on Clinician‐Administered PTSD Scale for DSM‐IV
The histogram in Figure 1 displays the number of participants who endorsed each CAPS0 score, smoothed for a five points interval. As can be seen, the total number of participants declines progressively with increasing CAPS0 scores. The CAPS0 scores of participants with endpoint PTSD, however, span across the instrument's severity range, such that the proportion of those with endpoint PTSD increases with increasing CAPS0 severity.
Figure 1.
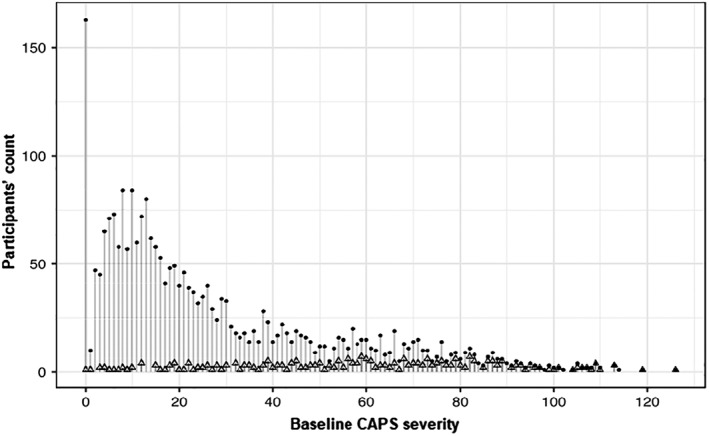
Histogram of participants’ baseline PTSD symptoms severity scores (CAPS0 total scores). Dots represent individual participants; overlayed triangles those who subsequently developed PTSD. PTSD – post‐traumatic stress disorder, CAPS0 – baseline score on Clinician‐Administered PTSD Scale for DSM‐IV.
Prediction of endpoint PTSD
The results from fixed effect models using CAPS0 alone (CAPS0 model), CAPS0 plus all available predictors (full model), and CAPS0 plus significant predictors only (significant predictors model) are presented in Table 4.
Table 4.
Coefficients (with SE) and fit statistics from the CAPS0, significant predictors and full models
| Model parameters | CAPS0 model | Significant predictors model | Full model |
|---|---|---|---|
| Intercept | –3.981*** (0.149) | –4.628*** (0.27) | –4.659*** (0.377) |
| CAPS0 | 0.05*** (0.003) | 0.051*** (0.003) | 0.05*** (0.003) |
| Female | ‐ | 0.307* (0.149) | 0.309* (0.151) |
| Age | ‐ | ‐ | 0 (0.006) |
| Less than secondary education | ‐ | 0.483** (0.186) | 0.486** (0.188) |
| Non‐White | ‐ | ‐ | 0.42 (0.281) |
| Single | ‐ | ‐ | 0.051 (0.164) |
| Current traumatic event | |||
| Interpersonal | ‐ | ‐ | 0.286 (0.255) |
| Other | ‐ | ‐ | –0.201 (0.222) |
| Lifetime trauma exposure | |||
| Non‐interpersonal | ‐ | 0.113 (0.249) | 0.128 (0.249) |
| Interpersonal | ‐ | 0.656** (0.237) | 0.662** (0.238) |
| Efron's R2 | 0.23 | 0.246 | 0.246 |
| Smoothed probability correlation | 0.976 | 0.946 | 0.941 |
| Brier score | 0.08 | 0.078 | 0.078 |
| AUC | 0.847 | 0.851 | 0.855 |
*p<0.05, **p<0.01, ***p<0.001
CAPS0 – baseline score on Clinician‐Administered PTSD Scale for DSM‐IV, AUC – area under receiver operating characteristic curve
The CAPS0 model (plotted in Figure 2 along with its 95% confidence interval) fits well (Efron's R2=0.230, Brier score=0.080, AUC=0.847), with a very high correlation between the model's predicted probability and the smoothed estimate of conditional probability (r=0.976). Logistic regression using the full model showed that female gender (β=0.309, SE=0.151, p=0.041), having less than a secondary education (β=0.486, SE=0.188, p=0.009), and prior interpersonal trauma (β=0.662, SE=0.238, p=0.006) contributed significantly to the PTSD outcome.
Figure 2.
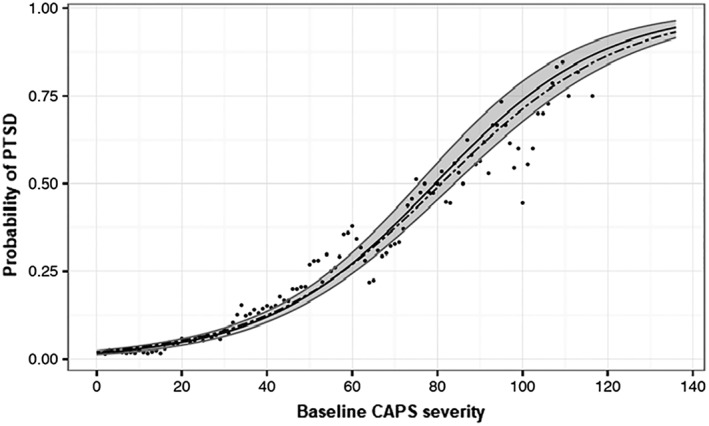
Predicted probabilities of endpoint PTSD conditional on initial (CAPS0) severity scores. The dots represent the raw conditional probability of PTSD at follow‐up given the CAPS0 score, smoothed with a kernel of width 5. The solid black line represents the logistic model predicted probability given the CAPS0 score. The gray area is the 95% confidence interval for the prediction model. The dashed line represents the prediction function derived from participants with follow‐up observations later than 9 months. PTSD – post‐traumatic stress disorder, CAPS0 – baseline score on Clinician‐Administered PTSD Scale for DSM‐IV.
With the inclusion of all risk indicators (full model) or that of significantly contributing factors (significant predictors model), accuracy remained high (respectively, smoothed probability correlation=0.941, Efron's R2=0.246, Brier score=0.078, AUC=0.855; and smoothed probability correlation=0.946, Efron's R2=0.246, Brier score=0.078, AUC=0.851). Thus, the addition of female gender, lifetime exposure to interpersonal violence, and less than a secondary education to the CAPS0 model increased PTSD likelihood whilst keeping the CAPS0 model's accuracy.
In the bootstrap analysis comparing the fixed effects logistic model with a random effects model using only CAPS0 as a predictor, the E/O ratio and βoverall from the fixed effects model (1.01 and 1.00, respectively) were closer to 1.00 than the random effects model (1.14 and 0.75, respectively), and the Brier score was lower on average for the fixed effects model (0.081, SD=0.01) than the random effects model (0.084, SD=0.01). Overall, the fixed effects model seems to estimate the likely number of participants with PTSD at follow‐up more accurately, with less heterogeneity or over‐fitting, than the random effects model, thereby supporting the pooling of participating studies.
After accounting for the CAPS0 effect, female participants were found to have a maximum of 5% (95% CI: –2% to 12%) higher risk for endpoint PTSD compared to male participants. Moreover, participants with all significant risk factors (i.e., female gender, less than secondary education, and exposure to prior interpersonal trauma) had a 34% (95% CI: 20‐48%) higher risk of PTSD compared to participants without any significant risk factors (i.e., male with secondary education and no prior interpersonal trauma). Estimated probabilities and 95% confidence intervals for endpoint PTSD based on each combination of the significant predictors are provided in Table 5.
Table 5.
Estimated probabilities (with 95% CIs) of endpoint PTSD diagnosis by incremental values of CAPS0 scores
| CAPS0 total score |
Probability of PTSD (CAPS0 alone) |
Probability of PTSD by gender (CAPS0 plus gender) |
Probability of PTSD by gender (CAPS0, plus less than secondary education, and prior interpersonal trauma) |
||
|---|---|---|---|---|---|
| Males | Females | Males | Females | ||
| 0 | 0.018 (0.014‐0.024) | 0.017 (0.013‐0.023) | 0.021 (0.015‐0.029) | 0.030 (0.020‐0.043) | 0.041 (0.025‐0.061) |
| 5 | 0.024 (0.018‐0.030) | 0.022 (0.017‐0.029) | 0.027 (0.020‐0.037) | 0.038 (0.026‐0.054) | 0.052 (0.033‐0.076) |
| 10 | 0.03‐ (0.024‐0.038) | 0.028 (0.021‐0.036) | 0.034 (0.025‐0.046) | 0.049 (0.034‐0.068) | 0.065 (0.042‐0.095) |
| 15 | 0.038 (0.031‐0.047) | 0.035 (0.028‐0.045) | 0.043 (0.033‐0.056) | 0.062 (0.044‐0.085) | 0.083 (0.054‐0.119) |
| 20 | 0.048 (0.040‐0.059) | 0.045 (0.036‐0.056) | 0.055 (0.042‐0.070) | 0.079 (0.056‐0.106) | 0.104 (0.070‐0.147) |
| 25 | 0.061 (0.051‐0.073) | 0.057 (0.046‐0.069) | 0.069 (0.054‐0.086) | 0.099 (0.071‐0.132) | 0.130 (0.089‐0.181) |
| 30 | 0.077 (0.066‐0.090) | 0.071 (0.059‐0.086) | 0.086 (0.069‐0.106) | 0.124 (0.091‐0.163) | 0.161 (0.113‐0.220) |
| 35 | 0.097 (0.084‐0.112) | 0.090 (0.075‐0.106) | 0.108 (0.088‐0.130) | 0.154 (0.114‐0.201) | 0.198 (0.142‐0.265) |
| 40 | 0.121 (0.106‐0.138) | 0.112 (0.094‐0.132) | 0.134 (0.111‐0.161) | 0.190 (0.143‐0.245) | 0.241 (0.177‐0.317) |
| 45 | 0.150 (0.133‐0.169) | 0.139 (0.117‐0.162) | 0.165 (0.139‐0.195) | 0.232 (0.177‐0.296) | 0.290 (0.218‐0.375) |
| 50 | 0.185 (0.165‐0.207) | 0.171 (0.145‐0.199) | 0.202 (0.172‐0.235) | 0.280 (0.217‐0.352) | 0.345 (0.264‐0.436) |
| 55 | 0.226 (0.201‐0.251) | 0.208 (0.176‐0.241) | 0.244 (0.209‐0.284) | 0.334 (0.262‐0.413) | 0.404 (0.315‐0.500) |
| 60 | 0.272 (0.243‐0.302) | 0.252 (0.213‐0.292) | 0.293 (0.253‐0.337) | 0.392 (0.312‐0.477) | 0.466 (0.372‐0.564) |
| 65 | 0.324 (0.289‐0.360) | 0.301 (0.256‐0.349) | 0.346 (0.300‐0.393) | 0.453 (0.367‐0.543) | 0.528 (0.431‐0.626) |
| 70 | 0.381 (0.340‐0.423) | 0.355 (0.302‐0.410) | 0.404 (0.352‐0.455) | 0.516 (0.425‐0.608) | 0.590 (0.492‐0.685) |
| 75 | 0.442 (0.394‐0.488) | 0.413 (0.353‐0.475) | 0.464 (0.406‐0.519) | 0.579 (0.484‐0.670) | 0.649 (0.553‐0.739) |
| 80 | 0.504 (0.450‐0.555) | 0.474 (0.409‐0.540) | 0.525 (0.463‐0.582) | 0.638 (0.544‐0.726) | 0.704 (0.612‐0.787) |
| 85 | 0.566 (0.507‐0.621) | 0.535 (0.465‐0.604) | 0.586 (0.519‐0.644) | 0.694 (0.602‐0.776) | 0.754 (0.668‐0.829) |
| 90 | 0.625 (0.564‐0.682) | 0.595 (0.524‐0.665) | 0.644 (0.576‐0.702) | 0.745 (0.657‐0.819) | 0.797 (0.720‐0.864) |
| 95 | 0.682 (0.619‐0.738) | 0.653 (0.579‐0.722) | 0.698 (0.631‐0.752) | 0.790 (0.708‐0.855) | 0.835 (0.765‐0.893) |
| 100 | 0.733 (0.671‐0.787) | 0.706 (0.632‐0.772) | 0.747 (0.682‐0.798) | 0.828 (0.754‐0.886) | 0.867 (0.805‐0.916) |
| 105 | 0.778 (0.719‐0.830) | 0.754 (0.682‐0.816) | 0.790 (0.729‐0.838) | 0.861 (0.795‐0.911) | 0.893 (0.840‐0.934) |
| 110 | 0.818 (0.763‐0.864) | 0.796 (0.730‐0.853) | 0.828 (0.769‐0.871) | 0.888 (0.830‐0.931) | 0.915 (0.869‐0.949) |
| 115 | 0.852 (0.801‐0.893) | 0.833 (0.773‐0.883) | 0.860 (0.807‐0.899) | 0.911 (0.861‐0.946) | 0.932 (0.894‐0.961) |
| 120 | 0.881 (0.835‐0.917) | 0.864 (0.809‐0.909) | 0.887 (0.839‐0.921) | 0.929 (0.887‐0.959) | 0.947 (0.915‐0.970) |
| 125 | 0.904 (0.864‐0.935) | 0.890 (0.840‐0.929) | 0.909 (0.867‐0.938) | 0.944 (0.908‐0.968) | 0.958 (0.931‐0.977) |
| 130 | 0.924 (0.888‐0.950) | 0.912 (0.868‐0.945) | 0.927 (0.890‐0.952) | 0.956 (0.926‐0.976) | 0.967 (0.945‐0.982) |
| 135 | 0.939 (0.909‐0.962) | 0.929 (0.892‐0.957) | 0.942 (0.910‐0.963) | 0.965 (0.940‐0.981) | 0.974 (0.956‐0.986) |
PTSD – post‐traumatic stress disorder, CAPS0 – baseline score on Clinician‐Administered PTSD Scale for DSM‐IV. For the full array of risk indicator combinations, see https://wvdmei.shinyapps.io/PTSD_Risk_Lookup/.
Using data from participants whose last follow‐up assessment fell between 9 and 15 months from the traumatic event (N=1,359) to fit a CAPS0‐only logistic regression yielded similar prediction probabilities (see dotted line in Figure 2), with similar model accuracy (Efron's R2=0.195, Brier score=0.071, AUC=0.822).
DISCUSSION
The results of this study demonstrate that the probability of meeting PTSD diagnostic criteria 4 to 15 months after acute care admission is reliably modeled by a logistic function of initial PTSD symptom severity. Added to this model, female gender, having less than secondary education, and prior interpersonal trauma were associated with higher likelihood of endpoint PTSD. Other previously documented risk factors, such as age, marital status, and current trauma type, did not improve the prediction over the model that had CAPS0 score as the only predictor. Importantly, the limited margin of error of the resulting risk estimate enables its clinical use to assess PTSD likelihood for each combination of the significant risk indicators.
The limited incremental effect of several known risk factors was an unexpected finding, suggesting that the contribution of these factors to PTSD likelihood is mediated by their effect on early symptom severity. In line with this view, a previous comparison of PTSD following terror attacks with PTSD following motor vehicle accidents from the same ED has shown that the higher prevalence of 4‐month PTSD following terror attacks (38% vs. 19%) was entirely accounted for by survivors’ early responses, that included one‐week PTSD symptoms, ED heart rate and peri‐traumatic dissociation61.
Our results extend previous findings of an association between high initial PTSD symptoms and being diagnosed with PTSD55, 56, 57, 58, 59, 60, 61, 62 by highlighting the added informational value of likelihood estimates relative to predictive classification. The uniform distribution of PTSD participants initial CAPS0 scores illustrates a barrier to classification models: trauma survivors who ultimately developed PTSD had their initial symptom severity distributed across the entire range of CAPS0 total scores, thereby defying the use of a threshold separating future cases from non‐cases. Predicting who will develop PTSD, as much as predicting who among heavy smokers will develop lung cancer, is a difficult task, frequently replaced by likelihood estimates. Classification models have significantly informed our understanding of disorders’ etiology and pathogenesis81, 82, 83, 84, 85, 86. Likelihood estimates, however, may be better suited for quantifying individual risk. As in other areas of medicine48, 49, 50, 51, 52, 53, 54, quantifying risk ultimately informs clinical action.
How can our results inform clinical action? Consider, for example, three female survivors with a CAPS0 score of, respectively, 20, 40, 60; less than secondary education, and lifetime exposure to interpersonal violence. These individuals will have, respectively, 10.4% (95% CI: 7.0‐14.7), 24.1% (95% CI: 17.7‐31.7) and 46.6% (95% CI: 37.2‐56.4) likelihood of chronic PTSD. Male survivors with the same initial scores and no additional risk factors will have, respectively, 2.7% (95% CI: 1.8‐4.0), 7.1% (95% CI: 4.8‐10.1) and 17.3% (95% CI: 12.2‐23.4) likelihood of chronic PTSD. Individuals endorsing the highest CAPS0 score, in both genders, might be seen as requiring clinical attention, e.g., an early intervention. The lower scores may justify a “watchful wait” with additional assessments.
A strength of this study follows from the use of data on a large number of participants from culturally and geographically diverse settings. Each included investigation utilized a longitudinal design, assessed PTSD symptoms shortly after index trauma, and based its appraisal of symptoms and diagnostic status on the repeatedly validated CAPS instrument.
In interpreting our findings, one should nonetheless consider some limitations. First, the time frame to determine PTSD status in our main analyses was 4‐15 months, thus very wide. However, when the data were restricted to participants re‐interviewed more than 9 months after the trauma, the resulting logistic prediction model remained essentially unchanged. Our prediction is nonetheless calibrated for the wider and earlier time bracket and centered on 333.0±103.1 days (less than a year) from trauma exposure.
Second, several risk predictors were harmonized due to the variety of instruments used by site investigators, which resulted in a loss of granularity. While those harmonized variables (less than secondary education, lifetime interpersonal trauma) have contributed to PTSD probability estimates, results involving recoded variables may miss important predictors’ information. Simplified predictors, however, might be easier to obtain in clinical practice and are widely used in predictive models in other areas of medicine (e.g., “smoking yes/no” and “diabetes yes/no” in the Framingham 10 years cardiovascular disease risk score).
Third, the ICPP data display considerable heterogeneity among contributing studies, which, as discussed above, raised methodological concerns about the best approach to pooling the data. We found that the fixed effects model was more accurate than the data source dependent random effects model and thus justified pooling from different studies. We also believe that a fixed effects model is more applicable to new environments, because a global slope and intercept were estimated across studies. Our choice, however, is neither beyond critique nor without significance: large multi‐source data compilations are currently evaluated in genetic, genomic and imaging research87, all of which have to contend with data source heterogeneity resembling the ICPP effort. Our theoretical premise that ICPP studies were differentially sampling subsets of an underlying population of reference (i.e., acute care trauma admissions) should be corroborated by testing the resulting risk assessment tool in newly admitted acute care trauma survivors.
The use of the CAPS structured clinical interview may add some burden on service delivery, and that interview is not properly a screening instrument. Moreover, several PTSD (i.e., CAPS) symptoms (e.g., insomnia, avoidance, inability to recall important aspects of the traumatic event) may not be present during ED admission. The early CAPS, nonetheless, is a robust risk indicator. Future work should explore earlier and simpler screening alternatives, or establish stepwise “screening and prediction” models, starting upon ED admission and predicting the likelihood of expressing high levels of early PTSD symptoms.
Finally, our model was developed using acute care trauma admissions, and as such its implementation in other traumatic circumstances (e.g., prolonged adversities such as wars, captivity and relocation) may require adjustments. Notwithstanding the precise risk estimates for other traumatic circumstances, we believe that early symptom severity has been convincingly shown here to be a major predictor of PTSD risk, and that, as such, its evaluation among individual survivors provides a valid warning and a call for action.
These limitations do not take away from the robustness of our likelihood estimates and their ability to support a personal risk assessment in individual survivors. Similar risk estimate tools are used in other medical domains to support clinical decisions (e.g., for determining breast48 or lung49, 50 cancer likelihood given risk indicators). The risk estimates provided in this work can be similarly used to trigger action (either watchful follow‐up or early intervention) according to local resources and the desirability of prevention.
Quantifying individual risk is a step forward in planning services and interventions, better targeting high‐risk individuals, and ultimately decreasing the burden of PTSD following acute care admission.
APPENDIX
Members of the International Consortium to predict PTSD include: Yael Errera‐Ankri, Anna C. Barbano, Sarah Freedman, Jessie Frijling, Carel Goslings, Jan Luitse, Alexander McFarlane, Derrick Silove, Hanspeter Moergeli, Joanne Mouthaan, Daisuke Nishi, Meaghan O'Donnell, Marit Sijbrandij, Sharain Suliman and Mirjam van Zuiden.
ACKNOWLEDGEMENTS
A.Y. Shalev, M. Gevonden, A. Ratanatharathorn and E. Laska contributed to this work as joint first authors. The study was funded by a US National Institute of Mental Health grant (MH101227) to A. Shalev, R. Kessler and K. Koenen.
Contributor Information
International Consortium to Predict PTSD:
Yael Errera‐Ankri, Anna C. Barbano, Sarah Freedman, Jessie Frijling, Carel Goslings, Jan Luitse, Alexander McFarlane, Derrick Silove, Hanspeter Moergeli, Joanne Mouthaan, Daisuke Nishi, Meaghan O'Donnell, Marit Sijbrandij, Sharain Suliman, and Mirjam van Zuiden
REFERENCES
- 1. Stein DJ, Karam EG, Shahly V et al. Post‐traumatic stress disorder associated with life‐threatening motor vehicle collisions in the WHO World Mental Health Surveys. BMC Psychiatry 2016;16:257. [DOI] [PMC free article] [PubMed] [Google Scholar]
- 2. Hoge CW, Castro CA, Messer SC et al. Combat duty in Iraq and Afghanistan, mental health problems, and barriers to care. N Engl J Med 2004;351:13‐22. [DOI] [PubMed] [Google Scholar]
- 3. Kessler RC. Posttraumatic stress disorder: the burden to the individual and to society. J Clin Psychiatry 2000;61(Suppl. 5):4‐12. [PubMed] [Google Scholar]
- 4. Breslau N, Peterson E, Poisson L et al. Estimating post‐traumatic stress disorder in the community: lifetime perspective and the impact of typical traumatic events. Psychol Med 2004;34:889‐98. [DOI] [PubMed] [Google Scholar]
- 5. Committee on the Assessment of Ongoing Efforts in the Treatment of Posttraumatic Stress Disorder; Board on the Health of Select Populations; Institute of Medicine . Treatment for posttraumatic stress disorder in military and veteran populations: final assessment. Washington: Institute of Medicine National Research Council, 2014. [PubMed] [Google Scholar]
- 6. Roberts NP, Roberts PA, Jones N et al. Psychological therapies for post‐traumatic stress disorder and comorbid substance use disorder. Cochrane Database Syst Rev 2016;4:CD010204. [DOI] [PMC free article] [PubMed] [Google Scholar]
- 7. Sijbrandij M, Kleiboer A, Bisson JI et al. Pharmacological prevention of post‐traumatic stress disorder and acute stress disorder: a systematic review and meta‐analysis. Lancet Psychiatry 2015;2:413‐21. [DOI] [PubMed] [Google Scholar]
- 8. Roberts NP, Roberts PA, Jones N et al. Psychological interventions for post‐traumatic stress disorder and comorbid substance use disorder: a systematic review and meta‐analysis. Clin Psychol Rev 2015;38:25‐38. [DOI] [PubMed] [Google Scholar]
- 9. Hoskins M, Pearce J, Bethell A et al. Pharmacotherapy for post‐traumatic stress disorder: systematic review and meta‐analysis. Br J Psychiatry 2015;206:93‐100. [DOI] [PubMed] [Google Scholar]
- 10. Andrews B, Brewin CR, Philpott R et al. Delayed‐onset posttraumatic stress disorder: a systematic review of the evidence. Am J Psychiatry 2007;164:1319‐26. [DOI] [PubMed] [Google Scholar]
- 11. Bryant RA, Nickerson A, Creamer M et al. Trajectory of post‐traumatic stress following traumatic injury: 6‐year follow‐up. Br J Psychiatry 2015;206:417‐23. [DOI] [PubMed] [Google Scholar]
- 12. Galatzer‐Levy IR, Ankri Y, Freedman S et al. Early PTSD symptom trajectories: persistence, recovery, and response to treatment: results from the Jerusalem Trauma Outreach and Prevention Study (J‐TOPS). PLoS One 2013;8:e70084. [DOI] [PMC free article] [PubMed] [Google Scholar]
- 13. Kessler RC, Rose S, Koenen KC et al. How well can post‐traumatic stress disorder be predicted from pre‐trauma risk factors? An exploratory study in the WHO World Mental Health Surveys. World Psychiatry 2014;13:265‐74. [DOI] [PMC free article] [PubMed] [Google Scholar]
- 14. Smid GE, Mooren TT, van der Mast RC et al. Delayed posttraumatic stress disorder: systematic review, meta‐analysis, and meta‐regression analysis of prospective studies. J Clin Psychiatry 2009;70:1572‐82. [DOI] [PubMed] [Google Scholar]
- 15. Shalev AY, Ankri Y, Israeli‐Shalev Y et al. Prevention of posttraumatic stress disorder by early treatment: results from the Jerusalem Trauma Outreach and Prevention Study. Arch Gen Psychiatry 2012;69:166‐76. [DOI] [PubMed] [Google Scholar]
- 16. Roberts NP, Kitchiner NJ, Kenardy J et al. Multiple session early psychological interventions for the prevention of post‐traumatic stress disorder. Cochrane Database Syst Rev 2009;3:CD006869. [DOI] [PubMed] [Google Scholar]
- 17. Sijbrandij M, Olff M, Reitsma JB et al. Treatment of acute posttraumatic stress disorder with brief cognitive behavioral therapy: a randomized controlled trial. Am J Psychiatry 2007;164:82‐90. [DOI] [PubMed] [Google Scholar]
- 18. Bryant RA. Early predictors of posttraumatic stress disorder. Biol Psychiatry 2003;53:789‐95. [DOI] [PubMed] [Google Scholar]
- 19. Galatzer‐Levy IR, Ma S, Statnikov A et al. Utilization of machine learning for prediction of post‐traumatic stress: a re‐examination of cortisol in the prediction and pathways to non‐remitting PTSD. Transl Psychiatry 2017;7:e1070. [DOI] [PMC free article] [PubMed] [Google Scholar]
- 20. Bryant RA, O'Donnell ML, Creamer M et al. A multisite analysis of the fluctuating course of posttraumatic stress disorder. JAMA Psychiatry 2013;70:839‐46. [DOI] [PubMed] [Google Scholar]
- 21. Brewin CR, Andrews B, Valentine JD. Meta‐analysis of risk factors for posttraumatic stress disorder in trauma‐exposed adults. J Consult Clin Psychol 2000;68:748‐66. [DOI] [PubMed] [Google Scholar]
- 22. Ozer EJ, Best SR, Lipsey TL et al. Predictors of posttraumatic stress disorder and symptoms in adults: a meta‐analysis. Psychol Bull 2003;129:52‐73. [DOI] [PubMed] [Google Scholar]
- 23. Mollica RF, Sarajlić N, Chernoff M et al. Longitudinal study of psychiatric symptoms, disability, mortality, and emigration among Bosnian refugees. JAMA 2001;286:546‐54. [DOI] [PubMed] [Google Scholar]
- 24. Silver RC, Holman EA, McIntosh DN et al. Nationwide longitudinal study of psychological responses to September 11. JAMA 2002;288:1235‐44. [DOI] [PubMed] [Google Scholar]
- 25. Dougall AL, Ursano RJ, Posluszny DM et al. Predictors of posttraumatic stress among victims of motor vehicle accidents. Psychosom Med 2001;63:402‐11. [DOI] [PubMed] [Google Scholar]
- 26. Koenen KC, Stellman JM, Stellman SD et al. Risk factors for course of posttraumatic stress disorder among Vietnam veterans: a 14‐year follow‐up of American legionnaires. J Consult Clin Psychol 2003;71:980‐6. [DOI] [PubMed] [Google Scholar]
- 27. Ryb GE, Dischinger PC, Read KM et al. PTSD after severe vehicular crashes. Ann Adv Automot Med 2009;53:177‐93. [PMC free article] [PubMed] [Google Scholar]
- 28. Ehring T, Kleim B, Clark DM et al. Screening for posttraumatic stress disorder: what combination of symptoms predicts best? J Nerv Ment Dis 2007;195:1004‐12. [DOI] [PubMed] [Google Scholar]
- 29. Mouthaan J, Sijbrandij M, Reitsma JB et al. Comparing screening instruments to predict posttraumatic stress disorder. PLoS One 2014;9:e97183. [DOI] [PMC free article] [PubMed] [Google Scholar]
- 30. Walters JT, Bisson JI, Shepherd JP. Predicting post‐traumatic stress disorder: validation of the Trauma Screening Questionnaire in victims of assault. Psychol Med 2007;37:143‐50. [DOI] [PubMed] [Google Scholar]
- 31. O'Donnell ML, Creamer MC, Parslow R et al. A predictive screening index for posttraumatic stress disorder and depression following traumatic injury. J Consult Clin Psychol 2008;76:923‐32. [DOI] [PubMed] [Google Scholar]
- 32. Smits N, Smit F, Cuijpers P et al. Using decision theory to derive optimal cut‐off scores of screening instruments: an illustration explicating costs and benefits of mental health screening. Int J Methods Psychiatr Res 2007;16:219‐29. [DOI] [PMC free article] [PubMed] [Google Scholar]
- 33. Brewin CR. Risk factor effect sizes in PTSD: what this means for intervention. J Trauma Dissociation 2005;6:123‐30. [DOI] [PubMed] [Google Scholar]
- 34. Heron‐Delaney M, Kenardy J, Charlton E et al. A systematic review of predictors of posttraumatic stress disorder (PTSD) for adult road traffic crash survivors. Injury 2013;44:1413‐22. [DOI] [PubMed] [Google Scholar]
- 35. Kilpatrick DG, Resnick HS, Milanak ME et al. National estimates of exposure to traumatic events and PTSD prevalence using DSM‐IV and DSM‐5 criteria. J Trauma Stress 2013;26:537‐47. [DOI] [PMC free article] [PubMed] [Google Scholar]
- 36. Bonnie RJ, Fulco CE, Liverman CT. (eds). Reducing the burden of injury: advancing prevention and treatment. Washington: National Academy Press, 1999. [PubMed] [Google Scholar]
- 37. LF MC. National hospital ambulatory medical care survey emergency department summary. Advance Data from Vital and Health Statistics, Vol. 245 Hyattsville: National Center for Health Statistics, 1992:1994. [Google Scholar]
- 38. Rice DP, MacKenzie EJ, Jones AS et al. Cost of injury in the United States: a report to Congress. San Francisco: Institute for Health and Aging, University of California; Baltimore: Injury Prevention Center, Johns Hopkins University, 1989. [Google Scholar]
- 39. Bergen GS, National Center for Health Statistics (U.S.) . Injury in the United States: 2007 chartbook. Hyattsville: U.S. Department of Health and Human Services, Centers for Disease Control and Prevention, National Center for Health Statistics, 2008. [Google Scholar]
- 40. Ameratunga S, Hijar M, Norton R. Road‐traffic injuries: confronting disparities to address a global‐health problem. Lancet 2006;367:1533‐40. [DOI] [PubMed] [Google Scholar]
- 41. Lipsky S, Field CA, Caetano R et al. Posttraumatic stress disorder symptomatology and comorbid depressive symptoms among abused women referred from emergency department care. Violence Vict 2005;20:645‐59. [PubMed] [Google Scholar]
- 42. Golding JM. Intimate partner violence as a risk factor for mental disorders: a meta‐analysis. J Fam Violence 1999;14:99‐132. [Google Scholar]
- 43. Ameratunga S, Tin ST, Coverdale J et al. Posttraumatic stress among hospitalized and nonhospitalized survivors of serious car crashes: a population‐based study. Psychiatr Serv 2009;60:402‐4. [DOI] [PubMed] [Google Scholar]
- 44. Debray T, Moons KG, Ahmed I et al. A framework for developing, implementing, and evaluating clinical prediction models in an individual participant data meta‐analysis. Stat Med 2013;32:3158‐80. [DOI] [PubMed] [Google Scholar]
- 45. Chalmers I. The Cochrane collaboration: preparing, maintaining, and disseminating systematic reviews of the effects of health care. Ann N Y Acad Sci 1993;703:156‐65. [DOI] [PubMed] [Google Scholar]
- 46. Brincks A, Montag S, Howe GW et al. Addressing methodologic challenges and minimizing threats to validity in synthesizing findings from individual‐level data across longitudinal randomized trials. Prev Sci 2018;19(Suppl. 1):60‐73. [DOI] [PMC free article] [PubMed] [Google Scholar]
- 47. Bainter SA, Curran PJ. Advantages of integrative data analysis for developmental research. J Cogn Dev 2015;16:1‐10. [DOI] [PMC free article] [PubMed] [Google Scholar]
- 48. Gail MH, Brinton LA, Byar DP et al. Projecting individualized probabilities of developing breast cancer for white females who are being examined annually. J Natl Cancer Inst 1989;81:1879‐86. [DOI] [PubMed] [Google Scholar]
- 49. Cassidy A, Duffy SW, Myles JP et al. Lung cancer risk prediction: a tool for early detection. Int J Cancer 2007;120:1‐6. [DOI] [PubMed] [Google Scholar]
- 50. Cassidy A, Myles JP, van Tongeren M et al. The LLP risk model: an individual risk prediction model for lung cancer. Br J Cancer 2008;98:270‐6. [DOI] [PMC free article] [PubMed] [Google Scholar]
- 51. Chan DXH, Sim YE, Chan YH et al. Development of the Combined Assessment of Risk Encountered in Surgery (CARES) surgical risk calculator for prediction of postsurgical mortality and need for intensive care unit admission risk: a single‐center retrospective study. BMJ Open 2018;8:e019427. [DOI] [PMC free article] [PubMed] [Google Scholar]
- 52. Cook NR, Ridker PM. Further insight into the cardiovascular risk calculator: the roles of statins, revascularizations, and underascertainment in the Women's Health Study. JAMA Intern Med 2014;174:1964‐71. [DOI] [PMC free article] [PubMed] [Google Scholar]
- 53. Fox ER, Samdarshi TE, Musani SK et al. Development and validation of risk prediction models for cardiovascular events in black adults: the Jackson Heart Study Cohort. JAMA Cardiol 2016;1:15‐25. [DOI] [PMC free article] [PubMed] [Google Scholar]
- 54. Hippisley‐Cox J, Coupland C, Robson J et al. Derivation, validation, and evaluation of a new QRISK model to estimate lifetime risk of cardiovascular disease: cohort study using QResearch database. BMJ 2010;341:c6624. [DOI] [PMC free article] [PubMed] [Google Scholar]
- 55. Blanchard EB, Hickling EJ, Forneris CA et al. Prediction of remission of acute posttraumatic stress disorder in motor vehicle accident victims. J Trauma Stress 1997;10:215‐34. [DOI] [PubMed] [Google Scholar]
- 56. Frommberger UH, Stieglitz RD, Nyberg E et al. Prediction of posttraumatic stress disorder by immediate reactions to trauma: a prospective study in road traffic accident victims. Eur Arch Psychiatry Clin Neurosci 1998;248:316‐21. [DOI] [PubMed] [Google Scholar]
- 57. Jehel L, Paterniti S, Brunet A et al. Prediction of the occurrence and intensity of post‐traumatic stress disorder in victims 32 months after bomb attack. Eur Psychiatry 2003;18:172‐6. [DOI] [PubMed] [Google Scholar]
- 58. Karstoft KI, Galatzer‐Levy IR, Statnikov A et al. Bridging a translational gap: using machine learning to improve the prediction of PTSD. BMC Psychiatry 2015;15:30. [DOI] [PMC free article] [PubMed] [Google Scholar]
- 59. Matsuoka Y, Nishi D, Nakajima S et al. Incidence and prediction of psychiatric morbidity after a motor vehicle accident in Japan: the Tachikawa Cohort of Motor Vehicle Accident Study. Crit Care Med 2008;36:74‐80. [DOI] [PubMed] [Google Scholar]
- 60. Mayou R, Bryant B, Ehlers A. Prediction of psychological outcomes one year after a motor vehicle accident. Am J Psychiatry 2001;158:1231‐8. [DOI] [PubMed] [Google Scholar]
- 61. Shalev AY, Freedman S. PTSD following terrorist attacks: a prospective evaluation. Am J Psychiatry 2005;162:1188‐91. [DOI] [PubMed] [Google Scholar]
- 62. Shalev AY, Freedman S, Peri T et al. Predicting PTSD in trauma survivors: prospective evaluation of self‐report and clinician‐administered instruments. Br J Psychiatry 1997;170:558‐64. [DOI] [PubMed] [Google Scholar]
- 63. Qi W, Ratanatharathorn A, Gevonden M et al. Application of data pooling to longitudinal studies of early post‐traumatic stress disorder (PTSD): the International Consortium to Predict PTSD (ICPP) project. Eur J Psychotraumatol 2018;9:1476442. [DOI] [PMC free article] [PubMed] [Google Scholar]
- 64. Hepp U, Moergeli H, Buchi S et al. Post‐traumatic stress disorder in serious accidental injury: 3‐year follow‐up study. Br J Psychiatry 2008;192:376‐83. [DOI] [PubMed] [Google Scholar]
- 65. Shalev AY, Peri T, Brandes D et al. Auditory startle response in trauma survivors with posttraumatic stress disorder: a prospective study. Am J Psychiatry 2000;157:255‐61. [DOI] [PubMed] [Google Scholar]
- 66. Frijling JL, van Zuiden M, Koch SBJ et al. Efficacy of oxytocin administration early after psychotrauma in preventing the development of PTSD: study protocol of a randomized controlled trial. BMC Psychiatry 2014;14:92. [DOI] [PMC free article] [PubMed] [Google Scholar]
- 67. Jenewein J, Wittmann L, Moergeli H et al. Mutual influence of posttraumatic stress disorder symptoms and chronic pain among injured accident survivors: a longitudinal study. J Trauma Stress 2009;22:540‐8. [DOI] [PubMed] [Google Scholar]
- 68. Irish L, Ostrowski SA, Fallon W et al. Trauma history characteristics and subsequent PTSD symptoms in motor vehicle accident victims. J Trauma Stress 2008;21:377‐84. [DOI] [PubMed] [Google Scholar]
- 69. Bryant RA, Creamer M, O'Donnell ML et al. A multisite study of the capacity of acute stress disorder diagnosis to predict posttraumatic stress disorder. J Clin Psychiatry 2008;69:923‐9. [DOI] [PubMed] [Google Scholar]
- 70. Shalev AY, Videlock EJ, Peleg T et al. Stress hormones and post‐traumatic stress disorder in civilian trauma victims: a longitudinal study. Part I: HPA axis responses. Int J Neuropsychopharmacol 2008;11:365‐72. [DOI] [PubMed] [Google Scholar]
- 71. Matsuoka Y, Nishi D, Nakajima S et al. The Tachikawa cohort of motor vehicle accident study investigating psychological distress: design, methods and cohort profiles. Soc Psychiatry Psychiatr Epidemiol 2009;44:333‐40. [DOI] [PubMed] [Google Scholar]
- 72. Mouthaan J, Sijbrandij M, Luitse JS et al. The role of acute cortisol and DHEAS in predicting acute and chronic PTSD symptoms. Psychoneuroendocrinology 2014;45:179‐86. [DOI] [PubMed] [Google Scholar]
- 73. Blake DD, Weathers FW, Nagy LM et al. The development of a Clinician‐Administered PTSD Scale. J Trauma Stress 1995;8:75‐90. [DOI] [PubMed] [Google Scholar]
- 74. Weathers FW, Keane TM, Davidson JR. Clinician‐Administered PTSD Scale: a review of the first ten years of research. Depress Anxiety 2001;13:132‐56. [DOI] [PubMed] [Google Scholar]
- 75. Weathers FW, Ruscio AM, Keane TM. Psychometric properties of nine scoring rules for the Clinician‐Administered Posttraumatic Stress Disorder Scale. Psychol Assess 1999;11:124‐33. [Google Scholar]
- 76. Benjet C, Bromet E, Karam E et al. The epidemiology of traumatic event exposure worldwide: results from the World Mental Health Survey Consortium. Psychol Med 2016;46:327‐43. [DOI] [PMC free article] [PubMed] [Google Scholar]
- 77. Buuren S, Groothuis‐Oudshoorn K. MICE: multivariate imputation by chained equations in R. J Stat Softw 2011;45(3). [Google Scholar]
- 78. Rubin DB. Multiple imputation for nonresponse in surveys, Vol. 81 Chichester: Wiley, 2004. [Google Scholar]
- 79. Brier GW. Verification of forecasts expressed in terms of probability. Mon Weather Rev 1950;78:1‐3. [Google Scholar]
- 80. Gelman A, Su Y‐S, Yajima M, et al Arm: data analysis using regression and multilevel/hierarchical models (R package, version 9.01). http://CRAN.R‐project.org/package=arm.
- 81. Wolf EJ, Maniates H, Nugent N et al. Traumatic stress and accelerated DNA methylation age: a meta‐analysis. Psychoneuroendocrinology 2018;92:123‐34. [DOI] [PMC free article] [PubMed] [Google Scholar]
- 82. Sumner JA, Chen Q, Roberts AL et al. Posttraumatic stress disorder onset and inflammatory and endothelial function biomarkers in women. Brain Behav Immun 2018;69:203‐9. [DOI] [PMC free article] [PubMed] [Google Scholar]
- 83. Duncan LE, Ratanatharathorn A, Aiello AE et al. Largest GWAS of PTSD (N=20 070) yields genetic overlap with schizophrenia and sex differences in heritability. Mol Psychiatry 2018;23:666‐73. [DOI] [PMC free article] [PubMed] [Google Scholar]
- 84. Shalev A, Liberzon I, Marmar C. Post‐traumatic stress disorder. N Engl J Med 2017;376:2459‐69. [DOI] [PubMed] [Google Scholar]
- 85. Liberzon I. Searching for intermediate phenotypes in posttraumatic stress disorder. Biol Psychiatry 2018;83:797‐9. [DOI] [PubMed] [Google Scholar]
- 86. Fonzo GA, Goodkind MS, Oathes DJ et al. PTSD psychotherapy outcome predicted by brain activation during emotional reactivity and regulation. Am J Psychiatry 2017;174:1163‐74. [DOI] [PMC free article] [PubMed] [Google Scholar]
- 87. Logue MW, Amstadter AB, Baker DG et al. The Psychiatric Genomics Consortium Posttraumatic Stress Disorder Workgroup: posttraumatic stress disorder enters the age of large‐scale genomic collaboration. Neuropsychopharmacology 2015;40:2287. [DOI] [PMC free article] [PubMed] [Google Scholar]