Abstract
Background:
Adequate testing of delivery accuracy of insulin pumps is under discussion. Especially for patch pumps, test settings are challenging. In addition, evaluation and presentation of accuracy results in a way that is reasonable and useful for clinicians, not only for technicians, is important.
Methods:
Test setups based on IEC 60601-2-24 were used and, in addition, different setups for patch pumps were compared to identify an adequate alternative for pumps without external infusion set. These setups are applicable for both bolus and basal rate accuracy testing. In addition, evaluation procedures considering clinical relevance were compiled.
Results:
A setup for patch pumps that provides reliable results could be realized. Evaluation of basal rate accuracy data should also consider the actual clinical use of insulin pumps and thus, deviating from IEC 60601-2-24, compose the whole measurement period without excluding the first 24 hours. In addition to the presentation using trumpet curves, accuracy of 1-hour windows should be evaluated and displayed.
Conclusions:
This article proposes an approach on how to test, evaluate, and present bolus and basal rate accuracy of insulin pumps from a clinical perspective.
Keywords: CSII, insulin pump, accuracy, basal rate, bolus
Continuous subcutaneous insulin infusion (CSII) is a common therapy for people with type 1 diabetes and is recommended, for example by the American Diabetes Association and the International Society for Pediatric and Adolescent Diabetes.1,2 CSII has two basic purposes: continuous infusion of the so-called basal rate and on-demand delivery of boluses to cover meals and to correct high glucose values. These functions are mediated by an insulin pump; currently, two different types of insulin pumps are available for CSII. Conventional durable insulin pumps contain the insulin pump itself including the insulin reservoir and an insulin infusion set (IIS) including a tube and the injection cannula. In contrast, patch pumps are directly fixed to the skin, have no external tubing, and are typically controlled via a separate remote control. Of note is that basal rate infusion in most insulin pumps is not completely continuous, but instead realized by frequent single pulses, and is thus regarded as quasi-continuous.3
Requirements for infusion pumps are described in the standard IEC 60601-2-24.4 This standard describes experimental setups and procedures for testing different types of infusion pumps, also for insulin pumps but not exclusively. Therefore, the requirements described are of a more technical kind and do not consider clinical needs or impact. In addition, the standard does not provide any performance criteria that have to be fulfilled. Insulin pump manufacturers, however, discuss accuracy levels of ±5%.
The test setting described in IEC 60601-2-24 to assess basal rate as well as bolus accuracy can be transferred to durable insulin pumps, but it is not feasible for patch pumps. The measurements are based on a microgravimetric method, that is, the pump is placed outside the measurement chamber of a balance and infuses the test liquid into a vessel inside the measurement chamber via an administration set. An IIS is a suitable administration set; however, since patch pumps do not have a respective tube, an alternative administration set or setting is required.
After finding a suitable test setting, an adequate description, statistical evaluation, and presentation of the results are required. As already mentioned before, IEC 60601-2-24 does not provide any accuracy criteria; it is therefore difficult to draw a conclusion about whether a given insulin pump is sufficiently accurate. Especially for clinicians that are not familiar with the technical details, it might be really challenging to interpret the respective information given in the manual. IEC 60601-2-24 proposes the calculation of the total flow error, including only measurements after a stabilization period of 24 hours, and the presentation of a trumpet curve. Both are not intuitively understandable, nor do they provide information that is actually clinically relevant for insulin pump users.
Different test settings have been propagated by several investigators trying to characterize and compare insulin pumps.5-8 However, until now, there is no generally accepted experimental methodology.
Zisser and colleagues investigated bolus accuracy of a patch pump with two different approaches, both based on an optical instead of a microgravimetric evaluation.5 Using colored insulin, boluses were either delivered into a pipette that was used as linear measurement tool, or the size of the spherical bolus bubble at the tip of the cannula was measured with a digital microscope. For the pipette method, mean accuracy was evaluated for a series of 10-20 doses with small boluses, whereas with the spherical bolus method, the size of each individual bolus was determined.
Jahn and colleagues used a method based on IEC 60601-2-24 to measure basal rate accuracy.6 In a microgravimetric system they measured weight of a vial filled with water and covered with oil into which the basal rate was delivered. The durable pumps were placed outside of the measurement chamber of the balance and the tested patch pump was placed inside the chamber. Accuracy was evaluated for each single basal rate pulse and for time-averaged doses and the percentages of pulses exceeding different accuracy thresholds were calculated. The methodology of this working group was criticized because according to Zisser this method was not designed for measuring dose-to-dose accuracy of basal rate delivery, and in addition, placing the patch pump within the measuring chamber would have an influence on the measurement results.9
Consequently, Borot and colleagues used a similar setting, also based on IEC 60601-2-24 principles, but they placed the patch pumps outside, on top of the balance, and connected them to a capillary tube.7 Accuracy of two different basal rates was evaluated by calculating the error of flow rate, percentage of doses outside certain thresholds, and over different observation windows.
Two patch pumps were compared by Bowen and Allender, who also used a microgravimetric system based on that presented by Jahn et al, but with the pumps installed outside of the weighing chamber.8 They evaluated single pulse accuracy, averaged pulse accuracy, as well as the percentage of doses outside of different accuracy thresholds.
Graphical presentations of basal rate accuracy shown so far include trumpet curve,7,8 single-dose accuracy graphs,6,8 bar charts of doses or observation windows inside or outside different thresholds6,8 or total errors,7 and radar plots in which extent and direction of deviation of each measured dose are displayed.10
In the investigation presented here, methods were established based on IEC 60601-2-24:199811 to evaluate delivery accuracy of basal rate and boluses, but focusing on a clinically relevant evaluation and presentation of results.
Methods
Insulin pumps were set up as described in the respective manufacturers’ instructions for use. Experiments were performed under laboratory conditions with controlled temperature (23±4°C) and humidity (50±25%). Although IEC 60601-2-24 does not request several repetitions or testing of different batches, in this study, 3 insulin delivery sets (insulin pump + infusion set) were tested 3 times for each evaluated pump to achieve 9 data sets per pump.
For both basal rate and bolus accuracy, the same test setting was used, but had to be modified for the testing of patch pumps.
Test Setting for Durable Pumps
The test setting for durable pumps is shown in Figure 1. A balance was placed on a desk not prone to vibration inside a closed room. A beaker filled with degassed water was placed inside the measurement chamber of the balance. The pump was placed outside the balance with the IIS connected into the balance. The IIS was fixed above the beaker and the cannula was extended by a glass capillary, fixed with UV-activated resin, entering the water in the beaker. After introduction of the capillary, the water was covered with mineral oil (≥5mm) to avoid evaporation. The position of the pump was adjusted so that the cartridge and the tip of the capillary were on same height to avoid effects of hydrostatic pressure.12
Figure 1.
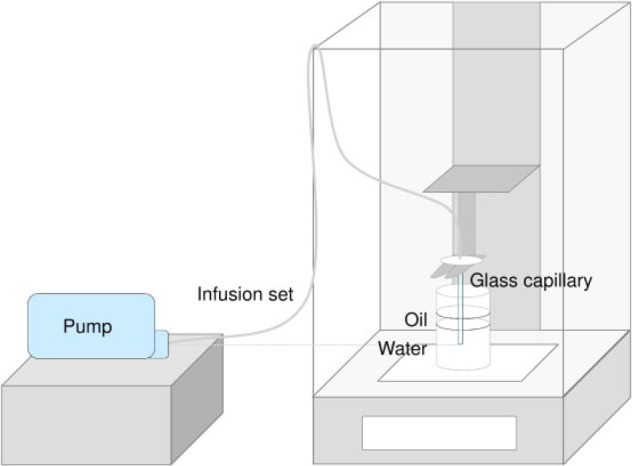
Experimental setup following IEC 60601-2-24.
Stability of the measurement setup was evaluated by measuring evaporation rate without bolus or basal rate delivery for 24 hours every 15 minutes.
Test Setting for Patch Pumps
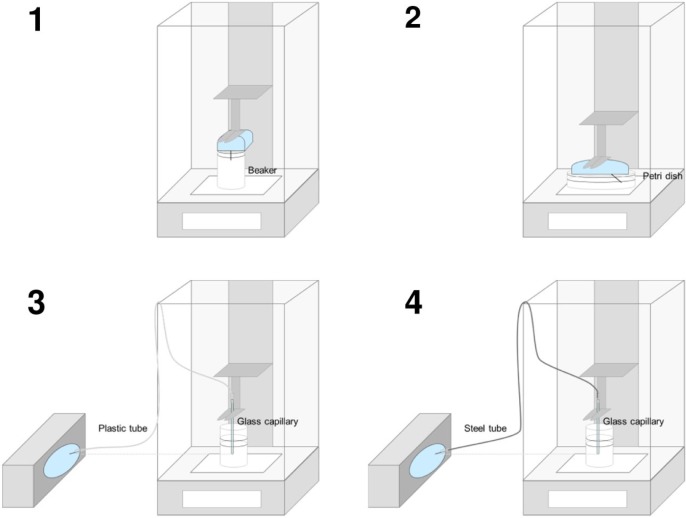
To establish an adequate test setting for basal rate accuracy of patch pumps, different settings (see Figure 2) were tested in multiple repetitions and compared. Concerns about evaporation, stability of the balance and possible effects of the patch pump’s delivery mechanism on the balance were taken into account. Therefore, control measurements including a turned off pump, a fluid vessel without a pump, and a stable weight were tested in parallel on separate balances.
Figure 2.
Different test settings for patch pumps.
For the first setting, a patch pump was installed inside the measurement chamber of the balance, using a small beaker like for durable pumps, but without a glass capillary for extension (Figure 2/1).
The second setting was a variant of the first one, using a petri dish with a larger surface instead of a beaker to be able to position the pump right above the surface (Figure 2/2). In this setting, no further modification of the rather short cannula was required, and it was immersed directly into the fluid.
To establish a setting that is more comparable to the one for durable pumps and the description in IEC 60601-2-24, two settings with the insulin pump being placed outside the balance were set up. As administration set, a plastic tube (Figure 2/3) or a steel tube (Figure 2/4) was used. Tubes were connected on the one side to the cannula of the patch pump and on the other side to a glass capillary entering the water in a beaker placed inside the measurement chamber. A beaker was used to limit possible effects of evaporation that might disturb the measurements when using a vessel with a larger surface. Connections between the cannula and the tubes were fastened through silicon pieces glued with UV-activated resin. All connections were checked for leakage using indicator paper. The patch pumps outside the balance were placed with the cannula at the same height as the tip of the glass capillary.
Several measurements were performed with all described settings to check for robustness and plausibility of the methods independently from actual accuracy results. The first setting was difficult to set up, taking care that the cannula reaches the water while the oil layer is thick enough to avoid evaporation. Subsequently in several measurements, the oil layer got in contact with the patch pump making an evaluation impossible. This setting is therefore not suitable if larger basal rates (≥1 U/h) are tested. Similar conclusions were drawn for the second setting which worked well with a very low basal rate (0.05 U/h), but with increasing basal rates the beaker tended to overflow. The two settings with the pump placed inside the balance are thus feasible only for low basal rates and not for intermediate basal rates as required by IEC 60601-2-24. The third setting using a plastic tube showed implausible results, that is, decreasing weight, pointing toward deficiencies in the setup that led to leakage or backflow of water into the administration set. Using a steel tube in the fourth setting did not lead to such a problem and showed plausible and reproducible results. This setting was therefore selected as the most robust and suitable of the tested ones to determine accuracy of different basal rates in patch pumps.
For testing bolus accuracy, two methods were compared: the first and fourth methods (see Figure 2). Both methods were feasible; however, the first method showed a larger variability between the individual measurements, therefore the fourth method was also determined as most suitable for bolus accuracy testing in patch pumps.
Procedures for Basal Rate Accuracy
Basal rate accuracy was evaluated following IEC 60601-2-24:1998 section 50.104, as insulin pumps are regarded as profile pumps, which requires testing of an intermediate and the lowest possible basal rate. As an intermediate basal rate of 1.0 U/h, which is often used by adult patients, was suitable; however, the lowest possible basal rate turned out to be challenging as the expected weight increases were below the resolution of the balance. For the present investigation, calibration protocols of the used balances revealed a minimum sample weight of approximately 0.2-0.3 mg (corresponds to 0.02-0.03 U) for a measurement with 5% tolerance and a safety factor of 1. For that reason, the lowest assessable basal rate in this investigation with the used balances was determined to be 0.1 U/h or more.
Prior to the measurements, insulin cartridges were preconditioned for 24 hours at room temperature to avoid formation of air bubbles or artifacts due to temperature changes during the measurements.13 Insulin pumps were prepared, and IIS were primed according to the manufacturer’s instructions. The desired basal rate was set; insulin pump and IIS were installed as described above. After placing the capillary in the water, the IIS was primed again, the oil layer was applied and the pump was positioned at the same height as the tip of the glass capillary. The desired basal rate was started, and automatic recording of weight every 5 minutes was initiated. The testing period lasted 72 hours.
Procedures for Bolus Accuracy
Bolus accuracy was evaluated following IEC 60601-2-24:1998 section 50.106, which requires testing of the minimal and the maximal bolus size. For this investigation three bolus volumes were used to cover relevant doses used by adults and children: 10 U, 1 U, and 0.1 U.14,15
Prior to the measurements, insulin cartridges were preconditioned for 24 hours at room temperature to avoid formation of air bubbles during the measurements. Insulin pumps were prepared, and IIS were primed according to the manufacturers’ instructions. Pump and IIS were installed as described above. For 1 h ± 5 min a basal rate of 1 U/h was run and then the basal rate was set to 0 U/h. The desired bolus volume was set, and 25 successive boluses were delivered; 5 (0.1 U and 1.0 U) or 10 (10 U) minutes, respectively, after each individual bolus the weight was documented to ensure the whole volume was delivered. The balance was adjusted to zero before the next bolus was delivered.
Due to the limited reservoir size of some of the tested insulin pumps that would have required refilling, bolus accuracy for 10 U was calculated for only 12 successive boluses.
Beyond IEC 60601-2-24, delivery speed of a 10 U bolus was determined by measuring the time from bolus order until the end of delivery by the insulin pump.
Results
Doses of the delivered boluses and basal rate flow with U-100 insulin (100 U per ml) were calculated from weight differences recorded by the balance, using a density of 1.005 g/ml for the used insulin,16 with the following formula:
Basal Rate Accuracy
Calculation
Using formula (1) corresponding insulin doses were calculated from increases in weight. The degree of evaporation as determined in a prior experiment was found to be negligible and was thus not considered in further evaluations. For each pump model, up to 7776 values were obtained from measurements every 5 minutes over 72 hours in 9 data sets. However, to compensate for artifacts, and to achieve the minimum sample weight, only values every 15 minutes, that is, up to 2592 values per pump, were used for further calculations. Contrasting descriptions in IEC 60601-2-24, the whole study period was regarded without discriminating between a stabilization and an analysis period (comparable to other studies).6-8
To determine the total deviation from the intended basal rate, the formula provided by IEC 60601-2-24 for the total flow error during the analysis period was used but applied for the whole measurement period:
The expected weight increase was calculated based on the set basal rate and the duration of the measurement period.
Graphical Presentation
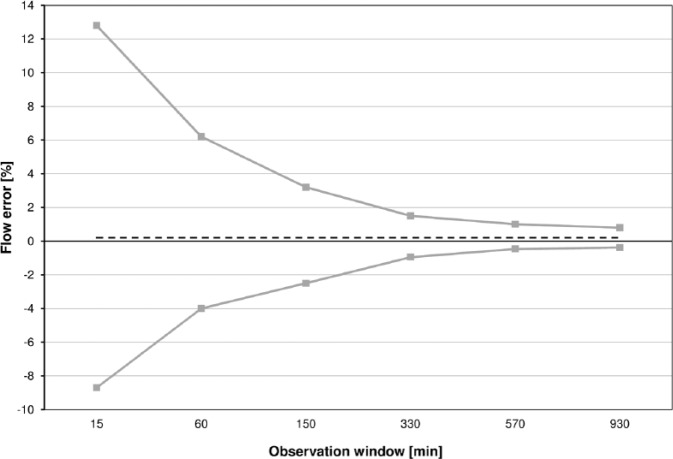
According to IEC 60601-2-24 basal rate data shall be presented in trumpet curves. Trumpet curves show the minimal (Ep(min)) and maximal (Ep(max)) relative deviation within different observation windows (15, 60, 150, 330, 570, and 930 minutes) after a 24-hour stabilization period (Figure 3).
Figure 3.
Example for a trumpet curve according to IEC 60601-2-24. The first 24 hours are excluded. The x-axis shows the increasing times over which values are averaged (observation windows), but not the running time. Minimum and maximum flow errors for each observation window are shown. The dashed line represents the total flow error for the analysis period (independent from observation windows).
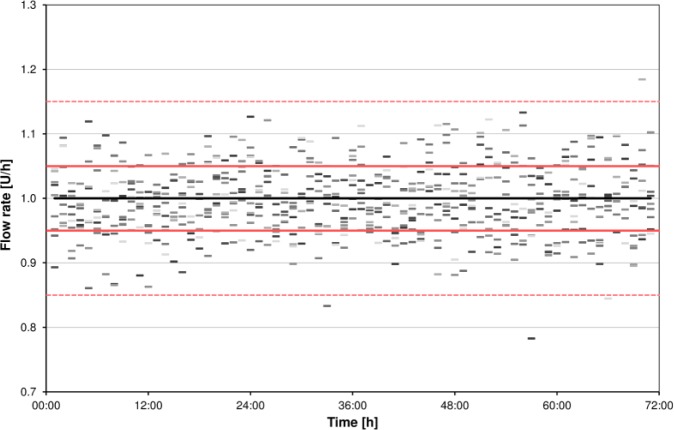
Accordingly, trumpet curves are shown by manufacturers in their insulin pumps’ user manuals; however, especially considering insulin pumps and their clinical use, these curves may not be appropriate and not easy to understand. There are three main aspects that have to be kept in mind: Trumpet curves according to IEC 60601-2-24 exclude the first 24 hours of measurements, the so-called stabilization period, which is, from a clinician’s point of view, extremely important, given that usually an IIS is already exchanged after 48 to 72 hours.17 In addition, trumpet curves only show extreme values (minimum and maximum error) that are not necessarily representative for the performance of an insulin pump, especially in an experimental setting. The x-axis of a trumpet curve shows increasing times over which values are averaged (so-called observation windows, between 15 and 930 minutes), and not the running time; so, in short, it means that the more values are averaged the more an insulin pump appears to be accurate. However, clinicians might be interested beyond that in how accurate insulin delivery is over shorter time, e. g. 1 hour, and if one given hour is comparable to the next hour and the hour before, and not only in the fact that by the end of the day the desired amount of insulin was delivered. It is therefore suggested to show an additional graph in which the deviation from target for every hour of the measurement period is shown. Specifying a clinically relevant time frame is difficult, as different factors like the infusion rate, characteristics of the used insulin and intraindividual differences may have an influence. Effects of infusion rate changes were observed after 30-60 minutes and 3 hours, respectively.18,19 In addition, experiences from clinical practice lead to the assumption, that 1-hour windows might be adequate. Figure 4 shows an example of such a graph, which provides a comprehensive overview about the accuracy and variability of basal rate delivery over time. However, like for all other time windows, especially when very short, there remains a potential for systematic errors when the rhythm of pulsatile delivery of low basal rates follows a pattern that does not match the respective window. If for example windows of 15 minutes are used, and pulses are delivered every 10 minutes, there will be windows that include 1 pulse, and windows that include 2 pulses. If accuracy of different pumps shall be compared, it is useful to summarize all 1-hour windows of one pump model in a boxplot displaying the mean deviation, as well as 50% and 95% ranges (see Figure 5). This approach neglects accuracy over time but allows showing and comparing different insulin pumps in one graph.
Figure 4.
Example for presentation of accuracy of 1-hour windows over time (example basal rate 1.0 U/h). Flow rate is calculated from weight increases with a microgravimetric method. Single dashes represent flow rate of each 1-hour window of 9 measurements. The black line, red lines, and red dashed lines show target, target ±5%, and target ±15%, respectively.
Figure 5.
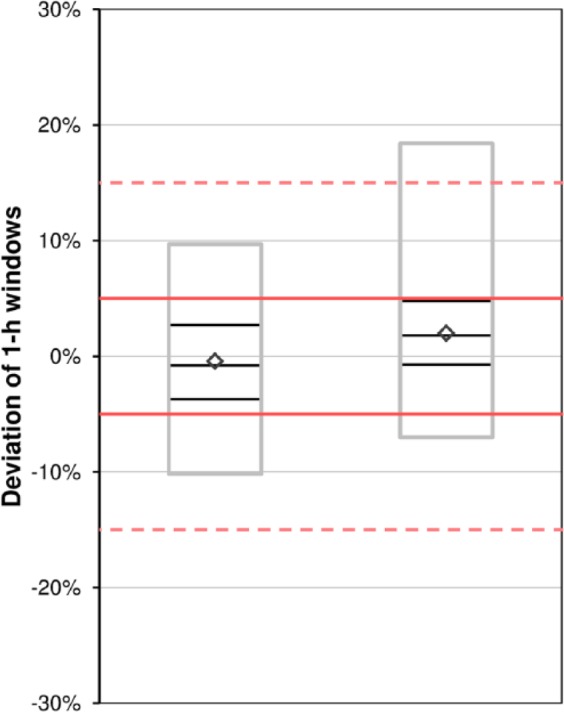
Example of boxplots over 1-hour windows for two example insulin pumps. Diamonds show mean, black boxes show median and 50% of values, gray boxes show 95% of values. Red lines and red dashed lines indicate target ±5% and target ±15%, respectively.
Referring to accuracy limits set out for blood glucose monitoring systems as described in ISO 15197:2013,20 all proposed figures include a marking of the target with a maximum ±15% range. In addition the percentage of 1-hour windows within ±15%, ±10% and ±5% of the set basal rate may be calculated and displayed (as already presented in other publications).6-8
Bolus Accuracy
IEC 60601-2-24 does not specify the presentation of bolus accuracy results, but requires the calculation of mean and percentage deviation from the target value, as well as the maximal negative and positive deviation of 25 consecutive bolus doses. Boxplots are thus an appropriate tool to show all relevant information. In addition, from a clinical view, percentages of individual doses within the ranges of ±15%, ±10%, and ±5% might be useful to be calculated and presented.
Discussion
This investigation aimed to establish methods to determine and compare accuracy of basal rate and bolus delivery of different insulin pump models. As the standard IEC 60601-2-24 is rather unspecific for several types of infusion pumps and does not consider pump characteristics from a clinical standpoint, recommendations from this standard were modified and experiences from other researchers were reflected.5-8 These modifications did not affect the testing principles, but rather the way of presenting the data. Some of the limitations and possible errors described in the basal rate testing procedures might be circumvented by applying another section of IEC 60601-2-24, section 50.105 for noncontinuous delivery that described the identification of the pulse pattern and synchronization of weight recording to this pattern.
The evaluation and presentation of basal rate accuracy data should be understandable and useful also for health care professionals and patients. Considering the absorption profile of insulin, single pulse accuracy, as presented by some others,6-8 may not be an appropriate parameter.3,18,19 Therefore, average accuracy over hourly windows, not only over 24 hours or more, is additionally meaningful and reflects the duration of one segment within a basal rate profile of most insulin pumps.21 In contrast, for bolus accuracy, every single bolus should be regarded as this reflects clinical practice. Averaging over multiple boluses might decrease the measurement error, but also a possible delivery error.
Conclusion
This article proposes instructions how to measure and evaluate important characteristics of insulin pumps. This methodology allows for comparison of different types of pumps and the presentation of clinically relevant information. However, normative requirements that are particularly designed for insulin pumps and including both types of pumps would be helpful for future evaluations. Further assessments should also include bolus delivery during a running basal rate, different bolus types and circadian basal rates, representing insulin pump use in daily life. In addition, definition of acceptance criteria or minimum requirements for insulin pumps could bring accuracy into the focus and thus help improving accuracy of bolus and basal rate delivery.
Acknowledgments
The authors would like to thank Stefan Pleus (IDT) for his input in discussing the methods and for reviewing the manuscript.
Footnotes
Abbreviations: CSII, continuous subcutaneous insulin infusion; IIS, insulin infusion set.
Declaration of Conflicting Interests: The author(s) declared the following potential conflicts of interest with respect to the research, authorship, and/or publication of this article: GF is general manager of the IDT (Institut für Diabetes-Technologie, Forschungs- und Entwicklungsgesellschaft mbH an der Universität Ulm, Ulm, Germany), which carries out clinical studies on the evaluation of BG meters and medical devices for diabetes therapy on its own initiative and on behalf of various companies. GF/IDT have received speakers’ honoraria or consulting fees from Abbott, Ascensia, Bayer, Berlin-Chemie, Becton-Dickinson, Dexcom, LifeScan, Menarini Diagnostics, Novo Nordisk, Roche Diabetes Care, Sanofi, Sensile, and Ypsomed. UK, DW, and CH are employees of the IDT. RZ has received speaker’s honoraria and/or served on advisory boards from/of Abbott, Animas, Ascensia, AstraZeneca, Lilly, Novo Nordisk, and Roche Diabetes Care.
Funding: The author(s) disclosed receipt of the following financial support for the research, authorship, and/or publication of this article: Performance of the study and scientific writing were funded by Roche Diabetes Care, Germany.
References
- 1. American Diabetes Association. Standards of medical care in diabetes—2018. Diabetes Care. 2018;41(suppl 1):s1-s156.29222369 [Google Scholar]
- 2. Phillip M, Battelino T, Rodriguez H, Danne T, Kaufman F. Use of insulin pump therapy in the pediatric age-group: consensus statement from the European Society for Paediatric Endocrinology, the Lawson Wilkins Pediatric Endocrine Society, and the International Society for Pediatric and Adolescent Diabetes, endorsed by the American Diabetes Association and the European Association for the Study of Diabetes. Diabetes Care. 2007;30(6):1653-1662. [DOI] [PubMed] [Google Scholar]
- 3. Chan A, Breton MD, Kovatchev BP. Effects of pulsatile subcutaneous injections of insulin lispro on plasma insulin concentration levels. J Diabetes Sci Technol. 2008;2(5):844-852. [DOI] [PMC free article] [PubMed] [Google Scholar]
- 4. IEC 60601-2-24:2012. Medical Electrical Equipment—Part 2-24: Particular Requirements for the Basic Safety and Essential Performance of Infusion Pumps and Controllers. 2.0 ed. [Google Scholar]
- 5. Zisser H, Breton M, Dassau E, et al. Novel methodology to determine the accuracy of the OmniPod insulin pump: a key component of the artificial pancreas system. J Diabetes Sci Technol. 2011;5(6):1509-1518. [DOI] [PMC free article] [PubMed] [Google Scholar]
- 6. Jahn LG, Capurro JJ, Levy BL. Comparative dose accuracy of durable and patch insulin infusion pumps. J Diabetes Sci Technol. 2013;7(4):1011-1020. [DOI] [PMC free article] [PubMed] [Google Scholar]
- 7. Borot S, Franc S, Cristante J, et al. Accuracy of a new patch pump based on a microelectromechanical system (MEMS) compared to other commercially available insulin pumps: results of the first in vitro and in vivo studies. J Diabetes Sci Technol. 2014;8(6):1133-1141. [DOI] [PMC free article] [PubMed] [Google Scholar]
- 8. Bowen JL, Allender CJ. A Comparative pulse accuracy study of two commercially available patch insulin infusion pumps. Eur Endocrinol. 2016;12(2):79-84. [DOI] [PMC free article] [PubMed] [Google Scholar]
- 9. Zisser H. Insulin pump (dose-to-dose) accuracy: what does it mean and when is it important? J Diabetes Sci Technol. 2014;8(6):1142-1144. [DOI] [PMC free article] [PubMed] [Google Scholar]
- 10. Capurro J, Venugopalan R, Levy B. Precision, accuracy and delivery speed of durable and patch insulin infusion pumps. Paper presented at: ATTD; February 3-6, 2015; Milan. [Google Scholar]
- 11. IEC 60601-2-24:1998. Medical electrical equipment—Part 2-24: Particular requirements for the safety of infusion pumps and controllers [English version].
- 12. Zisser HC, Bevier W, Dassau E, Jovanovic L. Siphon effects on continuous subcutaneous insulin infusion pump delivery performance. J Diabetes Sci Technol. 2010;4(1):98-103. [DOI] [PMC free article] [PubMed] [Google Scholar]
- 13. Lopez PE, King BR, Goss PW, Chockalingam G. Bubble formation occurs in insulin pumps in response to changes in ambient temperature and atmospheric pressure but not as a result of vibration. BMJ Open Diabetes Res Care. 2014;2(1):e000036. [DOI] [PMC free article] [PubMed] [Google Scholar]
- 14. Walsh J, Roberts R, Bailey T. Guidelines for insulin dosing in continuous subcutaneous insulin infusion using new formulas from a retrospective study of individuals with optimal glucose levels. J Diabetes Sci Technol. 2010;4(5):1174-1181. [DOI] [PMC free article] [PubMed] [Google Scholar]
- 15. Danne T, Bangstad HJ, Deeb L, et al. ISPAD Clinical Practice Consensus Guidelines 2014. Insulin treatment in children and adolescents with diabetes. Pediatr Diabetes. 2014;15(suppl 20):115-134. [DOI] [PubMed] [Google Scholar]
- 16. Ward LG, Heckman MG, Warren AI, Tran K. Dosing accuracy of insulin aspart flexpens after transport through the pneumatic tube system. Hosp Pharm. 2013;48(1):33-38. [DOI] [PMC free article] [PubMed] [Google Scholar]
- 17. Schmid V, Hohberg C, Borchert M, Forst T, Pfutzner A. Pilot study for assessment of optimal frequency for changing catheters in insulin pump therapy-trouble starts on day 3. J Diabetes Sci Technol. 2010;4(4):976-982. [DOI] [PMC free article] [PubMed] [Google Scholar]
- 18. Hildebrandt P, Birch K, Jensen BM, Kuhl C. Subcutaneous insulin infusion: change in basal infusion rate has no immediate effect on insulin absorption rate. Diabetes Care. 1986;9(6):561-564. [DOI] [PubMed] [Google Scholar]
- 19. Heinemann L, Nosek L, Kapitza C, Schweitzer MA, Krinelke L. Changes in basal insulin infusion rates with subcutaneous insulin infusion: time until a change in metabolic effect is induced in patients with type 1 diabetes. Diabetes Care. 2009;32(8):1437-1439. [DOI] [PMC free article] [PubMed] [Google Scholar]
- 20. International Organization for Standardization. In vitro diagnostic test systems—requirements for blood-glucose monitoring systems for self-testing in managing diabetes mellitus. ISO 15197:2013.
- 21. Bachran R, Beyer P, Klinkert C, Heidtmann B, Rosenbauer J, Holl RW. Basal rates and circadian profiles in continuous subcutaneous insulin infusion (CSII) differ for preschool children, prepubertal children, adolescents and young adults. Pediatr Diabetes. 2012;13(1):1-5. [DOI] [PubMed] [Google Scholar]


