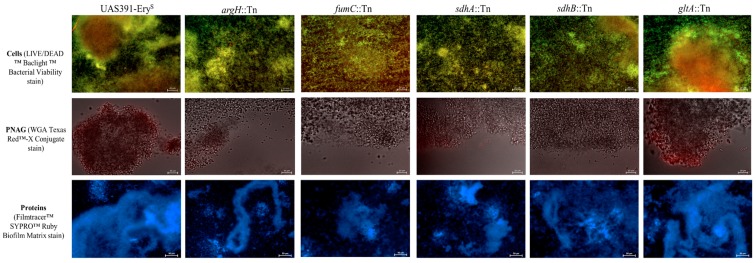
Figure 3.
Fluorescence microscopy observations of no flow biofilm matrix structure obtained from UAS391-EryS, argininosuccinate lyase (argH), fumarate hydratase class II (fumC), succinate dehydrogenase (flavoprotein subunit) (sdhA), succinate dehydrogenase iron-sulfur protein (sdhB), and citrate synthase II (gltA) Tn mutants. Since microscopy images of gltA::Tn, acnA::Tn, icd::Tn, sucC::Tn, and rocF::Tn, as well as corresponding complemented mutant biofilms were comparable to each other, the matrix formed by gltA::Tn serves as an example picture for all. The top row shows total cells stained with SYTO™ 9 and PI. The middle row shows PNAG stained with WGA Texas Red™-X Conjugate, and is combined with Bright-field imaging. The bottom row shows the protein component stained with FilmTracer™ SYPRO™ Ruby Biofilm Matrix.

