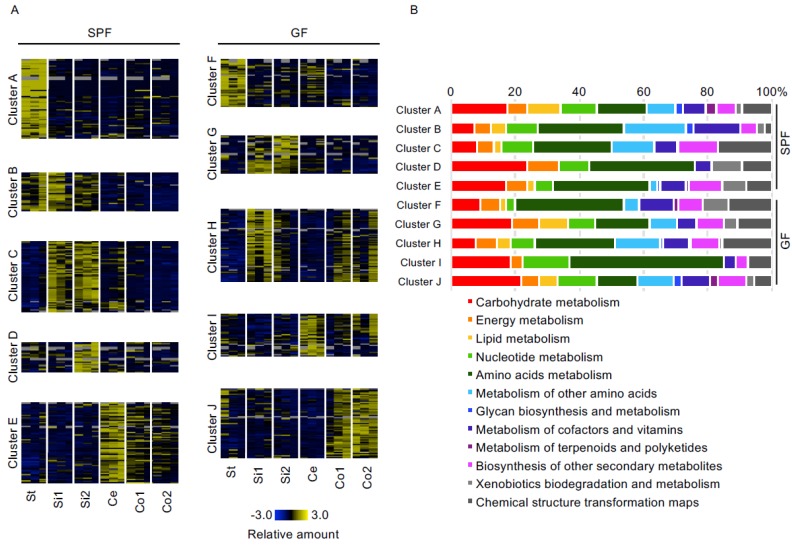
Figure 2.
Differences in gastrointestinal luminal metabolites among different parts of the gastrointestinal tract of SPF and GF mice. (A) Heatmap of luminal metabolites categorized into five groups by using K-means analysis. Columns and rows correspond to gastrointestinal parts and metabolites detected by CE-TOFMS and LC-MS/MS, respectively. These profiles were normalized to a relative value between −3 and 3. The colors indicate the z-score values calculated for the SPF and GF mice separately (n = 3). St: Stomach, Si1: Upper small intestine, Si2: Lower small intestine, Ce: Cecum, Co1: Upper colon, Co2: Lower colon. (B) Bar graphs showing the composition of the KEGG categories based on the luminal metabolites in each cluster.

