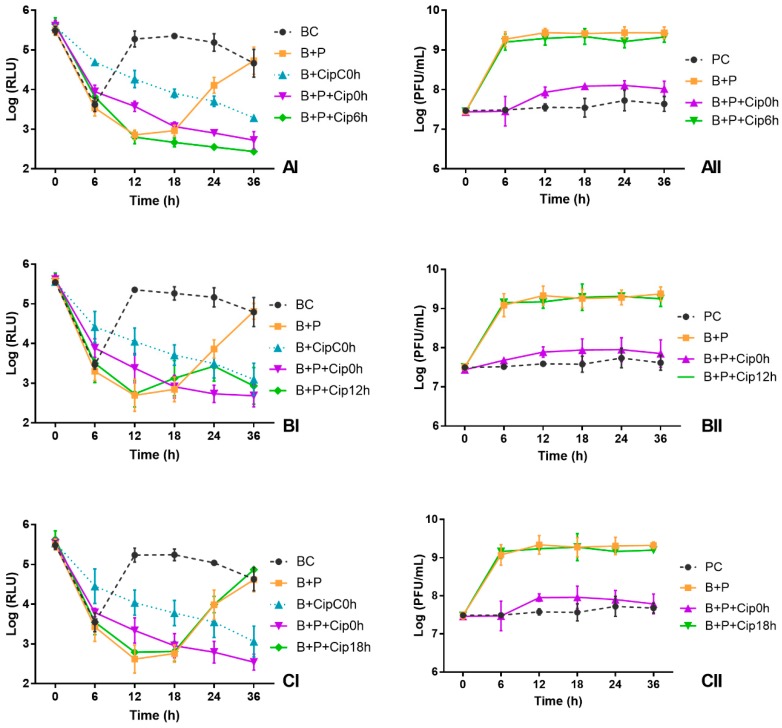
Figure 5.
Effect of time of ciprofloxacin addition at 1 × MIC on the inactivation of bioluminescent E. coli (I) and the phage concentration (II) in TSB during 36 h: (A) antibiotic added after 6 h of phage addition; (B) antibiotic added after 12 h of phage addition; and (C) antibiotic added after 18 h of phage addition. BC, Bacterial control; PC, Phage control; B + P, Bacteria plus phage; B + CipC0h, Bacteria plus antibiotic added at the same time of the phage; B + P + Cip0h, Bacteria plus phage plus antibiotic added at the same time of the phage; B + P + Cip6h, Bacteria plus phage plus antibiotic added at 6 h of phage addition; B + P + Cip12h, Bacteria plus phage plus antibiotic added at 12 h of phage addition; B + P + Cip18h, Bacteria plus phage plus antibiotic added at 18 h of phage addition. Values represent the mean of three independent experiments.

