

Abstract
New methods to identify RNA-binding small molecules open yet unexplored opportunities for the pharmacological modulation of RNA-driven biology and disease states. One such approach is the use of small molecule microarrays (SMMs). Typically, SMMs are generated by spatially arraying and covalently linking a library of small molecules to a glass surface. Next, incubation of the arrays with a fluorescently labeled RNA reveals binding interactions that are detected upon slide imaging. The relative ease with which SMMs are manufactured enables the screening of multiple oligonucleotides in parallel against tens of thousands of small molecules, providing information about both binding and selectivity of identified RNA-small molecule interactions. This approach is useful for screening a broad variety of structurally and functionally diverse RNAs. Here, we present a general method for the preparation and use of SMMs to rapidly identify small molecules that selectively bind to an RNA of interest.
Keywords: Small molecule microarrays, RNA, Nucleic acids, Inhibitors, High-throughput screening
1. Introduction
The increasingly diverse role of RNA in regulating both normal biological processes and diseases makes it attractive as a pharmacological target [1]. As such, new methods to identify drug-like small molecules that bind to and perturb the function of complex RNA structures are of high value. Recently, our laboratory has reported the use of small molecule microarrays (SMMs) as a convenient method to rapidly screen tens of thousands of compounds to identify selective RNA-binding small molecules [2]. In this approach, a diverse collection of ~20,000 small molecules is spatially arrayed and covalently bound to a glass surface. Next, slides are incubated with a fluorescently labeled oligonucleotide structure of interest. After washing to remove any unbound oligonucleotide, the slides are imaged with a fluorescence scanner (Fig. 1). Statistical analyses reveal any significant increases in fluorescence on the arrays, correlating to specific molecular interactions between the RNA and arrayed compounds.
Fig. 1.
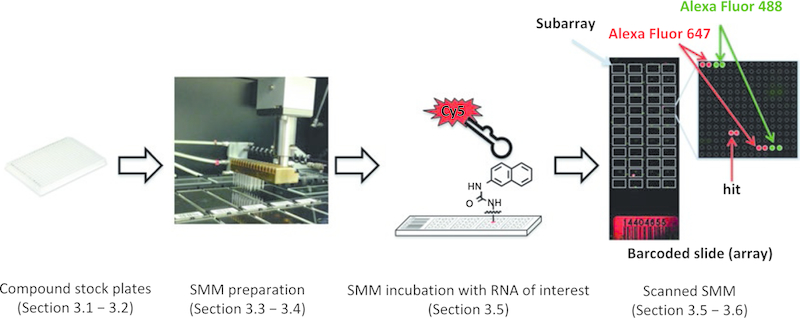
Overview of SMM strategy to identify RNA-binding small molecules. Small molecule libraries prepared in 384-well plates are utilized to print onto isocyanate-functionalized slides by the microarrayer. Prepared SMMs are next incubated with the labeled RNA of interest and scanned to detect hits
Historically, large-scale SMM screens have primarily been focused on the identification of inhibitors of “undruggable” proteins [3-8]. In the field of RNA, more recent array-based approaches such as 2-dimensional combinatorial screening [9, 10], informatics-based techniques such as INFORNA [11, 12], and to a lesser degree peptoid arrays [13, 14] have been used to screen for RNA-binding molecules. In these efforts, structured RNA targets have been evaluated against libraries of compounds that are biased toward known RNA-binding scaffolds such as aminoglycosides, cationic molecules, or Hoechst dye-like structures. Although these approaches have seen success, they are limited to the inherent bias of the library makeup. However, SMM libraries can in principle be assembled of drug-like scaffolds without a bias toward known RNA-binding motifs. In order for RNA-binding molecules to advance as therapeutics, access to more drug-like chemical matter that binds to RNA is needed. The relative ease with which SMMs can be manufactured and used to display large numbers of small molecules makes them an attractive approach for identifying novel chemical structures that bind to structurally and functionally diverse RNA targets.
As one example, we recently reported the discovery of a druglike small molecule that binds to the HIV transactivation response (TAR) hairpin using our SMM screening approach [2]. This work resulted in the identification of a compound that bound selectively to the TAR hairpin with low micromolar affinity, and had anti-HIV activity in tissue culture models. This compound was a previously unknown RNA-binding motif that had a molecular weight of 351 Da, and was not predicted to be cationic at physiological pH. Selective 2′-hydroxyl acylation analyzed by primer extension (SHAPE) analysis of the HIV 5′ untranslated region (UTR) in presence of the compound revealed effects of compound binding that could be mapped directly to the TAR hairpin, but not any of the other structural features of the 5′ UTR, indicating a highly specific interaction. As part of this initial approach, we simultaneously screened five diverse nucleic acid structures against the entire compound library. By analyzing data sets from multiple oligonucleotides in parallel, information was gained about binding to the target as well as selectivity against a number of other sequences/ structures. This parallel screening approach limited the identification of promiscuous binders (e.g., polycationic structures), resulting in a low hit rate of 0.02 % with only one false positive.
Here, we describe a method for the manufacture, screening, and analysis of SMMs to identify RNA-binding small molecules. This approach is anticipated to be broadly applicable to a variety of RNA targets, with the only requirement that the target is labeled with an appropriate fluorescent dye. In addition to providing a method for isocyanate-derived slide manufacture based on previous reports [15, 16], this protocol emphasizes library acquisition/ selection, RNA incubation (sometimes referred to as hybridization), data analysis, and hit identification.
2. Materials
2.1. Preparation of Small Molecule Source Plates
Library of small molecules containing isocyanate-reactive functional groups.
Standard 384-well V-bottom plates.
Dimethyl sulfoxide (DMSO, Bioreagent).
Alexa Fluor 488 cadaverine (Life Technologies).
Alexa Fluor 647 hydrazide (Life Technologies).
Biotin-PEG amine (Sigma-Aldrich).
Thermal peelable microplate seals.
2.2. Preparation of Isocyanate-Coated Slides
Corning GAPS II coated glass slides with barcode.
Peptide Coupling Solution: 1 mM Fmoc-8-amino-3,6-dioxaoctanoic acid, 2 mM (benzotriazol-1-yloxy)tripyrrolid-inophosphonium hexafluorophosphate (PyBOP), and 0.5 mM N,N-diisopropylethylamine (DIPEA) in 400 mL of N,N-dimethylformamide (DMF).
Fmoc Deprotection Solution: 1 % (v/v) piperidine in 400 mL of DMF.
Isocyanate Solution: 1 % (v/v) 1,6-diisocyanatohexane in 400 mL of DMF.
Tetrahydrofuran (THF, unstabilized).
Stainless steel 25-slide racks (Wheaton Scientific).
500 mL glass trough with stainless steel lid.
Plastic 5-slide storage container.
Canned air duster.
2.3. Printing of Small Molecule Microarrays
MicroGrid II Microarrayer (BioRobotics) or equivalent.
Desiccator dry storage box.
Benchtop centrifuge with microplate carrier.
48 SMP3B Stealth Microspotting Pins (Arrayit Corp.).
Stealth 48 Printhead (Arrayit Corp.).
Dissection microscope (or basic optical transmission microscope).
Plain micro slides (1 mm thick, 75 × 25 mm (L × W)).
Dimethyl sulfoxide (DMSO, Bioreagent).
Milli-Q water.
Tweezers.
Stainless steel 25-slide racks (Wheaton Scientific).
500 mL glass trough with stainless steel lid.
Pyridine (anhydrous).
Glass vacuum desiccator.
Quench Solution: 5 % (v/v) ethylene glycol and 0.1 % (v/v) pyridine in 400 mL of DMF.
N,N-dimethylformamide (DMF).
Tetrahydrofuran (THF, unstabilized).
Canned air duster or equivalent.
Plastic 25-slide storage container.
Thermal peelable microplate seals.
2.4. SMM Incubation with RNAs of Interest
RNase AWAY Decontamination Reagent (Life Technologies) or equivalent.
Alexa Fluor 647 labeled RNA of interest (IDT DNA or GE Healthcare Dharmacon).
Streptavidin-FITC (Sigma-Aldrich).
RNAse-free phosphate-buffered saline (PBS): 8 mM Na2HPO4, 2 mM KH2PO4, 137 mM NaCl, 2.7 mM KCl, pH 7.4.
RNAse-free phosphate-buffered saline with Tween 20 (PBST): 8 mM Na2HPO4, 2 mM KH2PO4 137 mM NaCl, 2.7 mM KCl pH 7.4, 0.01 % (v/v) Tween 20.
Nuclease-free (DEPC treated) water.
Parafilm.
Cardboard freezer storage box.
4-well rectangular polystyrene dishes (Nunc).
50 mL Falcon centrifuge tubes.
Kimwipes.
Tweezers.
Benchtop centrifuge.
InnoScan 1100 AL Fluorescent Scanner (Innopsys) or equivalent.
2.5. Data Analysis
Innopsys Mapix Software, GenePix Pro software, or other array imaging software.
JMP Software, or equivalent SPSS.
3. Methods
Here, we describe a protocol for the manufacture, screening, and analysis of SMMs to identify RNA-binding small molecules (Fig. 1). Details on the preparation of isocyanate-functionalized glass slides and printing of large libraries of diverse small molecules are provided (see Fig. 2, Note 1). In the described array configuration, 3840 compounds are printed in duplicate along with control molecules in 48 subarrays (containing 14 × 14 features/spots) on a single slide using 48 printing pins. Using this configuration, we print a library of 22,828 compounds on six microarray slides. An optimized protocol for using these SMMs to identify small molecules that bind to selected RNA targets is provided, including the RNA incubation and wash procedures. Finally, the data analysis and hit identification process is described to identify selective RNA-small molecule interactions.
Fig. 2.
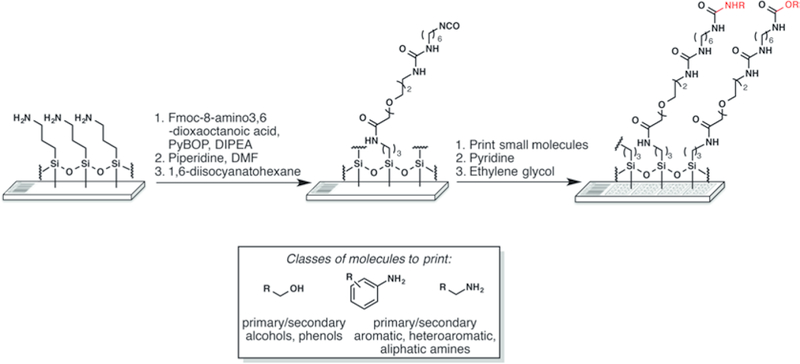
Surface chemistry for the production of SMMs. Gamma aminopropyl silane (GAPS-II) slides with barcodes are functionalized with an isocyanate group. Small molecules bearing selected nucleophiles (boxed) are printed and reacted with the isocyanate surface in the presence of pyridine vapor. The surrounding surface is then quenched with ethylene glycol to react with any unreacted isocyanate groups
3.1. Library Composition and Acquisition
Acquisition of a diverse set of small molecules is a key step for construction of a small molecule microarray. Custom libraries of organic molecules having drug-like properties as well as functional handles for immobilization onto the slide (primary and secondary amines or alcohols) are available from many commercial vendors. As considerations for building this particular library, we sought a collection of compounds with an average molecular weight near 400 Da, cLogP values nearing 4, high structural diversity within the library (using a Tanimoto cutoff of 0.8), and minimized structural overlap in purchases made from different vendors. Furthermore, compound lists were put through a filter so as to minimize the inclusion of likely promiscuous or pan-assay interference compounds (PAINS) [17]. Purchased compounds had a guaranteed purity of 85-90 %, with identity determined by 1H NMR and LC/MS analysis by the vendor. The described library includes compounds purchased from two different vendors (10,000 compounds each), a small collection of known bioactive compounds, as well as the NCI Diversity Set V. Compounds were stored at −20 °C as 10 μL aliquots of 10 mM DMSO stocks in 384-well V-bottom plates.
3.2. Preparation of Small Molecule Source Plates
Dissolve small molecules of interest in DMSO at a concentration of 10 mM and prepare 384-well V-bottom polypropylene source plates containing 10 μL of each solution. Seal each plate with a thermal plate sealer (see Note 2) and store source plates at −20 °C until use.
Prepare stock solutions of the control compounds Alexa Fluor 647 hydrazide (50 μM), Alexa Fluor 488 cadaverine (50 μM), and Biotin-PEG-Amine (10 mM) in DMSO. To prepare a control plate to be printed at the beginning and end of each subarray (see Note 3), transfer 10 μL of each stock or a DMSO control into 48 wells of a 384-well V-bottom polypropylene plate in the correct orientation for printing. The control plate should be designed in such a way that each of the 48 pins will print the appropriate control molecules in each subarray. Seal the control plate with a thermal plate sealer and store at −20 °C until use.
3.3. Preparation of Isocyanate-Coated Slides
Clean all glass troughs, stainless steel racks and stir bars with soap and water, rinse with methanol, and dry with Kimwipes to remove any dust or particulates that could damage the surface of the glass slides.
Prepare fresh Peptide Coupling Solution as described in Subheading 2.2 in a large glass trough. The Peptide Coupling Solution is used to install a short polyethylene glycol linker between the glass surface and the arrayed small molecules.
Place 25 amino-functionalized barcoded Corning GAPS II slides into a stainless steel 25-slide rack (see Note 4 for a discussion of slide handling). Submerge the rack in the fresh Peptide Coupling Solution in the glass trough, making sure that the slides are separated and avoiding air bubbles contacting the slide surfaces. The solution should fully cover the slides. Cover the trough and incubate the slides in the solution with stirring at room temperature (roughly 24 °C) in a fume hood overnight.
Remove the rack from the Peptide Coupling Solution. Allow excess liquid to drip off the rack before immersing in a clean glass trough containing DMF (400 mL). Agitate the rack thoroughly to ensure that any excess coupling reagents are washed off the surface of the slides. This can be accomplished by rapidly dipping the rack in and out of the DMF several times. Repeat the process for a total of two washes with DMF. Do not allow the slides to dry completely.
To remove the Fmoc protecting group, prepare a clean glass trough containing Fmoc Deprotection Solution as described in Subheading 2.2. Stir until mixed thoroughly. Remove the rack from the final DMF wash in step 4, allow excess DMF to drip off the rack, and submerge the slides in the solution making sure that the slides are fully immersed. Cover the trough and incubate the slides in the solution with stirring at room temperature in a fume hood for 2 h.
Remove the rack from the deprotection solution. Allow excess solution to drip off the rack briefly before rinsing in DMF (400 mL) as described previously (step 4). Repeat with fresh DMF to remove any excess piperidine.
Prepare a clean glass trough containing Isocyanate Solution as described in Subheading 2.2 to functionalize the surface of the slides with an isocyanate group. Stir until mixed thoroughly. Remove the rack from the DMF wash, allow excess liquid to drain briefly, and submerge the slides in the solution, ensuring that the slides are fully immersed. Cover the trough and incubate the slides in the solution with stirring at room temperature in a fume hood for 2 h.
Wash the slides as follows to effectively remove excess isocyanate reagent from the slides and provide clean and dry func-tionalized slides ready for printing. Remove the rack from the isocyanate solution and drain excess liquid from the rack. Immerse the rack in DMF (400 mL) and wash by agitating the rack. Drain the rack again, before immersing the slides in a clean glass trough containing THF (400 mL). Agitate to remove any remaining DMF. Perform the wash quickly to avoid drying of THF when exposed to air. Repeat with fresh THF (400 mL), leaving the rack submerged in THF after the final wash.
Remove each slide individually from the THF. Dry each slide with compressed air (barcode side first) by passing the slide through the stream of air immediately after removing from the solvent. Avoid moving the compressed air can, as this can lead to a residue on the slide surface from the propellant in the can. Completely dry each side of the slide to remove any remaining solvent and avoid residue buildup. Repeat the drying process for each slide. Slides are stored in 5-slide storage containers sealed with Parafilm in a desiccator dry box until ready for printing (do not store at this stage for more than 48 h).
3.4. Printing of Small Molecule Microarrays
Remove the compound stock plates from the freezer and allow them to thaw in a desiccator dry box. Centrifuge the plates at 1700× for 2 min at room temperature using a bench top centrifuge with microplate adapters to collect the stock solutions at the bottom of the wells and remove any air bubbles prior to printing.
Program the MicroGrid II Arrayer (or equivalent) to print in the desired configuration using the BioRobotics TAS Application Suite software (or equivalent). Printing from DMSO stocks using 48 SMP3B pins commonly provides features with diameters of approximately 150 μm. A center-to-center spacing of 300 μm typically allows sufficient distance between features to avoid spot pooling. Program the arrayer to print each compound in duplicate in adjacent spots. Instruct the arrayer to print 20 features at 400 μm center-to-center spacing on non-functionalized micro slides after each source visit to avoid printing large spots and pooling of excess solution on the activated array slides.
Inspect each of the 48 pins to be used for printing under a dissection microscope to verify that the pins are not damaged or clogged [18]. If necessary, clean clogged pins by sonicating in a water bath. Load the clean pins carefully into the printhead, avoiding touching the tips of the pins to the metal. Place the printhead into the arrayer, being careful not to damage the pins.
In the arrayer, fill one stationary bath with DMSO and a second bath with MilliQ water. Fill the main circulating wash station with MilliQ water. Using the BioRobotics TAS Application Suite software, set the pin wash protocol to “wiggle” so that pins oscillate in the DMSO bath (5 s), followed by the stationary MilliQ water bath (5 s). Last, wash the pins in the circulating MilliQ water station alternating between water and vacuum (3×). Repeat the series of washes (2×). Program the arrayer so that the pins are cleaned between each source visit. This wash protocol ensures that the pins are cleaned and compound carryover between dips is minimized (see Note 5).
Run the programmed method without compound plates and with non-functionalized micro slides before printing to validate the program and check for sticking pins (For problems with sticking pins see Note 6).
Remove the thermal seals from the control and compound plates (from step 1). Place the plates in the MicroGrid II arrayer BioBank in the correct orientation with respect to well A01 of each plate and in the desired order (see Note 7). Print the control plate at the beginning and end of the compound plates to provide fluorescent beacons for aligning the GenePix array list (GAL) file during data analysis.
Clean the slide platform with a small brush or vacuum to remove any dust or particulates from the surface. Place the correct number of non-functionalized micro slides in the correct positions (according to the arrayer software) for pre-spotting. Carefully remove any dust from the isocyanate-functionalized slides from Subheading 3.3 with compressed air. Next, place the slides onto the arrayer platform. Make sure that the slides are facing barcode side up and in a common orientation with respect to the barcode. Cover any remaining open slide positions with non-functionalized micro slides to ensure a proper vacuum seal to secure the slide positioning.
Print the small molecules on the surface of the isocyanate-functionalized slides using the developed protocol (For general print troubleshooting see Note 8).
After the print run is completed, allow the printed spots on the slides to dry. This can be achieved by leaving the slides on the platform for 30 min with the microarrayer cover closed.
Remove the slides from the platform using tweezers, contacting slides on the barcode end. Place the printed slides in a 25-slide stainless steel rack. Place the rack in a glass vacuum desiccator containing a small open beaker with pyridine (8 mL). Connect the desiccator to vacuum through Tygon tubing in a fume hood. Evacuate the desiccator and keep the slides under vacuum overnight to expose the printed slides to pyridine vapor (see Note 9).
Turn the vacuum off and slowly release the pressure to avoid condensing pyridine onto the surface of the slides. Remove the rack from the desiccator and immerse the dried slides in freshly prepared Quench Solution (as described in Subheading 2.3). Submerge the slides smoothly and quickly, making sure that the slides are separated and no air bubbles are present. Incubate for 30 min with stirring at room temperature to quench the unreacted isocyanate surface.
Wash the slides according to the standard sequence (Subheading 3.3, step 8) to effectively remove excess ethylene glycol and pyridine from the printed slides. Remove the rack from the Quench Solution and allow excess liquid to drain from the rack briefly. In a clean trough, immerse the rack in DMF (400 mL) and agitate the slides thoroughly. Drain the rack again before immersing the slides in a clean glass trough containing THF (400 mL) and agitate the slides. Perform the wash quickly to avoid drying of THF when exposed to air. Repeat with fresh THF (400 mL). Leave the rack submerged in THF after the final wash.
Dry slides according to the standard sequence (Subheading 3.3, step 9). Remove each slide individually from the THF. As it is removed, dry each slide with compressed air (barcode side first) by passing the slide through the stream of air immediately after removing from the solvent. Avoid moving the compressed air can, as this can cause a residue on the slide surface from the propellant. Make sure to completely dry each side of the slide to remove any remaining solvent and avoid spots on the surface from solvent residue.
Store the slides in 25-slide storage containers sealed with Parafilm in a desiccator dry box for short-term storage prior to screening. Generally, printed SMMs are stable in a desiccator box for up to 6 months at room temperature without loss of image quality.
3.5. SMM Incubation with RNAs of Interest
All procedures should be performed under RNase-free conditions to avoid degradation of the RNAs used for screening. Use RNase AWAY or RNaseZap to clean the work surface, pipets, racks, gloves, etc. When handling RNA, use RNase-free, sterile, filtered pipet tips to avoid contamination of the RNA samples. Prepare all buffers with RNase-free (DEPC treated) water. Short RNAs can be chemically synthesized by IDT DNA or Dharmacon with a Cy5 or Alexa Fluor 647 label at the 5′ end (see Note 10). Longer constructs can be in vitro synthesized with T7 polymerase and enzymatically labeled with a fluorescent tag [19]. To increase chances of identifying selective hits for an RNA of interest, counterscreening with appropriate RNA controls is recommended. Representative controls include scrambled sequences, mutated sequences, or related RNA structures.
Perform pre-scans of the slides used for screening on a fluorescence scanner to check the quality of the print. Image the fluorescence using 635 and 488 nm excitation lasers to visualize the Alexa Fluor 647 and Alexa Fluor 488 control dyes with a 5 or 10 μm pixel resolution. Note any autofluorescent compounds in the screening library.
Prepare the 5′-Alexa Fluor 647 labeled RNAs of interest by resuspending to approximately 100 μM in PBS (1×). Anneal the RNAs to obtain proper folding by heating to 95 °C for 3 min, followed by cooling to room temperature over 1 h (or other appropriate folding protocol for the RNA of interest). Quantify the concentration of the annealed RNAs using a NanoDrop or other appropriate spectrometer.
Prepare working stocks of the RNAs of interest in PBST buffer. For the incubation method described here, RNAs are screened at 5 μM in 500 μL PBST. However, the screening concentration and wash protocols may be modified to suit the RNA of interest and avoid background signal (see Note 11). The slides treated with the RNAs of interest should be compared to a separate slide incubated with PBST buffer to detect changes in fluorescence at each spot.
The Parafilm incubation method described here is utilized to minimize the quantity of RNA needed for each slide (see Note 12). Cut a strip of Parafilm roughly twice the size of the glass slide and secure it to a smooth flat surface such as a cardboard freezer storage box (or clean lab bench) with tape. Make sure that there are no bumps o ripples in the Parafilm (leaving the Parafilm on the paper backing will help to achieve a smooth surface). Rinse the Parafilm with PBST buffer. Place a small open beaker or vial with PBST buffer (2 mL) inside the freezer box during slide incubation to create a humidity chamber and to help prevent evaporation of the sample during incubation.
Pipet 500 μL of the RNA solution or PBST buffer onto the Parafilm. Holding the edges of the barcode end of the printed slide, carefully place the opposite end of the slide (printed side down) onto the drop of buffer. Slowly lower the slide down to the Parafilm, allowing the RNA solution to evenly spread across the entire slide surface. Avoid introducing air bubbles between the Parafilm and the printed slide surface. To prevent scratching the slide surface, do not move the slide once it is placed on the Parafilm. Repeat for each RNA of interest on a separate strip of Parafilm. Cover the slides with the top of the freezer box to avoid light exposure and minimize fluorophore bleaching. Incubate the microarray slides with the RNAs (or buffer) for 2 h at room temperature.
Carefully remove the microarray slides from the Parafilm by gently lifting by the edges at the barcode end with large tweezers. Transfer the slides to a Nunc 4-well plate, barcode side up. Using a serological pipet, add PBST buffer (4 mL) to the barcode end of each slide and wash for 2 min with gentle agitation, covered with aluminum foil, to remove remaining unbound RNA from the slides. Repeat with fresh PBST (4 mL) (see Note 13).
Dry the slide by centrifugation using a slide centrifuge or a benchtop centrifuge by placing each slide in a 50 mL Falcon tube with Kimwipes pressed at the bottom of the tube to absorb any liquid. Centrifuge at 1700 × for 2 min at room temperature.
Image the slides using a fluorescence scanner to assess the binding of the RNAs to the small molecules. Image the fluorescence using 635 and 488 nm excitation lasers in order to visualize the 5′-Alexa Fluor 647 labeled RNAs and the Alexa Fluor 647 and 488 control dyes. Adjust the laser power and PMT gain of the scanner to obtain good fluorescence intensity and avoid saturation. Use at least a 5 μm pixel size to ensure adequate resolution of the features on the slide.
3.6. Data Analysis
Align the GAL file for the array on the slide image using the Mapix software. The GAL file correlates each microarray feature with the corresponding compound identifier (IDs) on the scanned image. Use the printed fluorescent controls as beacons to help manually align each subarray. Since most of the features will not be fluorescent, initial manual alignment of the subarray grids is suggested. Once the subarray grids are aligned, use the automated spot finding feature to accurately locate the position of each feature and determine the diameter of the individual microarray features. Manually inspect the fitted GAL grid to confirm that the software has moved and sized the features appropriately.
In the Mapix software, use the Photometric Calculations icon to quantify the fluorescence signal for each array feature and generate a results file that contains information about the fluorescent intensity. Required data are signal-to-noise ratios (SNR) for each spot at the relevant wavelength (in this case 635 nm), corresponding IDs/compound names, and spot location on the array (subarray, column, and row). The SNR for each spot is calculated by the Mapix software based on the pixel mean within the defined area of a spot (as determined by alignment of the associated GAL file) and the pixel mean and standard deviation of the local background noise around the spot. Therefore, accurate alignment of the GAL file is imperative. Other parameters (e.g., fluorescence in other wavelengths) for each feature on the scanned microarray can be useful for higher-level analysis but are not required for hit identification. Repeat for each slide in the screen and the buffer incubated slide.
Import the compound IDs and SNR 635 data for each feature on each slide into a statistical software package such as JMP for further data analysis. Generate flags for the control compounds indicating the Alexa Fluor 647, Alexa Fluor 488, biotin, DMSO negative controls, as well as any empty spots, to exclude these from statistical analysis of the library data.
Perform statistical analysis on the SNR 635 data for each slide to determine the mean and coefficient of variation (CV) for the replicate spots of each compound. Determine the mean and standard deviation of the SNR 635 data for the entire screening library (excluding control spots).
- For each compound, generate a composite Z-score using the following equation. Here, the Mean SNR635compound is the mean of the SNR635 data for the replicate features of an individual compound, Mean SNR635library is the mean of the SNR635 data for the entire library on a given slide, and the SD SNR635library is the standard deviation of the SNR635 data for the entire library (excluding control spots).
(1) - Use JMP to identify a list of hit compounds according to the following three criteria (see Note 14):
-
(a)CV of the two compound spots (CV[RNA] 635) should be relatively low to avoid compounds that show fluorescence in only one feature. Using a threshold of 200 % is suggested and will aid in eliminating false positives.
(2) -
(b)Hit compounds should have a composite Z score of greater than three. Set a Z score threshold for the compound in the presence of the RNA of interest (Z[RNAJ 635). A threshold of three standard deviations from the mean is a common threshold for identifying hits in high throughput screening. In Fig. 3, a representative data set is shown from a single slide, with compounds that have a Z score greater than three indicated.
(3) -
c)Hit compounds should show an increase in fluorescence in the presence of the RNA compared to the buffer incubated slide (ruling out autofluorescent compounds, Fig. 4). Set a parameter such that the Z score for the compound on the RNA incubated slide () is 3 units higher than the associated buffer incubated Z score ().
(4)
-
(a)
In parallel, generate a hit list for a second RNA structure screened in an analogous way as a control. Compare hit lists from both screens (and if available, any previously run screens) to assess selectivity of a compound across multiple RNA sequences/structures and to rule out promiscuous hits. An example of such analysis is shown for six compounds screened against two RNAs (Table 1). Note that hit lists are generated for each slide individually, and later combined to form a master hit list for the entire screen. This minimizes errors caused by differences in background between different slides.
Visually inspect the microarray features for each compound that was identified as a hit by quantitative data analysis. Hit compounds should show fluorescence in both of the duplicate features on the RNA incubated microarray, but no/low fluorescence in the buffer treated slide (compounds 1 and 2 are examples of selective binders, Table 1 and Fig. 4). Specific interactions will display increased fluorescence on the microarray only when incubated with the target RNA, not on slides incubated with other RNAs screened in parallel (compound 3 is an example of nonspecific binder, Table 1 and Fig. 4). False negative compounds can be observed when spots spread beyond the detection limits set by the GAL file, and are difficult to detect mathematically using the SNR635 data generated by the software (compound 4, Table 1 and Fig. 4). False negatives demonstrate the importance of visual inspection of the microarray features, as compounds similar to 4 may not be identified as hits through the data analysis process, but could represent selective binders. Similarly, false positive hits may be ruled out by visual inspection, often appearing as small spots of intense fluorescence in only one of the duplicate features (compound 5, Table 1 and Fig. 4). This suggests that the high Z-score is caused by nonspecific fluorescence due to something other than small molecule interaction with the RNA, such as dust particulates. Alternatively, autofluorescent compounds that change slightly in their fluorescence intensity (compound 6, Table 1 and Fig. 4) may also be falsely identified as hits, but can be ruled out through visual inspection. Spot morphology should also be evaluated and considered when generating a hit list.
Once a hit list is generated based on both the quantitative data analysis and visual inspection of the microarray features, rule out likely promiscuous compounds based on structural features such as polycations and/or PAINS molecules (compound 2 Table 1 and Fig. 3). Hit compounds can be reacquired through the original commercial vendor or de novo chemical synthesis and should be thoroughly analyzed for purity by NMR and LC/MS before further evaluation. At this point, hits can be independently validated in orthogonal structural, biochemical, biophysical, and functional biological assays.
Fig. 3.
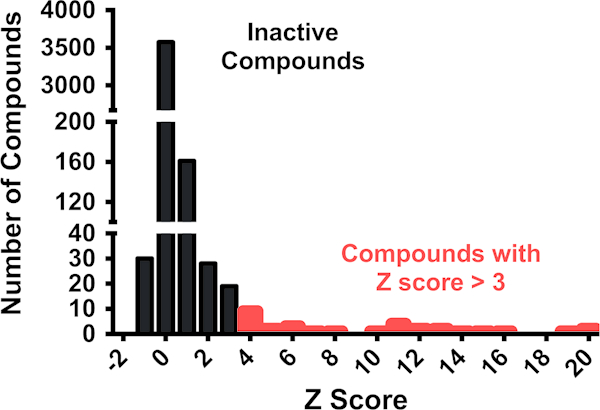
SMM dataset obtained from screening a single SMM slide with an RNA of interest. Compounds with Z scores above 3 are indicated in red. Note that not all compounds indicated meet all the criteria to be considered true hits, but must be further analyzed
Fig. 4.
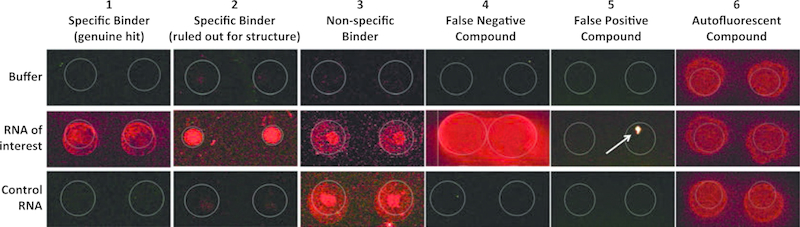
Representative SMM images of select compounds identified through SMM screening of two different RNA targets (RNA of interest and Control RNA) compared with a buffer only control (Buffer)
Table 1.
Representative quantitative data for select compounds identified through SMM screening of an RNA of interest (RNA) and Control RNA (RNActrl) compared with a buffer only control (buffer)
| Compound | Zbuffer | ZRNA | ZRNActrl | CVRNA | Hit | Notes |
|---|---|---|---|---|---|---|
| 1 | 0.14 | 8.34 | 1.67 | 10.5 | Yes | Specific binder |
| 2 | 0.54 | 10.3 | 0.76 | 23.8 | No* | Specific binder ruled out by structure (e.g., polycation) |
| 3 | 0.99 | 10.0 | 7.37 | 10.1 | No | Nonspecific binder |
| 4 | 0.03 | 1.26 | 0.97 | 0.91 | Yes | False negative |
| 5 | 0.22 | 6.69 | −0.11 | 146 | Noa | False positive (e.g., dust particulate) |
| 6 | 13.0 | 3.03 | 4.15 | 3.8 | No | Autofluorescent compound |
These compounds mathematically satisfy the defined hit criteria, but were later ruled out upon visual inspection or based on structural features
Acknowledgment
This Research was supported by the Intramural Research Program of the NIH, National Cancer Institute, Center for Cancer Research.
Footnotes
Notes
Several covalent attachment approaches to immobilize small molecules onto glass slides have been developed [7, 16, 20-22]. Here, an isocyanate-functionalized surface was chosen based on its efficient reactivity toward a variety of nucleophilic functional groups, which are often present in drug-like small molecules.
Adhesive-based plate seals can occasionally leave an adhesive residue on the top of sealed compound plates after removal. This residue can potentially clog the printing pins during SMM production; therefore, thermal plate seals are recommended for sealing 384-well plates.
The Alexa Fluor 647 and Alexa Fluor 488 fluorescent dyes are used for quality control to verify that the microarray print is successful (as visualized in pre-scans). In addition, they aid in aligning the GenePix array list (GAL) file to the slide images during data processing. Printing of the control plate at both the beginning and end of the library plates provides fluorescent beacons in the top left and bottom right corners of each subarray that will help with proper alignment of the GAL file (Fig. 1). The Biotin-PEG-amine control can also be used to assess the quality of the print run and validate the incubation protocols. This can be achieved by incubating a slide with Streptavidin-FITC. Finally, DMSO features are used as negative controls and can be used to quantify background heterogeneity by measuring variance of fluorescence in the spots across the slide.
Proper handling of slides is crucial for preparation and screening of SMMs. Gloves should be worn at all times and changed frequently to avoid leaving residues on the slide surface. Handle slides by the barcode region or the edges of the slides exclusively to avoid damaging the print surface. Extreme care should be taken to avoid contacting the array surface at any time. Any dust or particulates should be removed from the slides using compressed air. During the slide chemistry, slides should never be allowed to dry completely until after the final wash series following the isocyanate reaction. This minimizes imperfections on the slide surface generated by residues from the solvents.
Optimization of the wash procedure between source visits may be necessary to remove carryover of compounds during printing. The dwell time in each bath and the number of cycles through the wash series may be increased if carryover is observed (typically this can be seen with the control dyes). Alternatively, depending on the capabilities of the arrayer, a sonication step may also be included in the wash procedure.
Occasionally, pins stick in the printhead during the print, causing the printer to miss spots. If this occurs, pause the run, remove the pin, and clean the pin and printhead using a Kimwipes and pipe cleaner, respectively, with isopropanol and methanol. Dry the pin and printhead with compressed air before replacing the pin and resume printing. Pins can also be cleaned in a sonicator if this protocol does not resolve the pin sticking.
The order and orientation of the plates determines the GAL file generated to map each compound location in the print. Therefore, caution should be taken to correctly place the plates in MicroGrid II arrayer BioBank.
The procedure described here for printing of the SMMs uses a BioRobotics MicroGrid II arrayer, however, equivalent arrayers can be used and optimization of the procedure may be necessary for the particular instrument. Several problems may arise during the print that can affect the quality of the arrays; however, these can often be corrected with changes to the print protocol. For example, if pooling of compound spots is observed on slides during the print, the number of pre-spot features after each source visit can be increased. Alternatively, modifying the source action of the arrayer to use the soft-touch function, decreasing the contact time while printing, or changing the number of dips in the source plates can also minimize excess solution on the slides and provide superior spot morphology. If features are missing on the arrays, check to make sure that all of the pins move freely in the printhead during the run. If so, the z-axis may need to be adjusted so that the pins make contact with the compound solutions in each well during the source visit.
The pyridine vapor will catalyze the covalent attachment of the small molecule functional groups that are less reactive towards the isocyanate surface.
In principal, RNAs can be labeled with any fluorescent dye that is compatible with the scanner. However, the choice of a far-red fluorescent dye such as Alexa Fluor 647 or Cy5 is preferable. This minimizes interference with the small number of compounds that autofluoresce in other wavelengths.
For this protocol, RNAs are screened at 5 μM in 500 μL PBST. However, the concentration of RNA may be modified to suit the RNA of interest. If a low hit rate is observed, this may indicate that a higher concentration is necessary. In contrast, a high hit rate or high background heterogeneity may indicate a screening concentration that is too high and must be lowered or that modifications to wash protocols may be necessary. One way to resolve this issue is to wet the slide with PBST buffer prior to applying the RNA. Additionally, if high background binding is observed, the slide can be blocked prior to or during the RNA incubation using calf thymus RNA, BSA, or other common blocking reagents. Optimization may be necessary for a given RNA.
The described RNA incubation utilizes Parafilm to minimize the quantity of RNA needed for each slide and maximize the screening concentration. An alternative approach using 4-well rectangular polystyrene dishes (Nunc dishes), which requires a larger sample volume (3 mL) to cover the slide surface during incubation, can also be used if one is not limited by RNA availability. Alternatively, hybridization chambers using cover slips or Lifter slips can also be used. However, it is imperative to be cautious when applying the RNA to the dry slide, as uneven addition of the RNA solution can give rise to large, highly fluorescent spots on the slide surface. In all cases, care should be taken not to scratch the slide surface, as arrays are easily damaged.
The wash protocol following RNA incubation should be optimized to maximize hit identification and minimize background binding. High background signals/heterogeneity can be caused by inefficient wash conditions. If necessary, an additional PBST wash (4 mL) followed by a brief wash with RNase-free water (4 mL) can be added to decrease background fluorescence. In contrast, if few or no hits are observed, less stringent wash conditions can be achieved by decreasing the number of washes or length of time incubated in PBST during a wash.
Modification of the hit criteria, such as changing the Z-score threshold and the CV threshold can provide a higher or lower hit rate and decrease false positives. Furthermore, changing parameters in the data analysis can reveal genuine hits that are not identified otherwise. It is recommended to critically consider the quality and properties of each data set (e.g., background levels, slide image quality, or background heterogeneity) before rigorously utilizing criteria for hit determination.
References
- 1.Cooper TA, Wan LL, Dreyfuss G (2009) RNA and disease. Cell 136(4):777–793 [DOI] [PMC free article] [PubMed] [Google Scholar]
- 2.Sztuba-Solinska J et al. (2014) Identification of biologically active, HIV TAR RNA-binding small molecules using small molecule microarrays. J Am Chem Soc 136(23):8402–8410 [DOI] [PMC free article] [PubMed] [Google Scholar]
- 3.Hergenrother PJ, Depew KM, Schreiber SL (2000) Small-molecule microarrays: covalent attachment and screening of alcohol-containing small molecules on glass slides. J Am Chem Soc 122(32):7849–7850 [Google Scholar]
- 4.Koehler AN, Shamji AF, Schreiber SL (2003) Discovery of an inhibitor of a transcription factor using small molecule microarrays and diversity-oriented synthesis. J Am Chem Soc 125(28):8420–8421 [DOI] [PubMed] [Google Scholar]
- 5.Kawasumi M et al. (2005) Small molecule microarrays to discover compounds that modulate cell cycle checkpoint function. J Invest Dermatol 124(4):A39–A39 [Google Scholar]
- 6.Miao H et al. (2007) Ring-opening and ringclosing reactions of a shikimic acid-derived substrate leading to diverse small molecules. J Comb Chem 9(2):245–253 [DOI] [PubMed] [Google Scholar]
- 7.Vegas AJ et al. (2007) Fluorous-based small-molecule microarrays for the discovery of his-tone deacetylase inhibitors. Angew Chem Int Ed Engl 46(42):7960–7964 [DOI] [PMC free article] [PubMed] [Google Scholar]
- 8.Stanton BZ et al. (2009) A small molecule that binds Hedgehog and blocks its signaling in human cells. Nat Chem Biol 5(3):154–156 [DOI] [PMC free article] [PubMed] [Google Scholar]
- 9.Aminova O, Paul DJ, Childs-Disney JL, Disney MD (2008) Two-dimensional combinatorial screening identifies specific 6′-acylated kanamycin A-and 6′-acylated neamine-RNA hairpin interactions. Biochemistry 47(48):12670–12679 [DOI] [PMC free article] [PubMed] [Google Scholar]
- 10.Disney MD et al. (2008) Two-dimensional combinatorial screening identifies specific aminoglycoside-RNA internal loop partners. J Am Chem Soc 130(33):11185–11194 [DOI] [PubMed] [Google Scholar]
- 11.Velagapudi SP, Gallo SM, Disney MD (2014) Sequence-based design of bioactive small molecules that target precursor microRNAs. Nat Chem Biol 10(4):291–297 [DOI] [PMC free article] [PubMed] [Google Scholar]
- 12.Luo Y, Disney MD (2014) Bottom-up design of small molecules that stimulate exon 10 skipping in mutant MAPT pre-mRNA. Chembiochem 15(14):2041–2044 [DOI] [PMC free article] [PubMed] [Google Scholar]
- 13.Chirayil S, Chirayil R, Luebke KJ (2009) Discovering ligands for a microRNA precursor with peptoid microarrays. Nucleic Acids Res 37(16):5486–5497 [DOI] [PMC free article] [PubMed] [Google Scholar]
- 14.Diaz JP et al. (2014) Association of a peptoid ligand with the apical loop of pri-miR-21 inhibits cleavage by Drosha. RNA 20(4):528–539 [DOI] [PMC free article] [PubMed] [Google Scholar]
- 15.Bradner JE et al. (2006) A robust small-molecule microarray platform for screening cell lysates. Chem Biol 13(5):493–504 [DOI] [PubMed] [Google Scholar]
- 16.Bradner JE, McPherson OM, Koehler AN (2006) A method for the covalent capture and screening of diverse small molecules in a microarray format. Nat Protoc 1(5):2344–2352 [DOI] [PubMed] [Google Scholar]
- 17.Baell JB, Holloway GA (2010) New substructure filters for removal of pan assay interference compounds (PAINS) from screening libraries and for their exclusion in bioassays. J Med Chem 53(7):2719–2740 [DOI] [PubMed] [Google Scholar]
- 18.Campbell CT, Zhang Y, Gildersleeve JCConstruction and use of glycan microarrays. Curr Protoc Chem Biol 2(1):37–53 [DOI] [PMC free article] [PubMed] [Google Scholar]
- 19.Hartmann RK (2009) Handbook of RNA bio-chemistry. Wiley-VCH, Weinheim, p 931, 1st student Ed, pp xliii [Google Scholar]
- 20.Childs-Disney JL, Wu ML, Pushechnikov A, Aminova O, Disney MD (2007) A small molecule microarray platform to select RNA internal loop-ligand interactions. ACS Chem Biol 2(11):745–754 [DOI] [PubMed] [Google Scholar]
- 21.Wu H, Ge J, Uttamchandani M, Yao SQ Small molecule microarrays: the first decade and beyond. Chem Commun (Camb) 47(20):5664–5670 [DOI] [PubMed] [Google Scholar]
- 22.Lee HY, Park SB (2010) Small molecule microarray: functional-group specific immobilization of small molecules. Methods Mol Biol 669:23–42 [DOI] [PubMed] [Google Scholar]