

Abstract
Recent increases in scale and decline in cost of single-cell RNA-seq now permit a repetition of cell sampling that increases the power to detect rare cell states, reconstruct developmental trajectories, and measure phenotype in new terms like cellular variance. The characterization of anatomy and developmental dynamics have not had an equivalent breakthrough since groundbreaking advances in live fluorescent microscopy. The new resolution is a boon to genetics, as the novel description of phenotype offers the opportunity to refine gene function and dissect pleiotropy. In addition, the recent pairing of high-throughput genetic perturbation with single-cell RNA-seq has made practical a scale of genetic screening not previously possible.
Keywords: single-cell RNA-seq, trajectory analysis, rare cell types, pooled CRISPR, single-cell power analysis
Introduction
A census—the collection of information at the level of the individual—can seem like a mundane exercise in data collection. But, individual counts can reveal a qualitatively different picture than summary statistics. Consider one example from United States census. California has the 10th highest average household income, but, counting individuals, it is the state with the highest number of people in poverty.
Single-cell RNA-seq is a census of living tissue in which the discrete functional unit (the cell) is measured for a set of complex characteristics -- the transcriptome. It permits a “take it apart and see what it’s made of” approach that relaxes assumptions and constraints about tissue composition and organization. Cells may no longer be in their tissue context, but they can be used to reconstruct the complex cellular environment from which they came.
For example, when sampling tissues for transcriptome analysis, experiments were often limited to collecting specific cell types that confounded many developmental stages or, alternatively, specific developmental stages with a mix of cell types. With the ability to break tissues into their constituent cells, single-cell RNA-seq can use be used to reorder cells into a step-by-step progression that mirrors their maturation in living tissue. With this resolution comes the ability to discover cell states not previously known or described. Indeed, using such techniques, single-cell RNA-seq studies have led to hypotheses of new precursors to specialized cells in nerve, blood and in the gut (33; 78; 80).
Single-cell RNA-seq also permits new ways to measure tissues that were not practical with summary statistics from even highly targeted populations. For example, two recent single-cell RNA-seq studies showed that variance in cellular expression – a property that can only be quantified with discrete measurement of individuals -- increase with age, providing intriguing implications on why organ function diminishes in older individuals.
In addition, cancer researchers point to the potential of single-cell RNA-seq to address questions about the heterogeneity of tumor environments and enable early diagnostic screens for rare pre-cancerous cells in bodily fluids (6) And, the processing power of single-cell RNA-seq has recently been combined with CRISPR-mediated perturbations to reach a scale of genetic analysis that gives new power to test combinatorial interactions in genetic networks (1; 16; 17; 35; 50).
True, measurements are noisy in any given cell (8; 10; 26; 39). However, the power of the technique lies in discovering groups of discrete cells that share a complex transcriptomic phenotype. While each gene expression measurement in any given cell comes with high noise, the complexity of measurements provides the power to group cells. (e.g., A jigsaw puzzle piece in a detailed part of the image is easier to place because the complexity provides reinforncing information on where it belongs.) The groups or clusters of cells then collectively identify a cell state in the analysis phase, often unknown a priori. The more cells define a state, the more power one has to identify the cellular state and the genetic mechanisms that distinguish that state.
And, more cells are precisely what a clever set of breakthroughs has made possible, making cellular measurements cheap and dramatically increasing the scale of experiments. For example, the original 2009 Tang et al. protocol examined six cells (75; 76). By 2015, plate-based automated liquid handling protocols enabled hundreds of cells to be sequenced (56; 65), followed by droplet-based protocols that broke the four and five-digit barrier (40; 47), with some efforts reaching six-digit cell sampling (17). In 2017, combinatorial barcoding of mRNAs within cells laid out a straight-forward approach to sequence hundreds of thousands of cells (13; 64), with the potential to reach the 1 million cell mark and beyond in a single experiment (13). A notable aspect of this progress is that the experimental set up has gotten simpler and cheaper, permitting greater access to these techniques.
The emphasis in this review will be on strategies that use single-cell RNA-seq to describe phenotype in ways not previously possible or practical. The goal is to provide the experimentalist with a broad view of the opportunities now available to explore phenotype and gene function, while paying mind to tradeoffs in experimental design. The field is growing so rapidly that the emphasis here will be on examples rather than a comprehensive coverage of each subfield of single-cell transcriptomics. (I will point out some reviews in subfields for deeper reading in some topics.) To anticipate where this fast-moving field might be headed, I will briefly cover some new developments and lay out a potential future wish list.
A primer on protocols and power analysis
Current techniques fall under three general categories: plate-based, droplet, and combinatorial indexing techniques, with increasing cell-throughput capacity, respectively. (for protocol details, see (59)). Generally, there are some trade-off between increasing cell numbers and increasing technical noise. The two critical sources of noise are: 1. So-called “dropout rates” in which mRNAs fail to be reverse transcribed in the first step of cDNA synthesis, commonly referred to as “sensitivity.” 2. Once an mRNA is converted into cDNA, it must be amplified. The fidelity of amplification of an mRNA species turned cDNA is commonly called “precision,” where, for example, biased amplification of an mRNA in one cell over another would lead to lower precision. The take home message is that plummeting costs per cell permits increased statistical power that, to some extent, can overcome these two sources of noise.
Plate-based methods
Plate-based methods are almost always combined with Fluorescence Activated Cell Sorting (FACS) to place cells of interest into 96 or 384 well plates. The SMART-seq2 protocol uses a template switching strategy from first to second strand synthesis that favors to full-length cDNA construction (60). For practical reasons, there is a tradeoff between favoring full length cDNAs and including a Unique Molecular Identifiers (UMIs), which help correct amplification noise by identifying PCR-generated duplicates. SCRB uses a similar approach but does incorporate cell specific barcodes and UMIs on a poly T primer (67).
Cel-seq and Cel-seq2 also barcode individual cells within wells during first strand synthesis but then amplify transcripts using in-vitro transcription (IVT) rather than PCR (31; 32). The IVT approach was automated for liquid handling using the massively parallel single-cell sequencing protocol or MARS-seq, which permitted UMIs at the plate, transcript, and cell level (34). Plate-based protocols have the greatest sensitivity, in particular Smart-seq2, in terms of detectable mRNAs per cell but the lowest throughput (relative to those below) in terms of cell numbers.
Droplet-based methods
Throughput capacity broke an important barrier when protocols were freed from well plates. Two protocols, inDrop and Drop-seq, used barcoded beads with poly T primers containing cell-specific barcodes dispensed into microfluidic droplets (40; 47). Mixing rates are adjusted so that droplets with two cells are rare; for example, Drop-seq developers reported droplets with more than one cell occurred from <1% to around 11%, depending on cell concentration (47). One important difference between Drop-seq and inDrop is that the former relies on PCR amplification using UMIs to reduce amplification noise while the latter uses an IVT amplification strategy to reduce the amplification noise. These protocols can routinely sequence tens of thousands of cells based on 3’ sequences but they appear to capture fewer mRNAs per cell (have lower sensitivity) compared to the plate-based methods (85).
In these methods, cells could be sorted based on markers and then loaded into one of the droplet-based instruments. However, the cell-throughput is so high for the droplet-based methods that most experiments profile dissociated cells without any pre-selection. In addition, sorting would initiate a stress to which cells would have time to respond while being processed for inDrop or Drop-seq, typically 30 minutes or more depending on the number of cells processed.
Another important consideration is that cell capture rates in the droplet methods are low, typically around 10%, so an experiment set up in which the cells of interest are very rare cells and cannot be concentrated in high numbers could make this approach impractical. The commercial single-cell RNA-seq droplet device, the 10x Genomics Chromium, which employs droplet-based processing, reports higher capture rates of up to 65% and rapid processing time of 10 minutes or less for thousands of cells in many cases (84). Many labs are using this option as it highly convenient, although per cell costs will be higher than non-commercial set ups and reagent packages and protocols are less amenable to troubleshooting and customization.
Combinatorial bar-coding
In a recent addition to single-cell RNA-seq techniques as of this writing, combinatorial indexing techniques take a simplified approach by substituting droplets for the cell itself. These methods fix and permeablize cells, allowing all cDNA and library preparation steps to be done in the cell, which becomes its own self-contained reaction vessel. The method does away with any need for single-cell isolation because intact cells can be uniquely labelled in batches by sequential barcodes or indices (Fig. 1).
Fig. 1. Strategy for combinatorial barcoding of cells in the sci-RNA-Seq protocol.

Multiple fixed permeablized cells or nuclei are distributed in each well of a 96 or 384 well plate (top left). The mRNA from each cell in a given well is reverse transcribed with a well-specific barcode (blue) using a poly T primer. Cells are re-pooled and re-distributed into wells once again for a transposase tagging and fragmentation (middle). In the triple barcoding strategy, cells receive a second well-specific barcode with the transposase tag (magenta, middle right). The 3’ fragments with the poly T primers are specifically amplified in the next step (bottom). Cells are re-pooled and redistributed again and then amplified with a primer that that contains a third well-specific barcode (green). The example shows that cells landing in the right-most well received a sequential barcode of blue, magenta, green, where 384×384×384 barcode strategy could yield millions of specific barcode combinations. (Figure Credit: Ramin Rahni).
In the sci-RNA-seq protocol, cells were pooled into 96-well plates by FACS, where they incorporated a first-strand poly T primer with a well-specific barcode in first-strand synthesis (13). All cells were then mixed and randomly re-sorted into wells for the PCR step, where they received a second well-specific barcode. With a 96 × 96 well barcode strategy, in test case with 900 cells or nuclei, the rates of accidental barcode overlap were less than 2%, although this rate can be adjusted with different pooling and barcoding strategies. The group used a 96 × 960 strategy (splitting second round labeling into 10 plates of unique well barcodes) to process ~42,000 single cell RNA-seq profiles in a single experiment.
Another method, called Split-seq, used a similar strategy but barcodes were introduced by addition of 5’-ligated adaptors in three repeated labeling and resorting steps (64). Both papers show the feasibility of triple labeling (13; 64). For example, a 384 × 384 × 384 combinatorial system would make >106-single cell RNA-seq barcodes experimentally feasible (13).
Furthermore, indexing and other techniques are compatible with nuclear mRNA profiling, which several papers have shown to give robust readouts (28; 29; 42). This opens up analysis to tissues that are not easily dissociated or that show differences in cellular dissociation have led to biases in cellular composition of cell preparations. These are early days for the combinatorial indexing techniques but the dual advantage of accessing virtually any cell with nuclear profiling and ease of processing with sequential barcoding have the potential to make many new tissues accessible for single-cell RNA-seq.
Cell number and power
Several recent benchmarking studies illustrated some of the tradeoffs and opportunities that open up with increasing throughput. The benchmarking studies evaluated mRNA detection depth (sensitivity), read count noise (precision), and sequencing costs per cell (74; 85). Ziegenhain et al. simulated the likelihood of an experiment to detect a fixed set of relative differences in transcript abundance (which they called power) given the observed dropout rates and noise associated with various plate- and droplet- based techniques. With a fixed number of cells to be profiled, benchmarking showed that each of the methods perform comparably (74; 85). For example, in spite of added technical noise, the ability of droplet-based methods to account for PCR amplification bias using UMIs compensated for the higher noise profile compared to SMART-seq2 (26; 85). Ultimately, in the comparison with fixed numbers of cells, plate-based methods that had moderate dropout rates and used UMIs to control for amplification noise, like SCRB, performed best.
However, when cell numbers can be increased relatively easily, higher throughput methods had greater power per cost. For example, to detect 80% of true positives at a sequencing depth of 250,000 reads per cell, Drop-seq costs were the lowest at $690 for 254 cells (85). Still, other methods performed comparably, so, for gene detection purposes, practical matters like a core facility with a well-working protocol remain important considerations.
While two independent benchmarking studies concluded that 1 million reads per cell was a reasonable depth where detection power was still increasing at a good rate, at least for high sensitivity protocols (74; 85), they also show that such depth is not always the most effective strategy. For example, the Zeigenhain et al. study evaluated the number of cells needed to reach an 80% true positive detection rate, given a range of simulated fold differences between two populations of cells. Using Drop-seq noise parameters, 135 cells were needed at 500,000 reads per cell and only 99 cells were needed at 1 million reads per cell. However, neither of these strategies was as cost effective as the 254 cells at 250,000 reads per cell.
Overall, the plummeting cost per cell often means that the most power per cost will come with sequencing more cells using high-throughput methods. Although the combinatorial indexing techniques were not tested in the benchmarking studies above, one would expect they them to have similar advantages to the droplet-based methods.
Thus, in terms of choice of techniques, limited ability to collect cells would favor high-sensitivity methods like SMART-seq2, MARS-seq or SCRB, while any simultaneous assessment for rare cell types and expression differences would favor high-throughput methods like the droplet-based or combinatorial indexing methods. In the former case, the ability to use UMIs should be a major consideration when full length transcripts are not a critical experimental imperative. In the latter case, there will be tradeoffs at a given sequencing output between increased cell numbers to discover rare cell states vs. per cell depth to detect transcriptional differences in cell groups. For example, if a tissue has relatively few cell types that are evenly represented, bench-marking studies suggest that cell numbers can be sacrificed in favor of greater depth (perhaps 250,000 reads per cell or higher) to gain power in the detection of gene expression differences.
Dissecting tissue phenotypes: when single cells matter
Heterogeneity and rare cell types
Developmental studies often use specific markers or combinations of markers to isolate highly localized populations by FACS. However, the approach can also get somewhat circular, fluorescent markers have been chosen to reflect morphology and markers are used to define the molecular state of cell types. One advantage of a deep census of cell identities is a comprehensive and unbiased inventory of cell types.
Such inventories were rapidly put to use to revisit cellular complexity in the brain, where single cell-analysis can address the complexity of the central nervous system (54), and in the immune system, where single-cell analysis could go beyond a finite set of cell surface markers typically used for classification (55). For example, about 2,400 dendritic cells of the human immune system were isolated using a set of known markers designed to capture the entire lineage (80). An unsupervised clustering approach identified a new potential precursor of conventional dendritic cells (cDCs). Importantly, the new precursor comprised only about 0.02% of the targeted population of cells, so any signature from these cells would have been lost in even targeted pools. The unbiased cellular census enabled the identification of these cells by their unique signature among many hundreds of cells. It is one of many take-it-apart-and-see-what-it’s-made-of approaches.
The scope of cell profiling has increased so dramatically that such exploratory approaches can now be performed on whole organisms. For example, the sci-RNA-seq combinatorial indexing technique was used to sequence all 762 cells of the Caenorhabditis elegans L2-stage larva resampling each cell about 50 times over in a total of 50,000 cells (13). Even at the relatively low per cell read depth (~20,000), the study could detect 8,613 genes, the vast majority of which showed specific enrichment in a specific cell types.
In another study, Drop-seq was used to generate a virtual reconstruction of the Drosophila (stage 6) embyo, using about 6,000 cells (38). The authors sequenced to a similar per-cell depth detecting about 3,100 transcripts. The cell-by-cell virtual reconstruction of the embryo permitted the mapping of transcriptional regulators, whose expression domain was not previously known, to just a few cells in specific regions of the embryo (38). Thus, even in this well-characterized model, the single-cell RNA-seq reconstruction of an organism could provide new descriptive detail, showing that such virtual single-cell maps could become a go-to resource in many model systems. Of course the power of the approach is that no markers are needed to isolate cells, so single-cell RNA-seq could be used to rapidly create virtual expression maps in many non-model systems – a way in which this technique can rapidly advance new models.
Another point worth noting is that, even though these studies opted for relatively shallow per cell sequencing depths, they still detected a relatively high proportion of genes, especially in the high-cell number sampling scheme in C. elegans (13). While not all genes were detected and not all cells could be mapped to tissues using a limited set of known markers, these and other studies have demonstrated that the shallow-depth/high cell number strategy is capable of mapping highly localized transcripts, like transcription factors, and not just so-called housekeeping genes. Nonetheless, benchmarking studies seem to suggest that higher per cell depth could increase power to identify localized transcripts, and deeper sequencing for resource datasets (when budgets permit) seems a strategy worth testing.
Computational strategies to reconstruction.
The noise inherent in single-cell RNA-seq read outs means that eye-balling a small number of markers to determine cell identity is highly error prone. Thus, a variety of computational approaches have arisen to classify cells and reconstruct their original position. Unsupervised dimensional reduction techniques like t-SNE, which has been used to deal with the sparse matrices like outputs from single-cell RNA-seq (79), impose the fewest constraints on the data. Other approaches use a priori information from known cell markers to classify cells by location or identity, employing various strategies to handle dropout and technical noise. For example, the Seurat package accounts for the high dropout rate of single-cell RNA-seq by using the correlation of known markers to other genes in the dataset (65). A putatively false negative locational marker is then assigned to a cell based on whether its correlated markers are present in high enough frequency in the same cell.
Others have taken a scoring approach in which markers “vote” on cell identity. False negative markers from dropouts are presumed to be overwhelmed by the signal from other markers ((2; 19; 38)). This approach has a good deal of power when there is a large marker reference set. For example, the Drosophila embryo reconstruction used a confusion matrix, which scored a positional match based on both the presence and absence of markers (38). (For a recent comprehensive review of spatial reconstruction techniques see (43).)
Unsupervised clustering approaches do not make any a priori assumptions about the realm of potential cell identities so, in theory, they are good approaches to discover cell states not previously identified. In practice, dimensionality reduction is strongly influenced by dominant expression patterns when mapping cells on a two-dimensional space so information that separates subtypes could be swamped. One approach to address this problem is to take subgroups of closely clustered cells and re-cluster them alone, where new expression trends can separate previously clumped subtypes (e.g., (13)). Supervised techniques like confusion matrices rely on known markers so they cannot detect new cell identities, although they have been used to detect chimeric identities (18; 19). On the other hand, supervised approaches are generally more sensitive and less susceptible to batch effects, so the tradeoff is between freedom to discover new cell states vs. sensitivity in detecting existing ones.
Mystery Cell States:
In many cases, a particular cell state is known to exist but reporters for the cell state may not be known or cannot specifically mark the cell. For example, in Plasmodium falciparum, commitment to persistent replication vs. sexual reproduction occurs in the schizont phase, with the ap2-g gene required for a switch to sexual reproduction (61). The sexually committed schizonts could not be distinguished from asexual counterparts and the gene expression program that mediated sexual commitment remained largely unknown aside from ap2-g’s role. This gap was addressed with Drop-seq characterization of the malarial life cycle in wildtype and a conditional AP2-G knockdown, where the population of sexually committed vs. asexual schizonts could be identified in part using a comparison with the conditional AP2-G knockdown. That permitted identification of many candidate mechanisms that mediate critical epigenetic changes known to accompany the switch to a sexual life cycle (61).
In regeneration, many questions focus on the transitional state of cells during reprogramming when the confidence in identity markers as a diagnostic is less clear. Single cell-RNA seq was used in both planaria and plant regeneration to characterize the transcriptomes of regenerating cells immediately after injury signals rapidly begin to reshape cell identity (20; 83). For example, in plants, regenerating root cells exhibited chimeric fates, as determined from reference profiles of adult cell types, but the chimeric identities most closely resembled a “primed” embryonic cell. In this case, single cell profiles provided the first clue that regeneration re-capitulated an embryonic sequence (20).
Cellular trajectories
Many central questions in developmental biology are embedded in the process by which a cell goes from a naïve to a differentiated state. Which cells give rise to new identities? What signals mediate cell fate decisions? How do cells make transitions in their regulatory states? These central questions are often blurred by the fact that collecting cells by existing markers results in the convolution of different cell stages or different cell types. However, if individual cells along a maturation gradient can be collected, single-cell RNA-seq offers a way to reconstruct the developmental continuum of specific cell types.
Some of the most frequently used computational tools to reconstruct trajectories include Monocle (77), Wanderlust (7), and Waterfall (69); (see (12) for a comprehensive review of trajectory techniques). Generally, these algorithms are designed to order cells along a maturation gradient where true order has been lost in cellular dissociation. (It’s not a true time scale of development because the same cell cannot be followed over time, thus, pseudotemporal ordering.) These algorithms typically simplify the complex RNA readout with dimensionality reduction and then take a variety of approaches to order the cells de novo, usually without any a priori information. Many approaches to the problem work well, largely because developmental transitions are often dramatic and continual at the transcriptional level providing a lot of power.
For example, Waterfall was used to order neural cells from the quiescent stem cell state to differentiating daughters in the hippocampus. The program also captures transitions in gene expression along the continuum, enabling the step-by-step transition from metabolic processes like glycolysis and glutathione and fatty acid metabolism in the quiescent state to activation of the cell cycle and the transcriptional and translational machinery (69). This study illustrates how single cell profiles can help assess the step-by-step coordination of metabolic and cell identity networks.
With the ability to order cells along a developmental timeline, the opportunity arises to map the precise points where lineages bifurcate. Herring et al. developed an algorithm called p-Creode, which uses graph theory and is designed to work with the densely-sampled cell datasets now possible with high-throughput methods (33). Using 39,000 and 17,000 cells from the small intestine and colon, respectively, the study showed that that, in the small intestine, rare chemosensory tuft cells arose from a lineage that suggested a non-secretory cell origin, which had not been clear, while the branch point that led to tuft cells in the colon suggested a different origin. The study supported ideas from mutant analysis that that cell identity has differential function in the two organs. More broadly, these early studies show how single-cell RNA-seq can resolve the early events that generate tissue complexity and the cells from which new tissue types arise.
Indeed, the earliest stages of a cell type’s divergence from a progenitor could help reconstruction the cellular environment and determine instructive signals in tissue formation. However, those cells often form an unresolved blob on the reduced dimensions of a branching trajectory. That would appear to be beyond the resolution of single cell profiling, but La Manno et al. use the signature of intronic reads from unprocessed mRNAs to predict the next cell state (41). The basis of the model is that the ratio of unprocessed to processed mRNAs is higher in early phases of a transcriptional induction and lower once transcription slows or shuts down. For example, they model cells in a pre-branch point undergoing neurogenesis in the hippocampus, predicting that one set of cells in a “blob” was primed to enter one branch of the lineage and a second set of cells the other branch. The transcripts that contribute to the directional vectors can then be analyzed to potentially possibly infer the distinct signals to which the two otherwise indistinguishable groups are responding.
Inferring instability from sparsity.
The snapshot of ordered cell states also provides some insight into the pace of development, as density says something about the time cells spend in any given state. In one case, human adult spermatogonial stem cells were ordered using Monocle (77), showing four distinct cell states with few intermediate cell states between the discrete groups (27), suggesting stable and discrete regulatory states. Another study of about 450 cells undergoing direct reprogramming from fibroblast to cardiomyocytes ordered this highly unsynchronized process using SLICER (45; 82). One low-density region corresponded to pre-induced cardiomyocytes, leading to the inference that these cells, which express both fibroblast and cardiomyocyte markers, represented an unstable state (45). The authors speculated that feedback mechanisms might make the transition state unstable, a potential barrier to reprogramming.
The ability to now profile entire organisms or tissues should also open up new opportunities to describe the relationship between independent lineages in the same tissue. Thus, approaches that can relax constraints about the relationship among cells will take greater advantage of an unbiased view of developing tissue. Along those lines, one tool called single-cell topological data analysis (scTDA) develops a framework intended relax assumptions about the path of developmental trajectories (e.g., they can be circular or even discontinuous (63)). In one case study from the paper, cells from human pre-implantation embryos were ordered both in a developmental gradient and into distinct lineages -- inner cell mass, early trophectoderm and polar trophectoderm -- without any reference datasets.
Direct Lineage Tracing
The techniques above order cells based on the similarity of their expression so there is no direct evidence of their clonal relationship. However, using gene editing techniques, clonality can be assessed if cells could be altered during development and those alterations read out in single-cell RNA-seq profiles. Several protocols took this approach; for example, Gestalt and homing guide RNA use guide-RNA targeted sequences to make continual edits in a DNA cassette that are read out by amplification of DNA or cDNA of the edited sequence (36; 49). In another strategy, Polylox employs a Cre-Recombinase targetable cassette with many alternative recognition sites to generate millions of potential unique barcodes (57). When the readouts for the edited cassettes are transcribed, the technique is compatible with single-cell RNA-seq. For example, a method called LINNAEUS targeted an endogenous RFP reporter in zebrafish with CRISPR guides, whereupon both lineage and transcriptome information could be read out together in the single cell transcriptome profile (71).
Expression variance among cells
Finally, there are some properties of tissue that were simply not feasible to measure without single-cell RNA-seq analysis, such as variance in gene expression (44; 53; 66; 81). While this measure needs to exceed the considerable technical noise, the sheer numbers of cells collected are now permit high confidence detecting differences in variance among cell populations.
Two separate papers, one in pancreas and another in immune cells, used single cell profiles to independently describe similar trends in cellular variance with aging. In the pancreas, a total of 2,544 cells from different aged donors were profiled, with the finding that islet endocrine cells from older individuals had a higher level of biological expression noise among cells (21). The second study on activated immune cells in mice found a similar trend of increased cellular variance with age (48). Interestingly, the activation of activation of CD4+ T cells in young mice and old mice did not show any average expression differences. However, while the activation of CD4+ T led to the induction of a tightly controlled core program in young mice, older mice showed higher variance in activated cells, suggesting a new parameter to consider the decline in organ function with age.
Genetic screens and comparative analyses
If the applications above are largely powerful descriptive tools, single-cell RNA-seq has also been put to use directly in genetic screens. While pooled CRISPR screens offered a way to perform large-scale knockout perturbations, single-cell RNA-seq was a natural companion assay that offered a high throughput way to assay complex phenotypes.
Pooled CRISPR combined with single-cell RNA-seq
In pooled CRISPR screens that were developed several years ago, thousands of different guide RNAs are produced in high throughput and transfected at once into a cell suspension, typically a cell culture or primary cells. The readout is based on survival (positive screens) or failure to survive (negative or dropout screens) under some treatment like a viral inoculation or an antibiotic (51). One feature lacking in these pooled perturbations was the specific effect of a given perturbation on the complex function of the cell – a gap that was filled with single-cell RNA-seq.
One problem with such screens is that the genomic readout of CRISPR-induced mutations and the RNA-seq readout cannot not be reliably assessed together in a given cell (at least for now). In addition, gRNAs are transcribed by RNA polymerase III and lack the poly A tail used to generate most cDNA libraries for single-cell RNA-seq. To address these issues, Perturb-seq and CRISP-seq generated a gRNA construct that contained a fluorescent reporter and or selectable marker fused to a guide-specific barcode, enabling selection for positive transformants and the readout of a guide-specific barcode using the cell-specific poly T primer (17; 35).
Other approaches using pooled CRISPR/single cell RNA-seq include Perturb-seq, which uses CRISPR interference instead of direct genome editing (3). To streamline guide cloning, CROP-seq, embedded the gRNA cassette in a repetitive sequence that is duplicated during lentiviral integration to generate the functional guide and readable tag in one step (16). In order to account for the fact that the same gRNA sequence can generate different DNA lesions, another technique, CRISPR-UMI, barcoded individual gRNAs, allowing for identification of clones stemming from a single gene editing event (50).
These early studies highlight the promise of single cell RNA-seq to advance our understanding of the organization of genetic networks. For example, in the Perturb-seq paper that targeted 24 transcription factors, TFs could be grouped by their control of specific modules of downstream genes. In turn, modules, could antagonistically regulate each other to influence the balance of different subtypes found among wild type cells (17) – reminiscent of so-called attractor states that mark specific cell identities (22). These early experiments also demonstrated how the scale of cell throughput could be used to explore combinations of knockouts to find additive, synergistic, and redundant genetic interactions (17). Still, one open question is how the discoveries that this technique will likely bring in the near future will reflect the structure and behavior of genetic networks in vivo.
Wildtype vs. mutant -- batch effects in comparative experiments
In genetic approaches, single-cell RNA-seq can also be used to dissect specific genotypes with a cell-by-cell inventory of alterations in transcriptional states. Such detailed views of phenotype could help address pleiotropy, for example, by finding the earliest stages in a developmental trajectory in which cellular transcriptomes begin to diverge from wild type. However, the primary problem in such comparative experiments are the batch effects that can be pronounced in single-cell experiments and would confound any comparative analysis.
Experimental Pooling.
The most straightforward approach to reducing batch effects is to process all samples together from start to finish. If the genetic background of the two samples for comparative analysis is different, polymorphisms can distinguish samples – an approach that was formalized by the developers of the ‘demuxlet’ algorithm (37). The method can work with fairly minimal genetic divergence, as just a few reads from a cell can identify its experimental origin allowing the remaining reads to be assigned by their common cell barcode. For example, the demuxlet authors determined that >98% of reads could be accurately assigned to a sample with just 20 SNP-containing reads with a minor allele frequency of 50% (37).
Another approach employs DNA-barcoded antibodies to ubiquitous and highly expressed cell-surface proteins, a technique called cell “hashing” (73). Cells from two or more conditions are pre-incubated separately with a batch-specific barcoded antibody. The antibody barcode is then read out with the cell-specific barcode to assign a cell back into the appropriate sample. The authors showed highly concordant results with demuxlet when used together, but the technique also offers a way to demultiplex batches when cells are too genetically similar for demuxlet.
Computational correction.
Nonetheless, there are still comparative experiments that don’t fit the requirements for hashing or demuxlet, so computational so computational correction of batch effects is also needed. One method identifies similar cells in the two batches by the sharing of mutual nearest neighboring cells, MNNs. Many pairs of cells are then used to generate a vector that re-aligns the two batches but, importantly, the two batches do not need to have an identical composition of cell types (30). Another approach works directly on gene-gene correlations across the two datasets, finding co-varying genes across the two datasets to align the two batches using canonical correlation analysis (CCA) (11). The authors also showed that the approach could be used to align cells collected from different single-cell protocols or even different species (11).
RNA and what else?
Multiple readouts from cells
What is next for this rapidly moving field? Many research labs are looking for ways to combine complex read outs at several levels of regulation. Single-cell read outs were first extended to open chromatin (9; 15) and then bisulfite sequencing on single cells (23–25; 70). Increasing numbers of protocols readout properties from two or more levels of regulation, such as RNA-seq/genome (46), RNA-seq/bisulfite sequencing (4) and ATAC-seq/bisulfite sequencing/nucleosome phasing (62). Many of these protocols collect sparse data on any given cell but, again, the key to these techniques is collecting many cells, grouping them in the analysis phase and generating a collective signature for any given level regulation.
Cell-surface proteins can be detected in a sequencing read out with antibodies bound to DNA sequence tags (58; 68; 72). When quantifying different cell surface proteins as opposed to the “hashing” technique mentioned above, multiple DNA-antibody barcodes can be used. The approach was used on 13 well characterized antibodies in immune cells, producing a quantitative read out of both mRNA and protein (72). Interestingly, read outs from cell surface proteins were much less prone to dropout effects because of their relatively high abundance. These combined techniques should provide new insights into how information is transferred, remembered, and altered from one level of regulation in the cell to another.
Prospectus
The study of anatomy at the organismal and cellular level laid the ground work for modern genetics by providing a basis to describe phenotypes. Just as live imaging by modern fluorescent micrscopy provided one dramatic advance in understanding developmental dynamics, single-cell RNA-seq is revealing new ways to examine tissue organization and development – neo-anatomical perspective. It may sound like an inglorious role for such a technological advance, but some of the most exciting applications of single-cell RNA-seq have revisited anatomy by taking tissues apart to reveal hidden cell states, developmental progressions, and the diversity of cellular states. In its descriptive role alone, single-cell RNA-seq has animated development by bridging the complex molecular and anatomical context of the cell.
Further advances that make stronger associations between the in vivo environment of the cell and complex single-cell read outs are needed. While lineage methods that have been developed to retrace cellular position provide an important link from intact tissue to single-cell profile, single-cell RNA-seq analysis would benefit techniques that allow a tighter association single-cell RNA-seq profiles and their specific tissue context. Some of the massively parallel in-situ hybridization techniques like MERFISH (14; 52) may address this issue, especially in parallel experiments with single-cell RNA-seq. In addition, single-cell RNA-seq methods that create local perturbations in tissue and track the response of cells in perturbed and adjacent cells at precise distances will provide more power to evaluate the influence of local signals on cell function. Ultimately, methods that combine the advances in live imaging (optogenetics, for example) with single cell-RNA-seq could fill an important gap, perhaps by fluorescent tags that are trackable between live imaging and single-cell analysis.
The noise associated with single-cell RNA-seq has made many wary of its utility, but the sheer numbers of single-cells profiles now permitted has gone a long way to addressing the noise problem. Benchmarking studies have demonstrated how cell numbers can compensate for much of the dropout and amplification noise. Still, the steady pace of decreasing costs that permitted cell-throughput to increase may be hitting a barrier since the cost of sequencing, which is not declining as fast as preparing cDNA libraries from cells, is an increasing proportion of per cell costs. Future improvements in extracting information from single cell will likely shift to increasing sensitivity by lowering the dropout rates in the first steps of cDNA preparation (e.g., (5)).
Fig. 2. Applications of single-cell RNA-seq that refine tissue organization.
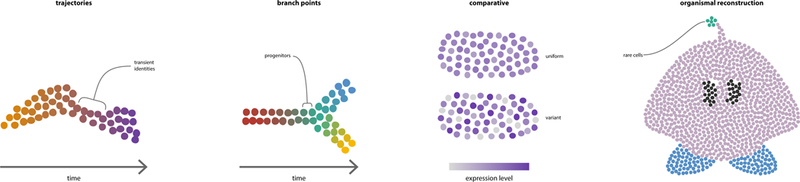
One prominent application of single expression profiles is using complex expression patterns to order cells along a developmental trajectory (left). Sparse regions along the trajectory can signify highly transient cell states. Branch point analysis reconstructs bifurcations in lineages and identifies cells that represent progenitor states (second to left). Comparative studies at the single cell level have the potential to dissect the effect of control vs. treat (or mutant) phenotypes or identify differences in the variance of gene expression between one or more groups of cells (second from left). The throughput of single cell RNA-seq studies has reached a scale that enables the profiling of entire tissues or organisms, permitting the discovery of rare cell types (green cells) or highly localized transcriptional domains not known a priori (right). (Figure Credit: Ramin Rahni).
Fig. 3. Scheme of pooled CRISPR/single-cell RNA-seq genetic screens.
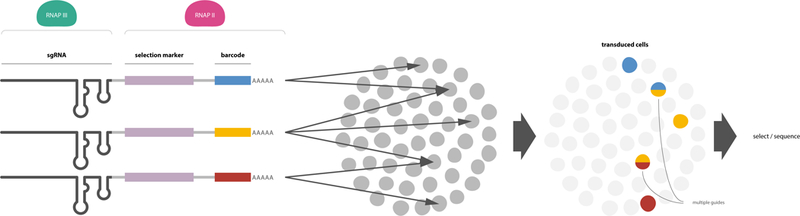
A library of guide RNA constructs in a transformation vector is prepared (left). Vectors typically contain a Pol III transcribed guide and a Pol II transcribed selectable marker of transformation with a barcode that identifies a specific guide (blue, yellow, or red colors). The guide barcode is read along with a cell-specific barcode via poly T priming to associate a guide with a cell. Single or multiple guides may transfect a cell (middle), where multiple guides will frequently generate higher order mutants (right, double colored circles). (Figure Credit: Ramin Rahni).
SUMMARY POINTS.
Single-cell RNA-seq profiles are revealing new details of developmental systems that were previously uncharacterized, allowing more precise assessment of gene function.
Power analyses show that the ability to profile many cells can address many issues that arise from technical noise in single-cell RNA-seq experiments.
The throughput of single-cell RNA-seq experiments is rapidly increasing and costs declining, putting rapidly increasing power and the potential to generate community resources, like cell-by-cell whole organism maps.
The combination of pooled CRISPR and single-cell RNA-seq offers a new approach to construct genetic networks that includes large-scale combinatorial loss of function screening.
New experimental approaches are focusing on profiling both mRNA and other levels of regulation in single cells, including chromatin and protein. Single-cell RNA-seq with lineage analysis will permit a greater capacity to connect cell profiles with in-vivo development.
Acknowledgements:
I acknowledge my plant anatomy professor, Ray Franklin Evert of the University of Wisconsin, who animated form and function with his great passion. I also acknowledge funding and support from the National Institutes of Health, Grant GM078279.
References
- 1.Aarts M, Georgilis A, Beniazza M, Beolchi P, Banito A, et al. 2017. Coupling shRNA screens with single-cell RNA-seq identifies a dual role for mTOR in reprogramming-induced senescence. Genes Dev 31:2085–98 [DOI] [PMC free article] [PubMed] [Google Scholar]
- 2.Achim K, Pettit JB, Saraiva LR, Gavriouchkina D, Larsson T, et al. 2015. High-throughput spatial mapping of single-cell RNA-seq data to tissue of origin. Nat Biotechnol 33:503–9 [DOI] [PubMed] [Google Scholar]
- 3.Adamson B, Norman TM, Jost M, Cho MY, Nunez JK, et al. 2016. A Multiplexed Single-Cell CRISPR Screening Platform Enables Systematic Dissection of the Unfolded Protein Response. Cell 167:1867–82 e21 [DOI] [PMC free article] [PubMed] [Google Scholar]
- 4.Angermueller C, Clark SJ, Lee HJ, Macaulay IC, Teng MJ, et al. 2016. Parallel single-cell sequencing links transcriptional and epigenetic heterogeneity. Nat Methods 13:229–32 [DOI] [PMC free article] [PubMed] [Google Scholar]
- 5.Bagnoli JW, Ziegenhain C, Janjic A, Wange LE, Vieth B, et al. 2017. mcSCRB-seq: sensitive and powerful single-cell RNA sequencing. bioRxiv [DOI] [PMC free article] [PubMed] [Google Scholar]
- 6.Baslan T, Hicks J. 2017. Unravelling biology and shifting paradigms in cancer with single-cell sequencing. Nat Rev Cancer 17:557–69 [DOI] [PubMed] [Google Scholar]
- 7.Bendall SC, Davis KL, Amir el AD, Tadmor MD, Simonds EF, et al. 2014. Single-cell trajectory detection uncovers progression and regulatory coordination in human B cell development. Cell 157:714–25 [DOI] [PMC free article] [PubMed] [Google Scholar]
- 8.Brennecke P, Anders S, Kim JK, Kolodziejczyk AA, Zhang X, et al. 2013. Accounting for technical noise in single-cell RNA-seq experiments. Nat Methods 10:1093–5 [DOI] [PubMed] [Google Scholar]
- 9.Buenrostro JD, Wu B, Litzenburger UM, Ruff D, Gonzales ML, et al. 2015. Single-cell chromatin accessibility reveals principles of regulatory variation. Nature 523:486–90 [DOI] [PMC free article] [PubMed] [Google Scholar]
- 10.Buettner F, Natarajan KN, Casale FP, Proserpio V, Scialdone A, et al. 2015. Computational analysis of cell-to-cell heterogeneity in single-cell RNA-sequencing data reveals hidden subpopulations of cells. Nat Biotechnol 33:155–60 [DOI] [PubMed] [Google Scholar]
- 11.Butler A, Satija R. 2017. Integrated analysis of single cell transcriptomic data across conditions, technologies, and species. bioRxiv [DOI] [PMC free article] [PubMed] [Google Scholar]
- 12.Cannoodt R, Saelens W, Saeys Y. 2016. Computational methods for trajectory inference from single-cell transcriptomics. Eur J Immunol 46:2496–506 [DOI] [PubMed] [Google Scholar]
- 13.Cao J, Packer JS, Ramani V, Cusanovich DA, Huynh C, et al. 2017. Comprehensive single-cell transcriptional profiling of a multicellular organism. Science 357:661–7 [DOI] [PMC free article] [PubMed] [Google Scholar]
- 14.Chen KH, Boettiger AN, Moffitt JR, Wang S, Zhuang X. 2015. RNA imaging. Spatially resolved, highly multiplexed RNA profiling in single cells. Science 348:aaa6090. [DOI] [PMC free article] [PubMed] [Google Scholar]
- 15.Cusanovich DA, Daza R, Adey A, Pliner HA, Christiansen L, et al. 2015. Multiplex single cell profiling of chromatin accessibility by combinatorial cellular indexing. Science 348:910–4 [DOI] [PMC free article] [PubMed] [Google Scholar]
- 16.Datlinger P, Rendeiro AF, Schmidl C, Krausgruber T, Traxler P, et al. 2017. Pooled CRISPR screening with single-cell transcriptome readout. Nat Methods 14:297–301 [DOI] [PMC free article] [PubMed] [Google Scholar]
- 17.Dixit A, Parnas O, Li B, Chen J, Fulco CP, et al. 2016. Perturb-Seq: Dissecting Molecular Circuits with Scalable Single-Cell RNA Profiling of Pooled Genetic Screens. Cell 167:1853–66 e17 [DOI] [PMC free article] [PubMed] [Google Scholar]
- 18.Efroni I, Birnbaum KD. 2016. The potential of single-cell profiling in plants. Genome Biol 17:65. [DOI] [PMC free article] [PubMed] [Google Scholar]
- 19.Efroni I, Ip PL, Nawy T, Mello A, Birnbaum KD. 2015. Quantification of cell identity from single-cell gene expression profiles. Genome Biol 16:9. [DOI] [PMC free article] [PubMed] [Google Scholar]
- 20.Efroni I, Mello A, Nawy T, Ip PL, Rahni R, et al. 2016. Root Regeneration Triggers an Embryo-like Sequence Guided by Hormonal Interactions. Cell 165:1721–33 [DOI] [PMC free article] [PubMed] [Google Scholar]
- 21.Enge M, Arda HE, Mignardi M, Beausang J, Bottino R, et al. 2017. Single-Cell Analysis of Human Pancreas Reveals Transcriptional Signatures of Aging and Somatic Mutation Patterns. Cell 171:321–30 e14 [DOI] [PMC free article] [PubMed] [Google Scholar]
- 22.Enver T, Pera M, Peterson C, Andrews PW. 2009. Stem cell states, fates, and the rules of attraction. Cell Stem Cell 4:387–97 [DOI] [PubMed] [Google Scholar]
- 23.Farlik M, Sheffield NC, Nuzzo A, Datlinger P, Schonegger A, et al. 2015. Single-cell DNA methylome sequencing and bioinformatic inference of epigenomic cell-state dynamics. Cell reports 10:1386–97 [DOI] [PMC free article] [PubMed] [Google Scholar]
- 24.Gravina S, Dong X, Yu B, Vijg J. 2016. Single-cell genome-wide bisulfite sequencing uncovers extensive heterogeneity in the mouse liver methylome. Genome Biol 17:150. [DOI] [PMC free article] [PubMed] [Google Scholar]
- 25.Gravina S, Ganapathi S, Vijg J. 2015. Single-cell, locus-specific bisulfite sequencing (SLBS) for direct detection of epimutations in DNA methylation patterns. Nucleic Acids Res 43:e93. [DOI] [PMC free article] [PubMed] [Google Scholar]
- 26.Grun D, Kester L, van Oudenaarden A. 2014. Validation of noise models for single-cell transcriptomics. Nat Methods 11:637–40 [DOI] [PubMed] [Google Scholar]
- 27.Guo J, Grow EJ, Yi C, Mlcochova H, Maher GJ, et al. 2017. Chromatin and Single-Cell RNA-Seq Profiling Reveal Dynamic Signaling and Metabolic Transitions during Human Spermatogonial Stem Cell Development. Cell Stem Cell 21:533–46 e6 [DOI] [PMC free article] [PubMed] [Google Scholar]
- 28.Habib N, Avraham-Davidi I, Basu A, Burks T, Shekhar K, et al. 2017. Massively parallel single-nucleus RNA-seq with DroNc-seq. Nat Methods 14:955–8 [DOI] [PMC free article] [PubMed] [Google Scholar]
- 29.Habib N, Li Y, Heidenreich M, Swiech L, Avraham-Davidi I, et al. 2016. Div-Seq: Single-nucleus RNA-Seq reveals dynamics of rare adult newborn neurons. Science 353:925–8 [DOI] [PMC free article] [PubMed] [Google Scholar]
- 30.Haghverdi L, Lun ATL, Morgan MD, Marioni JC. 2017. Correcting batch effects in single-cell RNA sequencing data by matching mutual nearest neighbours. bioRxiv [DOI] [PMC free article] [PubMed] [Google Scholar]
- 31.Hashimshony T, Senderovich N, Avital G, Klochendler A, de Leeuw Y, et al. 2016. CEL-Seq2: sensitive highly-multiplexed single-cell RNA-Seq. Genome Biol 17:77. [DOI] [PMC free article] [PubMed] [Google Scholar]
- 32.Hashimshony T, Wagner F, Sher N, Yanai I. 2012. CEL-Seq: single-cell RNA-Seq by multiplexed linear amplification. Cell reports 2:666–73 [DOI] [PubMed] [Google Scholar]
- 33.Herring CA, Banerjee A, McKinley ET, Simmons AJ, Ping J, et al. 2017. Unsupervised Trajectory Analysis of Single-Cell RNA-Seq and Imaging Data Reveals Alternative Tuft Cell Origins in the Gut. Cell Syst [DOI] [PMC free article] [PubMed] [Google Scholar]
- 34.Jaitin DA, Kenigsberg E, Keren-Shaul H, Elefant N, Paul F, et al. 2014. Massively parallel single-cell RNA-seq for marker-free decomposition of tissues into cell types. Science 343:776–9 [DOI] [PMC free article] [PubMed] [Google Scholar]
- 35.Jaitin DA, Weiner A, Yofe I, Lara-Astiaso D, Keren-Shaul H, et al. 2016. Dissecting Immune Circuits by Linking CRISPR-Pooled Screens with Single-Cell RNA-Seq. Cell 167:1883–96 e15 [DOI] [PubMed] [Google Scholar]
- 36.Kalhor R, Mali P, Church GM. 2017. Rapidly evolving homing CRISPR barcodes. Nat Methods 14:195–200 [DOI] [PMC free article] [PubMed] [Google Scholar]
- 37.Kang HM, Subramaniam M, Targ S, Nguyen M, Maliskova L, et al. 2018. Multiplexed droplet single-cell RNA-sequencing using natural genetic variation. Nat Biotechnol 36:89–94 [DOI] [PMC free article] [PubMed] [Google Scholar]
- 38.Karaiskos N, Wahle P, Alles J, Boltengagen A, Ayoub S, et al. 2017. The Drosophila embryo at single-cell transcriptome resolution. Science 358:194–9 [DOI] [PubMed] [Google Scholar]
- 39.Kim HU, Lee KR, Jung SJ, Shin HA, Go YS, et al. 2015. Senescence-inducible LEC2 enhances triacylglycerol accumulation in leaves without negatively affecting plant growth. Plant Biotechnol J [DOI] [PMC free article] [PubMed] [Google Scholar]
- 40.Klein AM, Mazutis L, Akartuna I, Tallapragada N, Veres A, et al. 2015. Droplet barcoding for single-cell transcriptomics applied to embryonic stem cells. Cell 161:1187–201 [DOI] [PMC free article] [PubMed] [Google Scholar]
- 41.La Manno G, Soldatov R, Hochgerner H, Zeisel A, Petukhov V, et al. 2017. RNA velocity in single cells. bioRxiv [DOI] [PMC free article] [PubMed] [Google Scholar]
- 42.Lake BB, Ai R, Kaeser GE, Salathia NS, Yung YC, et al. 2016. Neuronal subtypes and diversity revealed by single-nucleus RNA sequencing of the human brain. Science 352:1586–90 [DOI] [PMC free article] [PubMed] [Google Scholar]
- 43.Lee JH. 2017. Quantitative approaches for investigating the spatial context of gene expression. Wiley Interdiscip Rev Syst Biol Med 9 [DOI] [PMC free article] [PubMed] [Google Scholar]
- 44.Li J, Klughammer J, Farlik M, Penz T, Spittler A, et al. 2016. Single-cell transcriptomes reveal characteristic features of human pancreatic islet cell types. EMBO Rep 17:178–87 [DOI] [PMC free article] [PubMed] [Google Scholar]
- 45.Liu Z, Wang L, Welch JD, Ma H, Zhou Y, et al. 2017. Single-cell transcriptomics reconstructs fate conversion from fibroblast to cardiomyocyte. Nature 551:100–4 [DOI] [PMC free article] [PubMed] [Google Scholar]
- 46.Macaulay IC, Haerty W, Kumar P, Li YI, Hu TX, et al. 2015. G&T-seq: parallel sequencing of single-cell genomes and transcriptomes. Nat Methods 12:519–22 [DOI] [PubMed] [Google Scholar]
- 47.Macosko EZ, Basu A, Satija R, Nemesh J, Shekhar K, et al. 2015. Highly Parallel Genome-wide Expression Profiling of Individual Cells Using Nanoliter Droplets. Cell 161:1202–14 [DOI] [PMC free article] [PubMed] [Google Scholar]
- 48.Martinez-Jimenez CP, Eling N, Chen HC, Vallejos CA, Kolodziejczyk AA, et al. 2017. Aging increases cell-to-cell transcriptional variability upon immune stimulation. Science 355:1433–6 [DOI] [PMC free article] [PubMed] [Google Scholar]
- 49.McKenna A, Findlay GM, Gagnon JA, Horwitz MS, Schier AF, Shendure J. 2016. Whole-organism lineage tracing by combinatorial and cumulative genome editing. Science 353:aaf7907. [DOI] [PMC free article] [PubMed] [Google Scholar]
- 50.Michlits G, Hubmann M, Wu SH, Vainorius G, Budusan E, et al. 2017. CRISPR-UMI: single-cell lineage tracing of pooled CRISPR-Cas9 screens. Nat Methods 14:1191–7 [DOI] [PubMed] [Google Scholar]
- 51.Miles LA, Garippa RJ, Poirier JT. 2016. Design, execution, and analysis of pooled in vitro CRISPR/Cas9 screens. Febs J 283:3170–80 [DOI] [PubMed] [Google Scholar]
- 52.Moffitt JR, Hao J, Wang G, Chen KH, Babcock HP, Zhuang X. 2016. High-throughput single-cell gene-expression profiling with multiplexed error-robust fluorescence in situ hybridization. Proc Natl Acad Sci U S A 113:11046–51 [DOI] [PMC free article] [PubMed] [Google Scholar]
- 53.Muraro MJ, Dharmadhikari G, Grun D, Groen N, Dielen T, et al. 2016. A Single-Cell Transcriptome Atlas of the Human Pancreas. Cell Syst 3:385–94 e3 [DOI] [PMC free article] [PubMed] [Google Scholar]
- 54.Ofengeim D, Giagtzoglou N, Huh D, Zou C, Yuan J. 2017. Single-Cell RNA Sequencing: Unraveling the Brain One Cell at a Time. Trends Mol Med 23:563–76 [DOI] [PMC free article] [PubMed] [Google Scholar]
- 55.Papalexi E, Satija R. 2018. Single-cell RNA sequencing to explore immune cell heterogeneity. Nat Rev Immunol 18:35–45 [DOI] [PubMed] [Google Scholar]
- 56.Paul F, Arkin Y, Giladi A, Jaitin DA, Kenigsberg E, et al. 2015. Transcriptional Heterogeneity and Lineage Commitment in Myeloid Progenitors. Cell 163:1663–77 [DOI] [PubMed] [Google Scholar]
- 57.Pei W, Feyerabend TB, Rossler J, Wang X, Postrach D, et al. 2017. Polylox barcoding reveals haematopoietic stem cell fates realized in vivo. Nature 548:456–60 [DOI] [PMC free article] [PubMed] [Google Scholar]
- 58.Peterson VM, Zhang KX, Kumar N, Wong J, Li L, et al. 2017. Multiplexed quantification of proteins and transcripts in single cells. Nat Biotechnol 35:936–9 [DOI] [PubMed] [Google Scholar]
- 59.Picelli S 2017. Single-cell RNA-sequencing: The future of genome biology is now. RNA Biol 14:637–50 [DOI] [PMC free article] [PubMed] [Google Scholar]
- 60.Picelli S, Bjorklund AK, Faridani OR, Sagasser S, Winberg G, Sandberg R. 2013. Smart-seq2 for sensitive full-length transcriptome profiling in single cells. Nat Methods 10:1096–8 [DOI] [PubMed] [Google Scholar]
- 61.Poran A, Notzel C, Aly O, Mencia-Trinchant N, Harris CT, et al. 2017. Single-cell RNA sequencing reveals a signature of sexual commitment in malaria parasites. Nature 551:95–9 [DOI] [PMC free article] [PubMed] [Google Scholar]
- 62.Pott S 2017. Simultaneous measurement of chromatin accessibility, DNA methylation, and nucleosome phasing in single cells. eLife 6 [DOI] [PMC free article] [PubMed] [Google Scholar]
- 63.Rizvi AH, Camara PG, Kandror EK, Roberts TJ, Schieren I, et al. 2017. Single-cell topological RNA-seq analysis reveals insights into cellular differentiation and development. Nat Biotechnol 35:551–60 [DOI] [PMC free article] [PubMed] [Google Scholar]
- 64.Rosenberg AB, Roco C, Muscat RA, Kuchina A, Mukherjee S, et al. 2017. Scaling single cell transcriptomics through split pool barcoding. bioRxiv [Google Scholar]
- 65.Satija R, Farrell JA, Gennert D, Schier AF, Regev A. 2015. Spatial reconstruction of single-cell gene expression data. Nat Biotechnol 33:495–502 [DOI] [PMC free article] [PubMed] [Google Scholar]
- 66.Segerstolpe A, Palasantza A, Eliasson P, Andersson EM, Andreasson AC, et al. 2016. Single-Cell Transcriptome Profiling of Human Pancreatic Islets in Health and Type 2 Diabetes. Cell Metab 24:593–607 [DOI] [PMC free article] [PubMed] [Google Scholar]
- 67.Semrau S, Goldmann JE, Soumillon M, Mikkelsen TS, Jaenisch R, van Oudenaarden A. 2017. Dynamics of lineage commitment revealed by single-cell transcriptomics of differentiating embryonic stem cells. Nat Commun 8:1096. [DOI] [PMC free article] [PubMed] [Google Scholar]
- 68.Shahi P, Kim SC, Haliburton JR, Gartner ZJ, Abate AR. 2017. Abseq: Ultrahigh-throughput single cell protein profiling with droplet microfluidic barcoding. Scientific reports 7:44447. [DOI] [PMC free article] [PubMed] [Google Scholar]
- 69.Shin J, Berg DA, Zhu Y, Shin JY, Song J, et al. 2015. Single-Cell RNA-Seq with Waterfall Reveals Molecular Cascades underlying Adult Neurogenesis. Cell Stem Cell 17:360–72 [DOI] [PMC free article] [PubMed] [Google Scholar]
- 70.Smallwood SA, Lee HJ, Angermueller C, Krueger F, Saadeh H, et al. 2014. Single-cell genome-wide bisulfite sequencing for assessing epigenetic heterogeneity. Nat Methods 11:817–20 [DOI] [PMC free article] [PubMed] [Google Scholar]
- 71.Spanjaard B, Hu B, Mitic N, Junker JP. 2017. Massively parallel single cell lineage tracing using CRISPR/Cas9 induced genetic scars. bioRxiv [DOI] [PMC free article] [PubMed] [Google Scholar]
- 72.Stoeckius M, Hafemeister C, Stephenson W, Houck-Loomis B, Chattopadhyay PK, et al. 2017. Simultaneous epitope and transcriptome measurement in single cells. Nat Methods 14:865–8 [DOI] [PMC free article] [PubMed] [Google Scholar]
- 73.Stoeckius M, Zheng S, Houck-Loomis B, Hao S, Yeung B, et al. 2017. Cell “hashing” with barcoded antibodies enables multiplexing and doublet detection for single cell genomics. bioRxiv [DOI] [PMC free article] [PubMed] [Google Scholar]
- 74.Svensson V, Natarajan KN, Ly LH, Miragaia RJ, Labalette C, et al. 2017. Power analysis of single-cell RNA-sequencing experiments. Nat Methods 14:381–7 [DOI] [PMC free article] [PubMed] [Google Scholar]
- 75.Tang F, Barbacioru C, Nordman E, Li B, Xu N, et al. 2010. RNA-Seq analysis to capture the transcriptome landscape of a single cell. Nat Protoc 5:516–35 [DOI] [PMC free article] [PubMed] [Google Scholar]
- 76.Tang F, Barbacioru C, Wang Y, Nordman E, Lee C, et al. 2009. mRNA-Seq whole-transcriptome analysis of a single cell. Nat Methods 6:377–82 [DOI] [PubMed] [Google Scholar]
- 77.Trapnell C, Cacchiarelli D, Grimsby J, Pokharel P, Li S, et al. 2014. The dynamics and regulators of cell fate decisions are revealed by pseudotemporal ordering of single cells. Nat Biotechnol 32:381–6 [DOI] [PMC free article] [PubMed] [Google Scholar]
- 78.Usoskin D, Furlan A, Islam S, Abdo H, Lonnerberg P, et al. 2015. Unbiased classification of sensory neuron types by large-scale single-cell RNA sequencing. Nature neuroscience 18:145–53 [DOI] [PubMed] [Google Scholar]
- 79.van der Maaten L, Hinton G. 2008. Visualizing Data using t-SNE. Journal of Machine Learning Research 1:1–48 [Google Scholar]
- 80.Villani AC, Satija R, Reynolds G, Sarkizova S, Shekhar K, et al. 2017. Single-cell RNA-seq reveals new types of human blood dendritic cells, monocytes, and progenitors. Science 356 [DOI] [PMC free article] [PubMed] [Google Scholar]
- 81.Wang YJ, Schug J, Won KJ, Liu C, Naji A, et al. 2016. Single-Cell Transcriptomics of the Human Endocrine Pancreas. Diabetes 65:3028–38 [DOI] [PMC free article] [PubMed] [Google Scholar]
- 82.Welch JD, Hartemink AJ, Prins JF. 2016. SLICER: inferring branched, nonlinear cellular trajectories from single cell RNA-seq data. Genome Biol 17:106. [DOI] [PMC free article] [PubMed] [Google Scholar]
- 83.Wurtzel O, Cote LE, Poirier A, Satija R, Regev A, Reddien PW. 2015. A Generic and Cell-Type-Specific Wound Response Precedes Regeneration in Planarians. Dev Cell 35:632–45 [DOI] [PMC free article] [PubMed] [Google Scholar]
- 84.Zheng GX, Terry JM, Belgrader P, Ryvkin P, Bent ZW, et al. 2017. Massively parallel digital transcriptional profiling of single cells. Nat Commun 8:14049. [DOI] [PMC free article] [PubMed] [Google Scholar]
- 85.Ziegenhain C, Vieth B, Parekh S, Reinius B, Guillaumet-Adkins A, et al. 2017. Comparative Analysis of Single-Cell RNA Sequencing Methods. Molecular cell 65:631–43 e4 [DOI] [PubMed] [Google Scholar]