Abstract
Purpose
To compare the RETeval sensor strip and Dawson-Trick-Litzkow (DTL) electrodes for recording the photopic negative response (PhNR) using a portable electroretinogram (ERG) device in eyes with and without glaucoma.
Methods
Twenty-six control and 31 glaucoma or glaucoma-suspect participants were recruited. Photopic ERGs were recorded with sensor strip and DTL electrodes in random order using the LKC RETeval device. Stimuli consisted of brief, red flashes (1.7 cd.s/m2) on a blue background (photopic 10 cd/m2). The PhNR amplitude was measured from baseline to trough and also expressed as a ratio over the b-wave amplitude.
Results
The sensor strip-recorded PhNR amplitude was significantly attenuated (mean ± standard deviation [SD], 4.8 ± 2.1 vs. 12.7 ± 4.8 μV, P < 0.0001), with lower signal-to-noise ratio (SNR; 5.5 ± 2.1 vs. 8.1 ± 3.9, P < 0.0001), and a trend toward a larger PhNR/b-wave ratio compared with DTL electrodes. The PhNR amplitude, implicit time and PhNR/b-wave ratio correlated with visual field mean light sensitivity, although this fell short of significance for the sensor strip recorded PhNR amplitude. The electrodes demonstrated similar intersession repeatability with a coefficient of repeatability of ±27% and ±28% for the DTL and sensor strip, respectively.
Conclusions
Sensor strip electrodes are a viable alternative for recording reproducible PhNRs, especially when values are normalized to the b-wave. However, DTL electrodes should be considered in cases of attenuated PhNR, or in elevated noise levels, due to its better signal-to-noise quality.
Translational Relevance
Sensor strip electrodes can simplify PhNR recordings in the clinic, potentially eliminating the need for an experienced operator.
Keywords: photopic negative response, PhNR, electroretinography
Introduction
Despite the potential of the photopic negative response (PhNR) as an objective marker in glaucoma1–8 and inner retinal disorders,9–15 its use has not gained widespread acceptance. This slow clinical translation is possibly related to large test-retest variability,16,17 as well as the perceived challenges in recording and interpreting values with conventional electroretinogram (ERG) systems.
The obstacles to routine PhNR recording may be potentially overcome with the availability of a relatively inexpensive, portable ERG device (RETeval; LKC Technologies Inc., Gaithersburg, MD) and improved signal processing techniques to reduce variability.18 While the RETeval device is marketed as a screening tool for diabetic retinopathy,19–21 it can perform International Society for Clinical Electrophysiology of Vision (ISCEV) standard full-field ERG protocols and may be additionally programmed to record the PhNR.18,22,23
The device is sold with self-adhesive, sensor strip electrodes that are easy and quick to apply, and may eliminate the need for an experienced operator.24,25 However, the electrode arrangement differs from convention as the active, reference, and ground electrodes are contained within a single strip. Further, while the adhesive gel pads allow for quick application, they may contribute to greater impedance and therefore lower signal quality. The latter is particularly problematic if skin preparation is inadequate, especially as the sensor strips have a large area of skin contact.23,25
While a recent study has shown PhNR recordings from the sensor strips to be reproducible between sessions and by different operators,22 no formal comparison has been made with the commonly used conductive fiber electrodes, Dawson-Trick-Litzkow (DTL) electrodes.26 Therefore, the aim of this study was to compare the performance of the two electrodes in healthy volunteers and participants with glaucoma to determine which is more suitable for PhNR recording in the clinic using the RETeval device.
Method
Twenty-six healthy volunteer controls (mean age ± standard deviation [SD]: 52 ± 16 years, range: 27–78 years) were recruited from staff and students at the Centre for Eye Research Australia or family members of glaucoma participants. All controls had normal slit-lamp inspection and good ocular health. Eighteen participants returned within 1 month to assess intersession repeatability. Data from three participants were excluded due to significant blink and lid twitch artefacts with the DTL electrode.
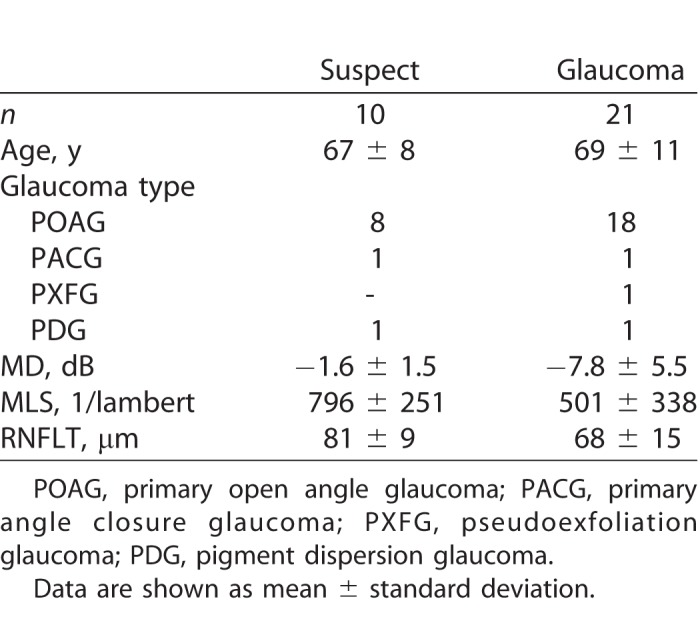
Thirty-one glaucoma or glaucoma suspect participants (see Table 1 for demographic data) were recruited from the following two sites: public outpatient clinics at Royal Victorian Eye and Ear Hospital (RVEEH, Melbourne, Australia) or a private ophthalmology clinic (Melbourne Eye Specialists, Australia). The diagnosis of glaucoma was based on the presence of a glaucomatous optic disc with a reproducible visual field (VF) defect (24-2 SITA standard, Humphrey Field Analyser; Carl Zeiss Meditec, Inc., Dublin, CA) and a Glaucoma Hemifield Test (GHT) outside normal limits. Glaucoma suspects were defined as those with suspicious optic disc with a visual field GHT within normal limits. Retinal nerve fiber layer thickness (RNFLT) was measured using spectral-domain optical coherence tomography (SD-OCT; Spectralis, Heidelberg Engineering, Dossenheim, Germany; or RS-3000 Advance; NIDEK, Aichi, Japan).
Table 1.
Demographic Data of the Glaucoma and Glaucoma Suspect Participants
The research followed the tenets of the Declaration of Helsinki and was approved by the Human Research Ethics Committee at RVEEH (13/1121H). Informed consent was obtained from all participants prior to examination. The exclusion criteria for all participants were visual acuity worse than 6/12, insufficient ERG quality, ophthalmic surgery within the previous 6 months, diabetes mellitus, and other eye conditions (except visually insignificant cataracts). Testing was performed in one eye only as follows: in control participants, this was the eye with the better visual acuity, and in glaucoma participants, this was the eye with the better VF mean deviation (MD).
Electrodes
The RETeval sensor strip and DTL-like electrode were tested one at a time in random order. After cleaning the skin with 70% isopropyl alcohol swabs, the sensor strip was carefully placed 2 mm below the lower eyelid on the orbital rim, and connected to the sensor strip lead.25 For the DTL setup, a single thread of DTL fiber (22/1 dtex; Shieldex Trading, Palmyra, NY) was placed in the lower conjunctival sac following topical anesthesia (Alcaine 0.5%; Alcon Laboratories, Macquarie Park, NSW, Australia). Reference and ground gold-cup skin electrodes (Grass Technologies, Astro-Med Inc., West Warwick, RI) were placed on the temple and forehead, respectively. These were connected to the RETeval adapter cable.
Electroretinography
The pupil was dilated using tropicamide 0.5% (Mydriacyl; Alcon Laboratories). Participants were adapted to ambient light in the clinic for at least 10 minutes (average 400 lux) followed by 1 minute of blue background light. Monocular, full-field stimulation was produced using the RETeval device. The stimuli consisted of brief (≤4 ms), red flashes (1.7 cd.s/m2) on a steady blue background (photopic 10 cd/m2). One hundred flashes were delivered at a frequency of 2 Hz, which has been found to achieve a good balance between testing time and signal quality.27 Signals were acquired at a sampling frequency of 2 kHz. Photopic luminance was calibrated using an International Light Photometer (model ILT-1700; International Light Technologies, Newburyport, MA).
Signal Analysis
All raw traces were extracted and processed offline using MATLAB (R2016b; MathWorks, Natick, MA). A band-pass filter (0.3–300 Hz)28,29 was applied to the raw data. Individual traces were detrended with a third order polynomial fitted to the entire signal, a method that we have reported recently to provide the optimal balance in reducing baseline drift and improving PhNR repeatability.18 Artefacts, such as blinks, were removed using a multivariate analysis based on robust principal component analysis (rPCA). In brief, we removed outlier traces that were defined in the two-dimensional rPCA space as traces whose Mahalanobis distance was greater than 2.4, which corresponds to the square root of the 5% upper tail of the χ2 distribution with 2 degrees of freedom.18
All remaining traces were averaged, and the amplitude of the following parameters were extracted from the average trace as follows: a-wave, defined as the trough in the time window 0 to 30 ms and measured from baseline; b-wave, defined as the maximum after the a-wave and measured from a-wave trough to peak; and the PhNR, defined as the trough after the b-wave in the time window 60 to 90 ms after the stimulus onset. As the PhNR trough can be broad and affected by baseline noise, we averaged 11 consecutive sample points centered at the trough (i.e., 5.5 ms on either side of the minimum) to obtain the PhNR amplitude.15,30 The implicit times of the ERG parameters were defined as the delay times to the respective peak and troughs. In addition, the PhNR/b-wave ratio was defined as the PhNR divided by the b-wave (measured from the a-wave trough). The signal-to-noise ratio (SNR) was calculated as the PhNR amplitude divided by the root-mean-square (RMS) noise of the prestimulus baseline (0–100 ms) of the average waveform.
Statistics
The Shapiro-Wilk normality test was used to assess if the differences in PhNR amplitude, ratio, implicit time, and SNR were normally distributed. Paired Student's t-test was used to compare electrode differences while one-way ANOVA was used to compare group differences. Pearson's correlation coefficient was computed to assess the correlation between mean light sensitivity (MLS) and PhNR parameters in glaucoma and glaucoma suspect participants. The MLS was determined by converting each VF test location (excluding blind spot) from decibel to 1/Lambert units (where the decibel is 10 × log [1/Lambert]), and averaging all 52 values.31 The coefficient of repeatability was calculated and expressed as a percentage of mean test-retest values (COR%).32 Summary measures are presented as mean and SD unless otherwise specified.
Results
Representative ERG traces for both electrodes in a control and glaucoma participant are shown in Figure 1. The morphology of the ERG waveform and PhNR measured via the sensor strip was maintained in both examples, as evident when the waveforms were normalized to the b-wave (Fig. 1B).
Figure 1.
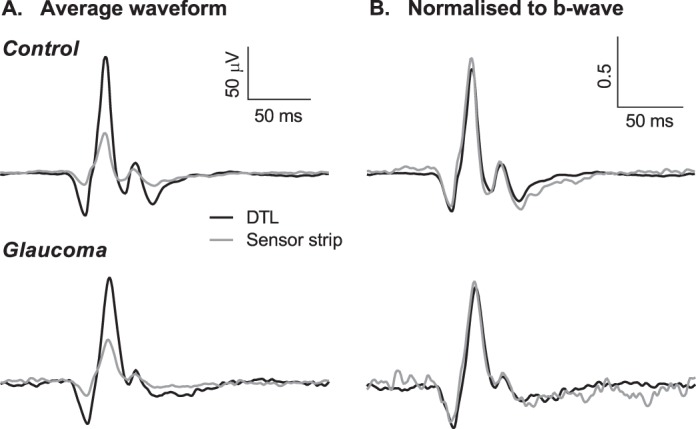
Average ERG waveforms in a control (top) and glaucoma (bottom) participant. (A) ERGs recorded with DTL (black) and sensor strip (gray) electrodes plotted on the same scale. (B) ERGs of both electrodes normalized to the respective b-wave amplitude.
Figure 2 compares the electrode differences in all participants (control and glaucoma) for the PhNR amplitude (Fig. 2A), PhNR implicit time (Fig. 2B), PhNR/b-wave ratio (Fig. 2C), and SNR (Fig. 2D). The sensor strip-recorded PhNR (4.8 ± 2.1 μV) was approximately one-third of the size of those recorded with DTLs (12.7 ± 4.8 μV) and was significantly different (P < 0.0001). The PhNR implicit times were similar (Fig. 2B, P = 0.24) and while there was a trend for the sensor strip recorded PhNR/b-wave ratio to be larger, this fell just short of statistical significance (Fig. 2C, P = 0.06). The SNR (Fig. 2D) was significantly larger with the DTL electrode (8.9 ± 3.9) compared with the sensor strip (5.5 ± 2.1, P < 0.0001). The amplitude and implicit time for the a-wave and b-wave are shown in Table 2 and were significantly smaller and faster for the sensor strip electrodes than DTL electrodes.
Figure 2.

Comparison of PhNR parameters recorded with DTL and sensor strip electrode in control (black circles) and glaucoma/glaucoma suspect (open triangles) participants (A) PhNR amplitude; (B) implicit time; (C) PhNR/b-wave ratio; and (D) SNR. Line represents combined group mean, paired Student's t-test, ****P < 0.0001.
Table 2.
Amplitude and Implicit Time of ERG Parameters Recorded With DTL and Sensor Strip Electrodes in Combined Control and Glaucoma Participants

We further compared the relationship between SNR and increasing the number of sweeps (Fig. 3). The SNR for both electrodes improved as a function of the square root of the number of sweeps, although it remained significantly larger for the DTL across all sweeps. Extrapolating from the fitted square root function curves, approximately double the number of sweeps, and therefore, double the timing, was required for the sensor strip electrode to achieve the same SNR as the DTL electrode at 100 sweeps. While this may not be a problem if a single flash strength is used as in this study, it would lengthen the time of recording if several flash strengths are recorded as in a stimulus response function.33,34
Figure 3.
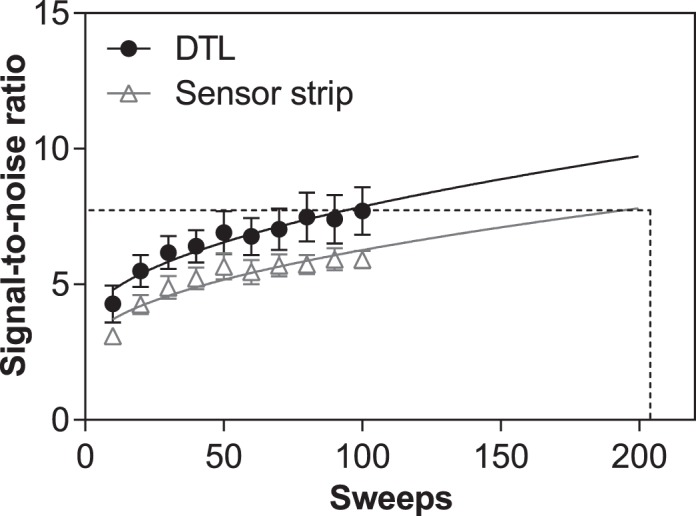
Relationship between SNR and the number of sweeps for the DTL (black circles) and sensor strip electrode (gray triangles). A square root function was fitted over the points for each electrode (solid lines) to illustrate increasing SNR with increasing number of sweeps. Dashed lines represent the number of sweeps required with sensor strip electrode to achieve equivalent SNR as DTL at 100 sweeps, determined by extrapolating from the square root function. Values are mean and standard error.
Glaucoma participants were divided into two groups based on their visual field MDs into early (defined as MD > −6 dB, n = 11) and advanced (MD ≤ −6 dB, n = 10), and compared with glaucoma suspects and age-matched controls (n = 14, mean age: 63 ± 9 years). There was a significant group difference for the PhNR amplitude (Figs. 4A, 4B) and ratio (Figs. 4E, 4F) recorded with both electrodes (one-way ANOVA, P < 0.05), although there was also significant overlap between glaucoma suspects and early glaucoma with control participants. No group difference was found for the implicit time with either electrodes (Figs. 4C, 4D).
Figure 4.
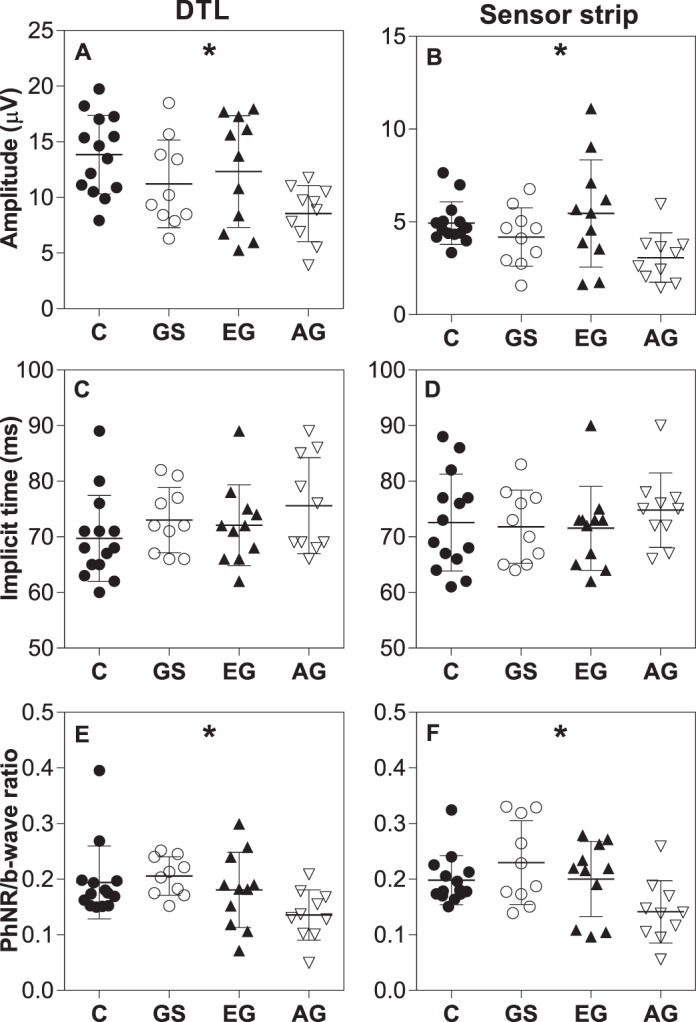
Comparison of PhNR amplitude (A, B), implicit time (C, D), and ratio (E, F) recorded using DTL (left) and sensor strip (right) between control (age-matched), glaucoma suspects, and glaucoma participants divided according to VF MD. C, control; GS, glaucoma suspect; EG, early glaucoma (defined as MD > −6 dB); AG, advanced glaucoma (defined as MD ≤ −6 dB). Values are mean and SD. One-way ANOVA performed; *P < 0.05.
To better assess the relationship between PhNR parameters and glaucoma disease severity, the correlation with MLS was evaluated in glaucoma suspect and glaucoma participants (Fig. 5). The reduction in PhNR amplitude recorded using DTL electrodes correlated significantly with the decrease in MLS (Fig. 5A, r = 0.43, P = 0.02). This trend was also seen with the sensor strip but did not reach statistical significance (Fig. 5B). The PhNR implicit time significantly increased with increasing disease severity (Figs. 5C, 5D) for both electrodes with similar correlation coefficients (r = −0.42, P = 0.02 for DTL and r = −0.42, P = 0.02 for sensor strip). When the PhNR was normalized to the b-wave, both electrodes demonstrated an increase in correlation with MLS, suggesting the ratio may be a more useful measure (Figs. 5E, 5F). There was no significant correlation between a- or b-wave amplitude and a-wave implicit time with MLS (see Supplementary Figs. S1A–F). A negative correlation was found for the b-wave implicit time, which was significant for the DTL (r = −0.43, P = 0.02) but fell short of significance for the sensor strip electrode (r = −0.33, P = 0.07, Supplementary Figs. S1G, S1H).
Figure 5.
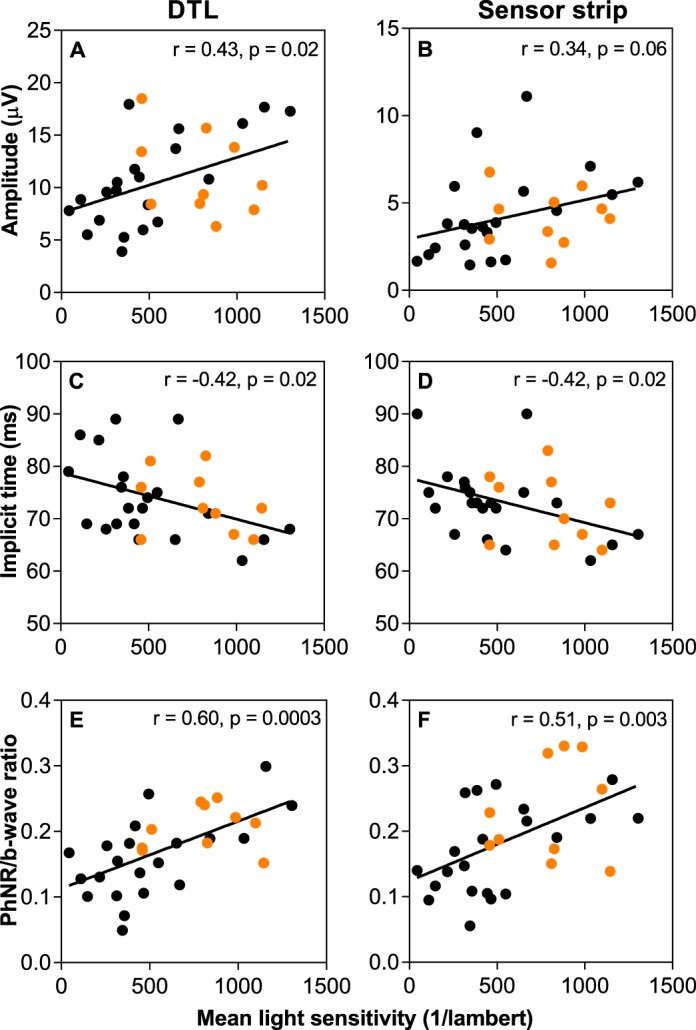
Correlation between mean light sensitivity and PhNR amplitude (A, B), implicit time (C, D), and ratio (E, F) against mean light sensitivity for the DTL (left) and sensor strip (right) electrode in glaucoma (black circles) and glaucoma suspect (orange circles) participants.
Finally, test-retest repeatability was assessed in 18 healthy volunteers. The COR% were comparable between electrodes for the PhNR amplitude at ±27% and ±28% for the DTL and sensor strip, respectively (Fig. 6). When normalized to the b-wave, the COR% improved significantly for the sensor strip electrode but remained the same as the amplitude measure for the DTL electrode (Table 2).
Figure 6.

Test-retest repeatability of the PhNR amplitude in control participants. Correlation between test-retest measures and Bland Altman plots for (A, C) DTL and (B, D) sensor strip electrodes.
Discussion
The purpose of this study was to determine whether the sensor strip-recorded PhNR was comparable to those obtained with DTL electrodes when using the RETeval device.
Skin electrodes are commonly used in the pediatric population35–37 and have been shown to be effective for pattern electroretinogram (PERG) recordings using the “PERGLA” protocol.38,39 Recent studies have found skin electrodes to be a viable alternative for recording the PhNR in healthy controls16 and in glaucoma participants.40 As with other types of skin electrodes, however, the ERG parameters recorded with the sensor strips were approximately 30% to 35% the size of DTLs.16,36,37,41 We also noted shorter implicit times for the a- and b-wave, which has been previously reported with other skin electrodes.36 Interestingly, however, this did not apply for the PhNR, where there was a trend for longer implicit times for the sensor strips. While we do not have clear explanation for this, it may be related to the orientation of RGCs and their axons in the retina. Further, while the waveforms were similar when normalized to the b-wave, there was a trend for the ratio to be slightly larger with the sensor strip electrode. This suggests that while normalization reduced the differences between the two electrodes, they may not be completely interchangeable.
The sensor strip electrodes were well-tolerated and easier to apply than DTL electrodes. Due to their position, the sensor strip electrodes were also less influenced by blink and lid twitches,42 unlike the DTL electrodes where data from three participants were excluded due to artefacts. Despite this, the larger ERG amplitudes and better SNR with DTL electrodes may be important in cases of reduced amplitudes, such as in advanced glaucoma or detection of small response changes.
The ISCEV standard for full-field clinical electroretinography suggests that skin electrodes may not be appropriate in disease states with attenuated signals.28 However, this may not be a problem if a high SNR is achieved to enable differentiation across disease severity.38,39 Consistent with previous studies, we observed a significant group difference for the PhNR amplitude and ratio with both electrodes.4,6–8,43,44 We also found a modest positive correlation between DTL-recorded PhNR amplitude with visual field MLS. The sensor strip showed a similar trend, although this fell short of statistical significance, which was likely due to the small sample size and poorer SNR. Nevertheless, when normalized to the b-wave, both electrodes showed an improved correlation with MLS, suggesting the sensor strip electrode may be appropriate for recording across a range of glaucoma severity. Further, we observed a negative correlation between MLS and implicit time, which has been suggested in previous studies for the PhNR44,45 and b-wave.2,46 The effect on the b-wave is interesting, as there is evidence in animal models that third-order neurons, namely amacrine and ganglion cells, can contribute to the b-wave response.47,48 In humans, the effect of glaucoma on the b-wave is conflicting, with some studies finding a reduction in amplitude,5,49 while others not observing a difference.2,3 Thus, the increase in b-wave implicit time with glaucoma severity needs to be confirmed in a larger cohort. In addition, while several participants had advanced glaucoma, the sample size in this study was too small to examine specifically the PhNR measurement “floor” of the electrodes.
Similar to Mortlock et al.,16 we found a comparable PhNR intersession repeatability for both electrodes. However, the COR% reported for the PhNR amplitude in this study is a significant improvement compared with previous baseline measures of the PhNR.16,17 This may be explained by averaging a larger number of sweeps40 and adequate baseline detrending as we have demonstrated previously.18 In addition, the PhNR/b-wave ratio had significantly improved COR% for the sensor strip electrode. However, this did not occur for the DTL electrode, suggesting that factors contributing to the variability of DTL recordings, such as electrode placement and lid artefacts, could not be reduced by normalizing to the b-wave. However, a study limitation was that the electrode repeatability was not assessed in glaucoma participants. While we do not expect there to be differences between the electrodes, it is possible that recordings in glaucoma participants may be more variable compared with control participants.
In summary, sensor strip electrodes may provide a viable alternative to DTLs to recording the PhNR using the LKC RETeval device, particularly when normalized to the b-wave. Both electrode types have their advantages and disadvantages, and the choice depends on the application. Future studies are required to determine the measurement floor in advanced disease, and whether longitudinal changes related to disease progression or treatment can be detected using the sensor strip electrode.
Supplementary Material
Acknowledgments
Supported by grants from the Australian Government Research Training (RTP) Scholarship and the Jean Miller Foundation. The Centre for Eye Research Australia receives Operational Infrastructure Support from the Victorian Government.
Disclosure: J. Tang, None; F. Hui, None; X. Hadoux, None; M. Sarossy, None; P. van Wijngaarden, None; M. Coote, None; J.G. Crowston, None
References
- 1.Viswanathan S, Frishman LJ, Robson JG, Harwerth RS, Smith EL., III The photopic negative response of the macaque electroretinogram: reduction by experimental glaucoma. Invest Ophthalmol Vis Sci. 1999;40:1124–1136. [PubMed] [Google Scholar]
- 2.Colotto A, Falsini B, Salgarello T, Iarossi G, Galan ME, Scullica L. Photopic negative response of the human ERG: losses associated with glaucomatous damage. Invest Ophthalmol Vis Sci. 2000;41:2205–2211. [PubMed] [Google Scholar]
- 3.Viswanathan S, Frishman LJ, Robson JG, Walters JW. The photopic negative response of the flash electroretinogram in primary open angle glaucoma. Invest Ophthalmol Vis Sci. 2001;42:514–522. [PubMed] [Google Scholar]
- 4.Machida S, Gotoh Y, Toba Y, Ohtaki A, Kaneko M, Kurosaka D. Correlation between photopic negative response and retinal nerve fiber layer thickness and optic disc topography in glaucomatous eyes. Invest Ophthalmol Vis Sci. 2008;49:2201–2207. doi: 10.1167/iovs.07-0887. [DOI] [PubMed] [Google Scholar]
- 5.North RV, Jones AL, Drasdo N, Wild JM, Morgan JE. Electrophysiological evidence of early functional damage in glaucoma and ocular hypertension. Invest Ophthalmol Vis Sci. 2010;51:1216–1222. doi: 10.1167/iovs.09-3409. [DOI] [PubMed] [Google Scholar]
- 6.Preiser D, Lagreze WA, Bach M, Poloschek CM. Photopic negative response versus pattern electroretinogram in early glaucoma. Invest Ophthalmol Vis Sci. 2013;54:1182–1191. doi: 10.1167/iovs.12-11201. [DOI] [PubMed] [Google Scholar]
- 7.Kirkiewicz M, Lubinski W, Penkala K. Photopic negative response of full-field electroretinography in patients with different stages of glaucomatous optic neuropathy. Doc Ophthalmol. 2016;132:57–65. doi: 10.1007/s10633-016-9528-z. [DOI] [PMC free article] [PubMed] [Google Scholar]
- 8.Cvenkel B, Sustar M, Perovsek D. Ganglion cell loss in early glaucoma, as assessed by photopic negative response, pattern electroretinogram, and spectral-domain optical coherence tomography. Doc Ophthalmol. 2017;135:17–28. doi: 10.1007/s10633-017-9595-9. [DOI] [PubMed] [Google Scholar]
- 9.Gotoh Y, Machida S, Tazawa Y. Selective loss of the photopic negative response in patients with optic nerve atrophy. Arch Ophthalmol. 2004;122:341–346. doi: 10.1001/archopht.122.3.341. [DOI] [PubMed] [Google Scholar]
- 10.Machida S, Gotoh Y, Tanaka M, Tazawa Y. Predominant loss of the photopic negative response in central retinal artery occlusion. Am J Ophthalmol. 2004;137:938–940. doi: 10.1016/j.ajo.2003.10.023. [DOI] [PubMed] [Google Scholar]
- 11.Rangaswamy NV, Frishman LJ, Dorotheo EU, Schiffman JS, Bahrani HM, Tang RA. Photopic ERGs in patients with optic neuropathies: comparison with primate ERGs after pharmacologic blockade of inner retina. Invest Ophthalmol Vis Sci. 2004;45:3827–3837. doi: 10.1167/iovs.04-0458. [DOI] [PubMed] [Google Scholar]
- 12.Tamada K, Machida S, Yokoyama D, Kurosaka D. Photopic negative response of full-field and focal macular electroretinograms in patients with optic nerve atrophy. Jpn J Ophthalmol. 2009;53:608–614. doi: 10.1007/s10384-009-0731-2. [DOI] [PubMed] [Google Scholar]
- 13.Machida S. Clinical applications of the photopic negative response to optic nerve and retinal diseases. J Ophthalmol. 2012;2012:397178. doi: 10.1155/2012/397178. [DOI] [PMC free article] [PubMed] [Google Scholar]
- 14.Wang J, Cheng H, Hu YS, Tang RA, Frishman LJ. The photopic negative response of the flash electroretinogram in multiple sclerosis. Invest Ophthalmol Vis Sci. 2012;53:1315–1323. doi: 10.1167/iovs.11-8461. [DOI] [PMC free article] [PubMed] [Google Scholar]
- 15.Moss HE, Park JC, McAnany JJ. The photopic negative response in idiopathic intracranial hypertension. Invest Ophthalmol Vis Sci. 2015;56(6):3709–3714. doi: 10.1167/iovs.15-16586. [DOI] [PMC free article] [PubMed] [Google Scholar]
- 16.Mortlock KE, Binns AM, Aldebasi YH, North RV. Inter-subject, inter-ocular and inter-session repeatability of the photopic negative response of the electroretinogram recorded using DTL and skin electrodes. Doc Ophthalmol. 2010;121:123–134. doi: 10.1007/s10633-010-9239-9. [DOI] [PubMed] [Google Scholar]
- 17.Tang J, Edwards T, Crowston JG, Sarossy M. The test-retest reliability of the photopic negative response (PhNR) Transl Vis Sci Technol. 2014;3(6):1. doi: 10.1167/tvst.3.6.1. [DOI] [PMC free article] [PubMed] [Google Scholar]
- 18.Tang J, Hui F, Coote M, Crowston JG, Hadoux X. Baseline detrending for the photopic negative response. Transl Vis Sci Technol. 2018;7(5):9. doi: 10.1167/tvst.7.5.9. [DOI] [PMC free article] [PubMed] [Google Scholar]
- 19.Maa AY, Feuer WJ, Davis CQ, et al. A novel device for accurate and efficient testing for vision-threatening diabetic retinopathy. J Diabetes Complications. 2016;30:524–532. doi: 10.1016/j.jdiacomp.2015.12.005. [DOI] [PMC free article] [PubMed] [Google Scholar]
- 20.Fukuo M, Kondo M, Hirose A, et al. Screening for diabetic retinopathy using new mydriasis-free, full-field flicker ERG recording device. Sci Rep. 2016;6:36591. doi: 10.1038/srep36591. [DOI] [PMC free article] [PubMed] [Google Scholar]
- 21.Al-Otaibi H, Al-Otaibi MD, Khandekar R, et al. Validity, usefulness and cost of reteval system for diabetic retinopathy screening. Transl Vis Sci Technol. 2017;6(3):3. doi: 10.1167/tvst.6.3.3. [DOI] [PMC free article] [PubMed] [Google Scholar]
- 22.Wu Z, Hadoux X, Hui F, Sarossy MG, Crowston JG. Photopic negative response obtained using a handheld electroretinogram device: determining the optimal measure and repeatability. Transl Vis Sci Technol. 2016;5(4):8. doi: 10.1167/tvst.5.4.8. [DOI] [PMC free article] [PubMed] [Google Scholar]
- 23.RETevalTM Device User Manual. Gaithersburg, MD: LKC Technologies; 2014. [Google Scholar]
- 24.Kato K, Kondo M, Sugimoto M, Ikesugi K, Matsubara H. Effect of pupil size on flicker ergs recorded with reteval system: new mydriasis-free full-field ERG system. Invest Ophthalmol Vis Sci. 2015;56:3684–3690. doi: 10.1167/iovs.14-16349. [DOI] [PubMed] [Google Scholar]
- 25.RETevalTM Sensor Strips User Manual. Gaithersburg, MD: LKC Technologies; 2017. [Google Scholar]
- 26.Dawson WW, Trick GL, Litzkow CA. Improved electrode for electroretinography. Invest Ophthalmol Vis Sci. 1979;18:988–991. [PubMed] [Google Scholar]
- 27.Hui F, Tang J, Hadoux X, Coote M, Crowston JG. Optimizing a portable electroretinogram device for glaucoma clinic: the effect of inter-stimulus frequency on the photopic negative response. Transl Vis Sci Technol. 2018;7(5):9. doi: 10.1167/tvst.7.6.26. [DOI] [PMC free article] [PubMed] [Google Scholar]
- 28.McCulloch DL, Marmor MF, Brigell MG, et al. ISCEV Standard for full-field clinical electroretinography (2015 update) Doc Ophthalmol. 2015;130:1–12. doi: 10.1007/s10633-014-9473-7. [DOI] [PubMed] [Google Scholar]
- 29.Frishman L, Sustar M, Kremers J, et al. ISCEV extended protocol for the photopic negative response (PhNR) of the full-field electroretinogram. Doc Ophthalmol. 2018;136:207–211. doi: 10.1007/s10633-018-9638-x. [DOI] [PMC free article] [PubMed] [Google Scholar]
- 30.Gowrisankaran S, Genead MA, Anastasakis A, Alexander KR. Characteristics of late negative ERG responses elicited by sawtooth flicker. Doc Ophthalmol. 2013;126:9–19. doi: 10.1007/s10633-012-9352-z. [DOI] [PMC free article] [PubMed] [Google Scholar]
- 31.Garway-Heath DF, Holder GE, Fitzke FW, Hitchings RA. Relationship between electrophysiological, psychophysical, and anatomical measurements in glaucoma. Invest Ophthalmol Vis Sci. 2002;43:2213–2220. [PubMed] [Google Scholar]
- 32.Bland JM, Altman DG. Statistical methods for assessing agreement between two methods of clinical measurement. Lancet. 1986;1:307–310. [PubMed] [Google Scholar]
- 33.Binns AM, Mortlock KE, North RV. The relationship between stimulus intensity and response amplitude for the photopic negative response of the flash electroretinogram. Doc Ophthalmol. 2011;122:39–52. doi: 10.1007/s10633-010-9257-7. [DOI] [PubMed] [Google Scholar]
- 34.Joshi NR, Ly E, Viswanathan S. Intensity response function of the photopic negative response (PhNR): effect of age and test-retest reliability. Doc Ophthalmol. 2017;135:1–16. doi: 10.1007/s10633-017-9591-0. [DOI] [PMC free article] [PubMed] [Google Scholar]
- 35.Bradshaw K, Hansen R, Fulton A. Comparison of ERGs recorded with skin and corneal-contact electrodes in normal children and adults. Doc Ophthalmol. 2004;109:43–55. doi: 10.1007/s10633-004-1751-3. [DOI] [PubMed] [Google Scholar]
- 36.Coupland SG, Janaky M. ERG electrode in pediatric patients: comparison of DTL fiber, PVA-gel, and non-corneal skin electrodes. Doc Ophthalmol. 1989;71:427–433. doi: 10.1007/BF00152771. [DOI] [PubMed] [Google Scholar]
- 37.Kriss A. Skin ERGs: their effectiveness in paediatric visual assessment, confounding factors, and comparison with ERGs recorded using various types of corneal electrode. Int J Psychophysiol. 1994;16:137–146. doi: 10.1016/0167-8760(89)90040-8. [DOI] [PubMed] [Google Scholar]
- 38.Porciatti V, Ventura LM. Normative data for a user-friendly paradigm for pattern electroretinogram recording. Ophthalmology. 2004;111:161–168. doi: 10.1016/j.ophtha.2003.04.007. [DOI] [PMC free article] [PubMed] [Google Scholar]
- 39.Bach M, Ramharter-Sereinig A. Pattern electroretinogram to detect glaucoma: comparing the PERGLA and the PERG Ratio protocols. Doc Ophthalmol. 2013;127:227–238. doi: 10.1007/s10633-013-9412-z. [DOI] [PubMed] [Google Scholar]
- 40.Wu Z, Hadoux X, Fan Gaskin JC, Sarossy MG, Crowston JG. Measuring the photopic negative response: viability of skin electrodes and variability across disease severities in glaucoma. Transl Vis Sci Technol. 2016;5(2):13. doi: 10.1167/tvst.5.2.13. [DOI] [PMC free article] [PubMed] [Google Scholar]
- 41.Esakowitz L, Kriss A, Shawkat F. A comparison of flash electroretinograms recorded from Burian Allen, JET, C-glide, gold foil, DTL and skin electrodes. Eye (Lond) 1993;7(Pt 1):169–171. doi: 10.1038/eye.1993.36. [DOI] [PubMed] [Google Scholar]
- 42.Hennessy MP. Vaegan. Amplitude scaling relationships of Burian-Allen, gold foil and Dawson, Trick and Litzkow electrodes. Doc Ophthalmol. 1995;89:235–248. doi: 10.1007/BF01203377. [DOI] [PubMed] [Google Scholar]
- 43.Machida S, Tamada K, Oikawa T, et al. Comparison of photopic negative response of full-field and focal electroretinograms in detecting glaucomatous eyes. J Ophthalmol. 2011. 2011. [DOI] [PMC free article] [PubMed]
- 44.Huang L, Shen X, Fan N, He J. Clinical application of photopic negative response of the flash electroretinogram in primary open-angle glaucoma. Eye Sci. 2012;27:113–118. doi: 10.3969/j.issn.1000-4432.2012.03.001. [DOI] [PubMed] [Google Scholar]
- 45.Kim HD, Park JY, Ohn YH. Clinical applications of photopic negative response (PhNR) for the treatment of glaucoma and diabetic retinopathy. Korean J Ophthalmol. 2010;24:89–95. doi: 10.3341/kjo.2010.24.2.89. [DOI] [PMC free article] [PubMed] [Google Scholar]
- 46.Wakili N, Horn FK, Junemann AG, et al. The photopic negative response of the blue-on-yellow flash-electroretinogram in glaucomas and normal subjects. Doc Ophthalmol. 2008;117:147–154. doi: 10.1007/s10633-008-9116-y. [DOI] [PubMed] [Google Scholar]
- 47.Dong CJ, Hare WA. Contribution to the kinetics and amplitude of the electroretinogram b-wave by third-order retinal neurons in the rabbit retina. Vision Res. 2000;40:579–589. doi: 10.1016/s0042-6989(99)00203-5. [DOI] [PubMed] [Google Scholar]
- 48.Awatramani G, Wang J, Slaughter MM. Amacrine and ganglion cell contributions to the electroretinogram in amphibian retina. Vis Neurosci. 2001;18:147–156. doi: 10.1017/s0952523801181149. [DOI] [PubMed] [Google Scholar]
- 49.Sustar M, Cvenkel B, Brecelj J. The effect of broadband and monochromatic stimuli on the photopic negative response of the electroretinogram in normal subjects and in open-angle glaucoma patients. Doc Ophthalmol. 2009;118:167–177. doi: 10.1007/s10633-008-9150-9. [DOI] [PubMed] [Google Scholar]
Associated Data
This section collects any data citations, data availability statements, or supplementary materials included in this article.


