

Abstract
SEC2, a major histocompatibility complex class II (MHC II)-dependent T-cell mitogen, binds MHC II and T-cell receptor (TCR) Vβs to induce effective co-stimulating signals for clonal T-cell expansion. We previously characterized a SEC2 mutant with increased recognition of TCR Vβs, ST-4, which could intensify NF-κB signaling transduction, leading to IL-2 production and T-cell activation. In this study, we found that in contrast to SEC2, ST-4 could induce murine CD4+ T-cell proliferation in a Vβ8.2- and Vβ8.3-specific manner in the absence of MHC II+ antigen-presenting cells (APCs). Furthermore, although IL-2 secretion in response to either SEC2 or ST-4 stimulation was accompanied by up-regulation of protein kinase Cθ (PKCθ), inhibitor of κB (IκB), α and β IκB kinase (IKKα/β), IκBα, and NF-κB in mouse splenocytes, only ST-4 could activate CD4+ T cells in the absence of MHC II+ APCs through the PKCθ/NF-κB signaling pathway. The PKCθ inhibitor AEB071 significantly suppressed SEC2/ST-4–induced T-cell proliferation, CD69 and CD25 expression, and IL-2 secretion with or without MHC II+ APCs. Further, SEC2/ST-4–induced changes in PKCθ/NF-κB signaling were significantly relieved by AEB071 in a dose-dependent manner. Using Lck siRNA, we found that Lck controlled SEC2/ST-4–induced phosphorylation of PKCθ. We also demonstrated that the IL-2R/STAT5 pathway is essential for SEC2/ST-4–induced T-cell activation. Collectively, our data demonstrate that an enhanced ST-4–TCR interaction can compensate for lack of MHC II and stimulate MHC II–free CD4+ T-cell proliferation via PKCθ/NF-κB and IL-2R/STAT5 signaling pathways. Compared with SEC2, intensified PKCθ/NF-κB and IL-2R/STAT5 signals induced by ST-4 lead to enhanced T-cell activation. The results of this study will facilitate better understanding of TCR-based immunotherapies for cancer.
Keywords: interleukin, NF-κB (NF-KB), STAT transcription factor, signaling, signal transduction, IL-2, staphylococcal enterotoxin C2, superantigen, T-cell receptor, T-cell activation
Introduction
As members of the superantigen family, staphylococcal enterotoxins (SEs)3 secreted by Gram-positive bacteria Staphylococcus aureus (1) can directly engage as intact molecules to outside the peptide groove of major histocompatibility complex class II (MHC II) on antigen-presenting cells (APCs) and specific Vβ regions of T-cell receptors (TCRs), resulting in hyperactivation of T lymphocytes. In this manner, activated T cells can release excessive quantities of proinflammatory cytokines and drive potent immunological responses (2). During this process, MHC II on APCs seems to be important for T-cell activation induced by SEs. However, many studies have shown that some types of SEs could directly activate T cells in the absence of MHC II. Lando et al. (3) and Newton et al. (4) demonstrated that SEA-Fab fusion protein conferred the ability to activate human T cells in a Vβ-specific manner with the presence or absence of MHC II molecules. Lamphear et al. (5) reported that enhanced SEC1-TCR–binding affinity could compensate for a lack of MHC II with regard to stimulating T-cell proliferation in an MHC II–independent manner. Together, these data strongly suggest that increased affinity between SEs and TCR Vβ can trigger MHC II–independent T-cell activation. However, the molecular signaling transduction mechanism has not been fully addressed.
Upon SE stimulation, TCR–CD3 complexes accumulate to form TCR microclusters (MCs), including TCR, kinases, and T cell–specific adaptor proteins at the center of the immunological synapse (6, 7). T cell–specific adaptor proteins regulate lymphocyte-specific tyrosine kinase (Lck) activity through physical interaction with Lck Src-homology 2 and 3 domains (8). Activated Lck acts as an intermediate molecule to interact with the cytoplasmic tail of CD28 and phosphorylate protein kinase Cθ (PKCθ), a novel Ca2+-independent PKC isoform (9, 10). PKCθ is the only PKC isoform recruited to TCR MCs (11). In addition, PKCθ positively regulates the early activation marker CD69 in T cells and activates the downstream of α and β inhibitor of κB (IκB) kinase (IKK) isoforms (12, 13). IKKα/β phosphorylates the IκBα molecule and releases it from p50 and p65 of nuclear factor κ-light-chain-enhancer of activated B cells (NF-κB/p65). Furthermore, NF-κB rapidly translocates into the nucleus, where it engages the promoter region of the interleukin-2 (IL-2) gene, leading to IL-2 secretion (14, 15). Finally, IL-2 drives T-cell proliferation and survival through the IL-2 receptor α chain (IL-2Rα/CD25)/signal transducer and activator of transcription 5 (STAT5) pathway (16).
As a type of MHC II-dependent mitogen (5), staphylococcal enterotoxin C2 (SEC2) has been applied in clinical trials as an effective tumor immunotherapeutic agent in China (17). To enhance anti-tumor activity, the SEC2-TCR enhanced mutant ST-4 was constructed in our laboratory (18). Previous studies have shown that compared with SEC2, ST-4 not only induces activation of murine Vβ8+ T lymphocytes, but also increases secretion of the cytokine IL-2 through the classical NF-κB signaling pathway (19). However, it is unclear whether ST-4 can bypass the classical MHC II–SEs–TCR binding mechanism to activate T cells in a MHC II–independent manner. To better understand the underlying mechanism, we first obtained MHC II-free CD4+ T cells using a labeled magnetic bead method. We investigated the importance of the PKCθ/NF-κB signaling pathway in ST-4–induced T-cell activation and compared this response with SEC2. Next, we chose the PKCθ inhibitor AEB071 and Lck siRNA to investigate the effects of PKCθ activity and phosphorylation, respectively, on ST-4–induced T-cell activation in a MHC II–independent manner. Finally, we used an anti-IL-2 neutralizing antibody to analyze the role of IL-2R/STAT5 signaling in the process of SEC2/ST-4–stimulated T-cell activation.
Herein, we present genetic data indicating that PKCθ acts downstream of the NF-κB pathway, leading to IL-2 transcription in SEC2/ST-4–induced T-cell activation. Furthermore, we showed that Lck is required for the phosphorylation of PKCθ. Compared with SEC2, ST-4 enhanced TCR Vβ–binding affinity and induced intensified splenocyte activation through the PKCθ/NF-κB and IL-2R/STAT5 signaling pathways. Meanwhile, without MHC II+ APCs, only ST-4, and not its closely similar homolog WT SEC2, can stimulate CD4+ T-cell proliferation via the essential PKCθ/NF-κB and IL-2R/STAT5 signaling pathways.
Results
Analysis of SEC2/ST-4–stimulated splenocyte/CD4+ T-cell proliferation
To investigate whether ST-4 could induce T-cell proliferation in the absence of MHC II molecules, murine splenocytes and CD4+ T cells were stimulated with different concentrations of SEC2 or ST-4 for 72 h. Next, proliferation was analyzed by an MTS assay. As shown in Fig. 1A, SEC2 and ST-4 significantly induced splenocyte proliferation in a dose-dependent manner in the presence of MHC II molecules. At each indicated concentration, the stimulatory activity of ST-4 was significantly higher than that of SEC2 (p < 0.05). As shown in Fig. 1B, SEC2 could not stimulate T-cell proliferation in the absence of MHC II. However, ST-4 could significantly stimulate CD4+ T-cell proliferation at the indicated concentrations. At a concentration of 5000 ng/ml, ST-4–stimulated proliferation was significantly stronger than that induced by SEC2 in the presence or absence of MHC II molecules.
Figure 1.

Analysis of splenocytes/CD4+ T cell proliferation. Proliferation of murine splenocytes (A)/CD4+ T cells (B) was determined by an MTS assay after incubation for 72 h with SEC2 or ST-4 at concentrations of 100, 1000, 5000, and 10,000 ng/ml. Untreated splenocytes/CD4+ T cells served as a negative control. Each value indicates the mean ± S.D. (error bars) of results obtained from three independent experiments. *, p < 0.05.
SEC2/ST-4 induced a change in TCR Vβ gene expression in murine CD4+ T cells
SEs selectively activate particular TCR Vβ chains. TCRs are thought to play an important role in triggering specific T-cell proliferation. Our previous study showed that both SEC2 and ST-4 could induce significant expression of Vβ8.2 and Vβ8.3 in murine splenocytes, although ST-4 was more potent than SEC2 (18). In this study, we investigated the relative expression of TCR Vβ chains stimulated by SEC2 and ST-4 in the absence of MHC II. As shown in Fig. 2, SEC2 elicited no changes in the amplification levels of TCR Vβ. However, amplification levels of both Vβ8.2 and Vβ8.3 were significantly higher when stimulated by ST-4 compared with SEC2 (p < 0.05). These results support the prediction that enhanced affinity between SEs and TCR Vβ can trigger MHC II–independent T-cell activation.
Figure 2.
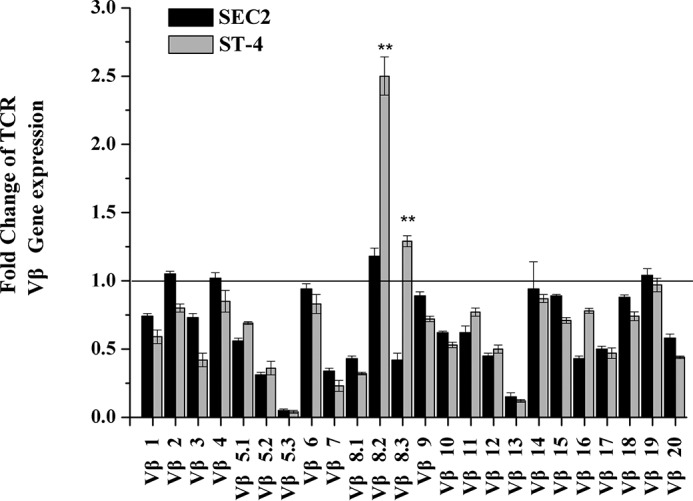
SEC2/ST-4 induces changes in TCR Vβ gene transcription in purified murine CD4+ T cells. Total RNA was collected, and the transcription levels of Vβ were identified by qRT-PCR, as described under “Experimental procedures,” after CD4+ T cells had been stimulated with 5000 ng/ml SEC2/ST-4 for 72 h. Each value indicates the mean ± S.D. (error bars) of results obtained from three independent experiments. **, p < 0.01.
SEC2/ST-4 stimulation enhanced PKCθ-induced NF-κB activation and IL-2 secretion
Our previous study suggested that the NF-κB signaling pathway is essential for SEC2/ST-4–induced splenocyte activation by induction of IL-2 secretion (19). Among several PKC isoforms, PKCθ is essential for T-cell activation. Accordingly, we tested whether SEC2/ST-4–stimulated NF-κB activation and IL-2 secretion were related to PKCθ signaling. As shown in Fig. 3A, SEC2/ST-4 significantly induced splenocytes to produce IL-2 in a time-dependent manner. Furthermore, as shown in Fig. 3 (B–F), SEC2/ST-4 stimulated expression of PKCθ, IKKα/β, IκBα, and p65 at protein levels, consistent with the trend for IL-2 synthesis. In addition, ST-4–induced activation of PKCθ/NF-κB and IL-2 secretion was significantly higher than that induced by SEC2 (p < 0.05). These results suggested that the PKCθ/NF-κB signaling pathway plays an important role in SEC2/ST-4–induced IL-2 secretion.
Figure 3.

IL-2 and PKCθ/NF-κB signal molecules were up-regulated by SEC2/ST-4 in murine splenocytes. A, splenocytes were stimulated with 5000 ng/ml SEC2/ST-4. After incubation for the indicated time, culture supernatants were harvested and used for measurement of IL-2 by ELISA. B–F, splenocytes were stimulated with 5000 ng/ml SEC2/ST-4. After incubation for indicated time, total cellular proteins were collected, and PKCθ, IKKα/β, IκBα, and NF-κB/p65 were detected by Western blot analysis. Untreated splenocytes served as a negative control. Each value indicates the mean ± S.D. (error bars) of results obtained from three independent experiments. *, p < 0.05.
Inhibited PKCθ/NF-κB signaling reduced SEC2/ST-4–induced splenocyte/CD4+ T-cell proliferation
In this study, the PKCθ inhibitor AEB071 was used to assess the role of the PKCθ/NF-κB signaling pathway in SEC2/ST-4–stimulated splenocyte/CD4+ T-cell proliferation. As shown in Fig. 4A, in the presence of MHC II, both SEC2 and ST-4 significantly stimulated splenocyte proliferation. Moreover, ST-4 induced higher percentage divided values compared with SEC2. The percentage divided value is the percentage of cells of the original sample that divided (assuming that no cells died during the culture). The increased percentage divided values induced by SEC2/ST-4 were significantly reduced by AEB071 in a dose-dependent manner, as indicated in Table 1. In addition, at equivalent concentrations of AEB071, percentage divided values of ST-4–treated splenocytes were significantly higher than that of SEC2-treated cells. However, in the absence of MHC II, as shown in Fig. 4B, ST-4 could significantly stimulate CD4+ T-cell proliferation. The percentage divided values induced by ST-4 were significantly reduced by treatment with AEB071 in a dose-dependent manner, as indicated in Table 1. However, SEC2 could not stimulate CD4+ T-cell proliferation. These results demonstrated the involvement of the PKCθ/NF-κB signaling pathway in SEC2/ST-4–induced splenocyte/CD4+ T-cell proliferation.
Figure 4.

AEB071 inhibits SEC2/ST-4-induced splenocyte/CD4+ T-cell proliferation in vitro. CFSE-labeled splenocytes (A) and CD4+ T cells (B) were cultured and preincubated with AEB071 for 30 min at the indicated concentrations. Cells were subsequently stimulated with SEC2 or ST-4 at a final concentration of 5000 ng/ml. Untreated splenocytes/CD4+ T cells served as a negative control. After 72 h, cells were harvested and analyzed by flow cytometry. Data are representative of three independent experiments.
Table 1.
SEC2/ST-4–induced splenocyte/CD4+ T cell proliferation is inhibited in vitro by AEB071
Capital letters indicate significant differences (p < 0.05) between treatments within each column. For the control columns, this includes untreated (respective control) versus SEC2-treated splenocytes, control versus ST-4–treated splenocytes/CD4+ T cells, SEC2-treated versus ST-4–treated splenocytes, and SEC2-treated versus ST-4–treated CD4+ T cells. For each inhibitor concentration, this includes SEC2-treated versus ST-4–treated splenocytes and SEC2-treated versus ST-4–treated CD4+ T cells. Lowercase letters indicate significant differences (p < 0.05) between treatments within each row. For SEC2– and ST-4–treated splenocytes/CD4+ T cells, this includes respective control versus AEB071 (1.0 μm and 0.1 μm) as well as 1.0 μm versus 0.1 μm AEB071.
| Treatment groups | Control | AEB071 |
Treatment groups | Control | AEB071 |
||
|---|---|---|---|---|---|---|---|
| 1.0 μm | 0.1 μm | 1.0 μm | 0.1 μm | ||||
| Splenocytes | 1.42 ± 0.08 A | CD4+ T cells | 0.94 ± 0.06 A | ||||
| Splenocytes + SEC2 | 9.05 ± 0.14 Ba | 0.96 ± 0.09 Bb | 2.98 ± 0.12 Bc | CD4 + T cells + SEC2 | 1.06 ± 0.03 Aa | 0.90 ± 0.04 Ba | 1.02 ± 0.03 Ba |
| Splenocytes + ST-4 | 25.3 ± 0.46 Ca | 2.22 ± 0.18 Cb | 15.4 ± 2.01 Cc | CD4 + T cells + ST-4 | 13.4 ± 0.08 Ba | 0.88 ± 0.05 Bb | 5.11 ± 0.16 Cc |
Inhibited PKCθ/NF-κB signaling reduced SEC2/ST-4–induced splenocyte/CD4+ T-cell phenotypes
In this study, AEB071 was chosen to investigate the potential role of the PKCθ/NF-κB signaling pathway during SEC2/ST-4–stimulated expression of early (CD69) and late (CD25) markers of T-cell activation. As shown in Fig. 5 (A and B) and Tables 2 and 3, at a final concentration of 5000 ng/ml, both SEC2 and ST-4 could significantly increase the percentage of CD69- and CD25-positive events (p < 0.05) in the presence of MHC II. Moreover, ST-4 stimulated a higher percentage of CD69- and CD25-positive events (25.4 ± 0.18 and 36.9 ± 0.72, respectively) compared with SEC2 (19.3 ± 0.07 and 15.3 ± 1.70, respectively) (p < 0.05). However, in the absence of MHC II, SEC2 could not induce increased percentages of CD69-positive events in CD4+ T cells. Thus, ST-4 induced a higher percentage of CD69- and CD25-positive events compared with SEC2 in the absence of MHC II (Fig. 5, C and D). Percentages of CD69- and CD25- positive events induced by SEC2/ST-4 were significantly decreased by treatment with AEB071 in a dose-dependent manner (Tables 2 and 3, p < 0.05). These results demonstrate the importance of the PKCθ/NF-κB signaling pathway in SEC2/ST-4–stimulated expression of CD69 and CD25 on T-cell activation.
Figure 5.

AEB071 or anti-IL-2 antibody inhibits CD69 and CD25 expression in SEC2/ST-4–stimulated splenocytes/CD4+ T cells in vitro. Splenocytes (A and B) and CD4+ T cells (C and D) were cultured and preincubated with AEB071 at the indicated concentrations or anti-IL-2 antibody (10 μg/ml) for 30 min. Cells were subsequently stimulated with SEC2 or ST-4 at a final concentration of 5000 ng/ml. Untreated splenocytes/CD4+ T cells served as a negative control. After 72 h, cells were stained with PE-conjugated anti-CD69 or anti-CD25 antibody and APC-conjugated anti-CD3 antibody. Cells were analyzed by flow cytometry. Dot plots of total events are shown with frequencies of cells in each quadrant. Data are representative of three independent experiments.
Table 2.
CD69 expression in SEC2/ST-4–stimulated splenocytes/CD4+ T cells is inhibited in vitro by AEB071
Capital letters indicate significant differences (p < 0.05) between treatments within each column. For the control column, this includes untreated (respective control) versus SEC2-treated splenocytes, control versus ST-4–treated splenocytes/CD4+ T cells, SEC2-treated versus ST-4–treated splenocytes, and SEC2-treated versus ST-4–treated CD4+ T cells. For each inhibitor concentration, this includes SEC2-treated versus ST-4–treated splenocytes and SEC2-treated versus ST-4–treated CD4+ T cells. Lowercase letters indicate significant differences (p < 0.05) between treatments within each row. For SEC2– and ST-4–treated splenocytes, this includes respective control versus AEB071 (1.0 μm and 0.1 μm) as well as 1.0 μm versus 0.1 μm AEB071.
| Treatment groups | Control | AEB071 |
Treatment groups | Control | AEB071 |
||
|---|---|---|---|---|---|---|---|
| 1.0 μm | 0.1 μm | 1.0 μm | 0.1 μm | ||||
| Splenocytes | 2.53 ± 0.12 A | CD4+ T cells | 3.12 ± 0.23 A | ||||
| Splenocytes + SEC2 | 19.3 ± 0.07 Ba | 2.97 ± 0.15 Bb | 9.43 ± 0.18 Bc | CD4 + T cells + SEC2 | 3.28 ± 0.33 Aa | 3.06 ± 0.04 Ba | 3.10 ± 0.18 Ba |
| Splenocytes + ST-4 | 25.4 ± 0.18 Ca | 5.34 ± 0.31 Cb | 18.4 ± 0.08 Cc | CD4 + T cells + ST-4 | 7.50 ± 0.20 Ba | 2.91 ± 0.12 Bb | 4.72 ± 0.23 Cc |
Table 3.
CD25 expression in SEC2/ST-4–stimulated splenocytes/CD4+ T cells is inhibited in vitro by AEB071
Capital letters indicate significant differences (p < 0.05) between treatments within each column. For the control column, this includes untreated (respective control) versus SEC2-treated splenocytes/CD4+ T cells, control versus ST-4–treated splenocytes/CD4+ T cells, SEC2-treated versus ST-4–treated splenocytes, and SEC2-treated versus ST-4–treated CD4+ T cells. For each inhibitor concentration, this includes SEC2-treated versus ST-4-treated splenocytes and SEC2-treated versus ST-4–treated CD4+ T cells. Lowercase letters indicate significant differences (p < 0.05) between treatments within each row. For SEC2- and ST-4–treated splenocytes/CD4+ T cells, this includes respective control versus AEB071 (1.0 μm and 0.1 μm) as well as 1.0 μm versus 0.1 μm AEB071.
| Treatment groups | Control | AEB071 |
Treatment groups | Control | AEB071 |
||
|---|---|---|---|---|---|---|---|
| 1.0 μm | 0.1 μm | 1.0 μm | 0.1 μm | ||||
| Splenocytes | 3.23 ± 0.28 A | CD4+ T cells | 5.51 ± 0.42 A | ||||
| Splenocytes + SEC2 | 15.3 ± 1.70 Ba | 3.33 ± 0.25 Bb | 6.68 ± 0.06 Bc | CD4 + T cells + SEC2 | 8.74 ± 0.19 Ba | 6.70 ± 0.11 Bb | 7.72 ± 0.15 Bc |
| Splenocytes + ST-4 | 36.9 ± 0.72 Ca | 3.28 ± 0.48 Bb | 11.3 ± 0.13 Cc | CD4 + T cells + ST-4 | 16.4 ± 0.85 Ca | 9.15 ± 0.42 Cb | 13.4 ± 2.10 Cc |
Inhibited PKCθ/NF-κB signaling reduced SEC2/ST-4–induced IL-2 secretion
SE-induced IL-2 secretion initiates the second wave of signaling events resulting in T-cell activation. As shown in Fig. 6A, in the presence of MHC II, both SEC2 and ST-4 could significantly stimulate murine splenocytes to produce large amounts of IL-2 (p < 0.05). Notably, ST-4 was more effective than SEC2 with regard to induction of IL-2 production (p < 0.05). Without providing MHC II+ APCs, only ST-4, but not SEC2, could stimulate CD4+ T cells to secrete IL-2 (Fig. 6B). Although SEC2/ST-4-induced IL-2 secretion could be effectively alleviated by AEB071 in a dose-dependent manner (p < 0.05) in the presence or absence of MHC II. These results indicate that the PKCθ/NF-κB signaling pathway is important for enhanced IL-2 production induced by ST-4 and results in MHC II–independent activation of CD4+ T cells by ST-4.
Figure 6.

AEB071 inhibits IL-2 secretion induced by SEC2/ST-4 in murine splenocytes/CD4+ T cells in vitro. Splenocytes (A) and CD4+ T cells (B) were cultured and preincubated with AEB071 for 30 min at the indicated concentrations. Cells were subsequently stimulated with SEC2 or ST-4 at a final concentration of 5000 ng/ml. Untreated splenocytes/CD4+ T cells served as a negative control. Splenocytes were incubated for 12 h, and CD4+ T cells were incubated for 48 h. Then cell culture supernatants were harvested and used for measurement of IL-2 by ELISA. Each value indicates the mean ± S.D. (error bars) of results obtained from three independent experiments. *, p < 0.05.
Importance of PKCθ signaling for SEC2/ST-4–induced NF-κB activation
As shown in Fig. 7, in the presence of MHC II, expression of PKCθ, IKKα/β, IκBα, and p65 induced by SEC2/ST-4 was significantly repressed by AEB071 in a dose-dependent manner (p < 0.05). Moreover, expression of these proteins in ST-4–treated groups was significantly higher than in SEC2-treated groups (p < 0.05). In the absence of MHC II, only ST-4, but not SEC2, could significantly activate PKCθ/NF-κB signaling in CD4+ T cells (Fig. 8). Meanwhile, at a final concentration of 1.0 μm, AEB071 almost completely blocked the up-regulation of PKCθ, IKKα/β, IκBα, and p65 induced by ST-4 in CD4+ T cells. These results further demonstrate that PKCθ signaling is essential for SEC2/ST-4–induced NF-κB activation; indeed, ST-4 intensified PKCθ/NF-κB signaling transduction, ultimately leading to enhanced T-cell activation in the absence of MHC II.
Figure 7.

AEB071 inhibits PKCθ, IKKα/β, IκBα, and NF-κB/p65 proteins expression during SEC2/ST-4–induced splenocyte activation. A, splenocytes were cultured and preincubated with AEB071 for 30 min at the indicated concentrations. Cells were subsequently stimulated with SEC2 or ST-4 at a final concentration of 5000 ng/ml. Untreated splenocytes served as a negative control. After 12 h, PKCθ, IKKα/β, IκBα, and NF-κB/p65 protein levels were detected by Western blot analysis. B–E, relative PKCθ, IKKα/β, IκBα, and NF-κB/p65 protein levels. Each value indicates the mean ± S.D. (error bars) of results obtained from three independent experiments. *, p < 0.05.
Figure 8.

AEB071 inhibits PKCθ, IKKα/β, IκBα, and NF-κB/p65 protein expression during SEC2/ST-4–induced purified CD4+ T-cell activation in the absence of MHC II. A, CD4+ T cells were cultured and preincubated with AEB071 for 30 min at the indicated concentrations. Cells were subsequently stimulated with SEC2 or ST-4 at a final concentration of 5000 ng/ml. Untreated CD4+ T cells served as a negative control. After 48 h, PKCθ, IKKα/β, IκBα, and NF-κB/p65 protein levels were detected by Western blot analysis. B–E, relative PKCθ, IKKα/β, IκBα, and NF-κB/p65 protein levels. Each value indicates the mean ± S.D. (error bars) of results obtained from three independent experiments. *, p < 0.05.
Lck is required for SEC2/ST-4–induced PKCθ phosphorylation
To investigate whether SEC2/ST-4–induced phosphorylation of PKCθ is associated with Lck, we first verified that both SEC2 and ST-4 could significantly up-regulate the levels of both phosphorylated Lck and PKCθ in the presence of MHC II (Fig. 9, A–C). Furthermore, ST-4 showed more effective potentials than SEC2 (p < 0.05). In addition, SEC2/ST-4–induced phosphorylation of Lck and PKCθ were significantly decreased by Lck-specific siRNA transfection, but not by nonspecific control siRNA (p < 0.05). Meanwhile, as shown in Fig. 9 (D–F), in the absence of MHC II, only ST-4, and not SEC2, could induce Lck and PKCθ activation in CD4+ T cells. Lck-specific siRNA also blocked the up-regulation of phospho-Lck and phospho-PKCθ induced by ST-4 in CD4+ T cells. These results demonstrate that SEC2/ST-4–induced Lck activation is important for phosphorylation of PKCθ, and ST-4 intensified Lck activation, ultimately leading to enhanced T-cell activation in the absence of MHC II.
Figure 9.

Transfection of Lck-specific siRNA down-regulates phospho-PKCθ protein expression during SEC2/ST-4-induced splenocyte/CD4+ T-cell activation. Splenocytes (A–C) and purified CD4+ T cells (D–F) were transfected with Lck siRNA or nonspecific control siRNA for 4 h. Next, cells were stimulated with SEC2 or ST-4 at a final concentration of 5000 ng/ml. Splenocytes were incubated for 12 h, and CD4+ T cells were incubated for 48 h. Then phospho-Lck and phospho-PKCθ protein levels were detected by Western blot analysis. B, C, E, and F, relative phospho-Lck and phospho-PKCθ protein levels. Each value indicates the mean ± S.D. (error bars) of results obtained from three independent experiments. *, p < 0.05 compared with the control of nonspecific control siRNA.
IL-2R/STAT5 signaling is important for SEC2/ST-4–induced splenocyte/CD4+ T-cell proliferation
It has been reported that IL-2 binding and signaling via IL-2R is required for T-cell activation (20). To investigate whether IL-2 and IL-2R signaling were required for SEC2/ST-4–induced splenocyte/CD4+ T-cell proliferation, we used an anti-IL-2 neutralizing antibody to block IL-2. As shown in Fig. 10 and Fig. 5B, consistent with results shown in Fig. 11 (A and B), SEC2 and ST-4 could stimulate murine splenocyte proliferation, IL-2R/CD25 expression, and IL-2R downstream protein STAT5 expression in the presence of MHC II. Furthermore, ST-4 showed more effective induction than SEC2 (p < 0.05). Meanwhile, as shown in Figs. 10 and 11 (C and D), in the absence of MHC II, only ST-4, and not SEC2, could induce proliferation and STAT5 expression in CD4+ T cells. In addition, ST-4 induced stronger CD25 expression than SEC2 (Fig. 5D). Furthermore, the anti-IL-2 neutralizing antibody could block SEC2/ST-4–induced IL-2R/STAT5 signaling activity in the presence or absence of MHC II molecules. Taken together, these results suggest that the effect of SEC2/ST-4–induced IL-2R/STAT5 signaling activity is important for splenocyte/CD4+ T-cell proliferation, and ST-4 intensified the IL-2R/STAT5 signaling transduction, ultimately leading to enhanced T-cell activation in the absence of MHC II.
Figure 10.

Anti-IL-2 antibody blockades SEC2/ST-4-induced splenocytes/CD4+ T-cell proliferation. Splenocytes/CD4+ T cells were labeled with CFSE and preincubated with anti-IL-2 antibody for 30 min at a final concentration of 10 μg/ml. Cells were subsequently stimulated with SEC2 or ST-4 at a final concentration of 5000 ng/ml. Untreated splenocytes/CD4+ T cells served as a negative control. After 72 h, cells were analyzed by flow cytometry. Data are representative of three independent experiments.
Figure 11.

Anti-IL-2 antibody inhibits STAT-5 protein expression during SEC2/ST-4–induced splenocytes/CD4+ T cell activation. Splenocytes (A and B) and purified CD4+ T cells (C and D) were preincubated with anti-IL-2 antibody for 30 min at a final concentration of 10 μg/ml. Cells were subsequently stimulated with SEC2 or ST-4 at a final concentration of 5000 ng/ml. Untreated splenocytes/CD4+ T cells served as a negative control. After 72 h, STAT5 protein was detected by Western blot analysis. B and D, relative STAT5 protein level. Each value indicates the mean ± S.D. (error bars) of results obtained from three independent experiments. *, p < 0.05.
Discussion
It is well-known that T-cell activation depends on two major signal transduction events. Upon recognition of MHC II+ APCs, the antigen-specific activation signal is induced at TCR MCs. TCR MCs and co-stimulation receptor CD28 initiate the first wave of signaling that regulates expression of cytokines such as IL-2 (21, 22). Then IL-2/IL-2R initiate the second wave of signaling, which activates diverse target genes to ultimately result in T-cell proliferation (16). Previous reports showed that SEs can activate particular Vβ-specific T cells through enhanced affinity to TCR and co-stimulation ligands in the presence or absence of MHC II molecules (3, 5, 23). IL-2 gene expression stimulated by SEs is regulated by TCR and CD28 signals (24). Recently, Kaempfer et al. (25, 26) revealed that the some types of SEs, such as SEB, must bind directly to CD28 to elicit inflammatory cytokines, even in the absence of MHC II molecules. These results indicated that SEs could directly engage TCR and co-stimulatory receptor CD28 to induce IL-2 secretion in the absence of MHC II molecules. In China, SEC2 has been employed as a drug in clinical trials for cancer treatments. To further improve the immunotherapy and antitumor activity of SEC2, a mutant SEC (ST-4) was constructed in our laboratory. In the presence of MHC II+ APCs, ST-4 can induce stronger splenocyte activation compared with SEC2 (19). Furthermore, we recently found that even in the absence of MHC II, ST-4 could still stimulate MHC II–free purified CD4+ T-cell activation in a dose-dependent manner. In contrast, SEC2 loses almost all of its superantigen activities without the aid of MHC II. A previous study found that both Vβ8.2 and Vβ8.3 subgroups in splenocytes were significantly up-regulated by both SEC2 and ST-4 in the presence of MHC II molecules. However, amplification levels of both Vβ8.2 and Vβ8.3 stimulated by ST-4 were significantly higher than induced by SEC2 (18). In this study, we showed that SEC2 could not induce expression of Vβ subgroups in purified CD4+ T cells in the absence of MHC II molecules. Moreover, expression of both TCR Vβ8.2 and Vβ8.3 subgroups in CD4+ T cells treated with ST-4 was significantly increased compared with those treated with SEC2, by 2.12- and 3.07-fold, respectively. These results suggested that the enhanced affinity between ST-4 and TCR Vβ8.2 and Vβ8.3 could trigger MHC II-independent T-cell activation. A simple relationship between the affinity of the SEs–TCR interaction and the immune response has been reported: stronger binding results in stronger T-cell responses (27, 28). As such, these results implied that compared with SEC2, ST-4 has more powerful TCR Vβ–binding affinity to elicit signaling capable of inducing more TCR Vβ subgroups than initially induced. Then TCR interacts with the CD28 co-stimulation signal to mediate stronger T-cell activation in the presence or absence of MHC II+ APCs.
The transcription factor NF-κB/p65 plays an essential role in TCR-mediated IL-2 production (29). Studies from our laboratory showed that SEC2/ST-4 could induce murine T-cell activation via the NF-κB/p65 signaling pathway (19). However, the detailed molecular signaling transduction mechanism remained unclear. In this study, we demonstrated that SEC2/ST-4 stimulated murine T cells to secrete IL-2. In addition, secretion of IL-2 was significantly increased by up-regulated expression of PKCθ, IKKα/β, IκBα, and p65. These results imply that the PKCθ/NF-κB signaling pathway plays an important role in SEC2/ST-4–induced secretion of IL-2. Moreover, this conclusion is further supported by previous reports suggesting that the PKCθ/NF-κB signal pathway integrates the TCR-CD28 signal required for IL-2 production and T-cell proliferation (30, 31).
PKCθ is essential for T-cell activation (32). We focused on PKCθ because it is the only PKC isoform that recruits to the immunological synapse among the PKC family (33). In addition, PKCθ is required for the activation of NF-κB, which regulates the production of IL-2 (34). Previous studies have shown that PKCθ can be effectively inhibited by AEB071, a specific inhibitor of the PKCθ/NF-κB signaling pathway (35). Our current study shows that SEC2/ST-4 could significantly induce proliferation, IL-2 secretion, and CD69 and CD25 expression in murine splenocytes. In addition, in the presence of MHC II, both SEC2 and ST-4 could significantly up-regulate expression of PKCθ, IKKα/β, IκBα, and p65. ST-4 exhibited enhanced efficiency for PKCθ/NF-κB pathway activation compared with SEC2. Furthermore, SEC2/ST-4–stimulated splenocyte activation, including proliferation and IL-2 secretion, were significantly inhibited by AEB071 in a dose-dependent manner. Notably, unlike SEC2, we observed that ST-4 could also induce purified CD4+ T cells to express CD69 and CD25, proliferate, and secrete IL-2 in an MHC II–independent manner. ST-4 could significantly up-regulate the phosphorylation and expression of PKCθ/NF-κB signaling proteins in purified CD4+ T cells. Moreover, these changes induced by ST-4 could be significantly relieved by AEB071 in a dose-dependent manner. These results suggest a central role for the PKCθ/NF-κB pathway in SEC2/ST-4–induced splenocyte activation. Moreover, ST-4 could stimulate purified CD4+ T-cell proliferation while bypassing the need for MHC II+ APCs via enhanced PKCθ/NF-κB signaling.
Lck, which belongs to the Src kinase family, is the major kinase to phosphorylate TCR in T cells (36). In addition, Lck is important in TCR-induced phosphorylation of PKCθ, which in turn modulates the activation of NF-κB (37). So far, little is known about SE-induced Lck activity after TCR signaling. Recently, several reports have shown that the superantigen SEE can activate T cells independent of Lck via the phospholipase Cβ signaling pathway (38, 39). But in our study, we found that ST-4 exhibited enhanced efficiency for Lck and PKCθ activation compared with SEC2. Furthermore, SEC2/ST-4–induced phosphorylation of Lck and PKCθ were significantly relieved by Lck-specific siRNA in murine splenocytes. In addition, in the absence of MHC II, only ST-4, but not SEC2, could induce activation of PKCθ, which is downstream of Lck. These findings suggest that SEC2/ST-4–induced phosphorylation of Lck plays a key role in regulatory function of phospho-PKCθ. ST-4 intensified Lck activation and, thus, enhances phospho-PKCθ, ultimately leading to T-cell activation in the absence of MHC II molecules.
A key event during T-cell activation is the IL-2 and IL-2R–induced second wave of signaling. A previous study showed that deprivation of IL-2 seriously impacts superantigen-reactive T-cell proliferation (40). STAT5, a member of the signal transducer and activator of transcription (STAT) family, mediates T-cell development and cytokine signaling. Nkajiama et al. (41) reported that lack of STAT5 inhibited CD25 expression, leading to a failure of T-cell proliferation. In this study, we found that SEC2/ST-4 could significantly up-regulate expression of CD25 and STAT5 in murine T cells. In addition, ST-4 exhibited stronger activation of IL-2R/STAT5 signaling compared with SEC2. And in the absence of MHC II, only ST-4, and not SEC2, could induce activation of STAT5 in purified CD4+ T cells. Furthermore, IL-2R/STAT5 up-regulated by SEC2/ST-4 could be blocked by an anti-IL-2 antibody. These results revealed that SEC2/ST-4–induced expression of CD25 and STAT5 was required for T-cell proliferation. ST-4 intensified the IL-2 secretion, CD25 expression, and STAT5 activation, which ultimately led to activation of T cells in the absence of MHC II molecules.
In summary, by applying the PKCθ inhibitor AEB071 and anti-IL-2 antibody, we demonstrated the important role of PKCθ/NF-κB and IL-2R/STAT5 signaling pathways in regulation of SEC2/ST-4–induced T-cell activation and proliferation. Our data also revealed that the SEC2-TCR–enhanced mutant ST-4 could induce purified CD4+ T-cell proliferation in an MHC II–independent manner and exhibited stronger activation compared with SEC2. These results could be attributed to intensified PKCθ/NF-κB and IL-2R/STAT5 signaling transduction. In addition, using Lck-specific siRNA, we demonstrated that Lck participates in SEC2/ST-4–induced phosphorylation of PKCθ (see schematic in Fig. 12). Results of this study will provide new insights for understanding the molecular mechanisms of SEs in T-cell activation.
Figure 12.
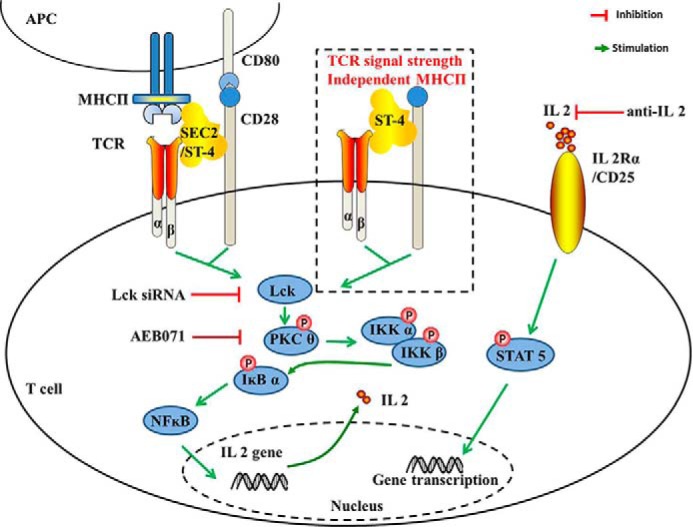
SEC2/ST-4 drives T lymphocyte activation through PKCθ/NF-κB and IL-2R/STAT5 signaling pathways with or without MHC II+ APCs.
Experimental procedures
Animals
Female WT BALB/c mice (4–8 weeks old) were purchased from Beijing Vital River Laboratory Animal Technology (Beijing, China). All mice were bred and housed in pathogen-free conditions with a barrier system (20–26 °C, relative humidity of 40–60%) with 12-h light/dark cycles and free access to autoclaved water and food. Experiments involving mice were approved by the institutional animal care committee.
Purification of MCH II–free CD4+ T cells
Spleens from BALB/c mice were minced through a nylon screen into medium to obtain splenocytes. CD4+ T cells were isolated from splenocytes by negative selection using labeled magnetic beads following the manufacturer's instructions (Miltenyi Biotec, GmbH). Purified CD4+ T cells were >97% pure, and MHC II+ cells were <1%, as assessed by cytometry.
Reagents and antibodies
Recombinant prototype SEC2 and its mutant ST-4 were expressed in Escherichia coli BL21 (DE3) strains, respectively, and purified as described previously (18, 42). Roswell Park Memorial Institute (RPMI)-1640 and fetal bovine serum (FBS) were purchased from Thermo Fisher Scientific (Hyclone, Waltham, MA). AEB071 was purchased from Selleck (Houston, TX). Anti-IL-2 antibody was purchased from eBioscience (San Diego, CA). Monoclonal CD3-APC, CD69-PE, and CD25-PE antibodies were purchased from Biolegend (San Diego, CA). The CellTiter 96® AQueous One Solution Cell Proliferation Assay (MTS) was purchased from Promega (Madison, WI). The carboxyfluorescein diacetate succinimidyl ester (CFSE) cell proliferation assay and tracking kit was purchased from Beyotime (Haimen, Jiangsu, China). An ELISA kit for mouse IL-2 was purchased from Abcam (Cambridge, UK). The SYBR Premix Ex TaqTM, Prime Script RT Master Kit and the RNA-extracting reagent RNAiso Plus were purchased from Takara Biotechnology (Dalian, China). siRNA sequences for mouse Lck and control were synthesized by Genepharma Co. (Shanghai, China). Radioimmune precipitation assay lysis buffer was purchased from Beyotime (Jiangsu, China). Antibodies against phospho-PKCθ, phospho-STAT5, β-actin, and goat anti-rabbit IgG (horseradish peroxidase) were purchased from Abcam. Antibody against phospho-Tyr-394 Lck was purchased from Abnova (Taiwan, China). Antibodies against phospho-IKKα/β, p65, and phospho-IκBα were purchased from Cell Signaling Technology (Boston, MA).
Proliferation assay
Splenocytes/CD4+ T cells cultured in 96-well flat-bottomed plates at a density of 1 × 10⁶ cells/well in 200 μl of RPMI 1640 medium supplemented with 10% FBS were stimulated with 100, 1000, 5000, or 10000 ng/ml SEC2 or ST-4 to assess proliferation. Plates were incubated for 72 h at 37 °C in a humidified atmosphere containing 5% CO2. After incubation, cell proliferation was determined with an MTS assay. Absorbance (Abs) values were measured with a microplate reader at a measurement wavelength of 490 nm and reference wavelength of 620 nm. The proliferation index of splenocytes or CD4+ T cells (PIsplenocytes/CD4+ T cells) was calculated as follows: Abs value in experimental groups/Abs value in negative control groups.
CFSE cell division
Cells were obtained and labeled with CFSE as described previously (18, 43). Labeled cells were resuspended in RPMI 1640 medium supplemented with 10% FBS at a final concentration of 5 × 10⁶ cells/ml and then incubated with AEB071 at two different final concentrations (1.0 or 0.1 μm) or anti-IL-2 antibody at a final concentration of 10 μg/ml to block PKCθ or IL-2 signaling, respectively. All cells were incubated in 48-well flat-bottomed plates at a density of 3 × 10⁶ cells/well in 0.5 ml of culture medium at 37 °C in a humidified atmosphere containing 5% CO2 for 30 min and then stimulated with SEC2/ST-4 at a final concentration of 5000 ng/ml for the time indicated in figures. Untreated cells served as a negative control. After incubation, cell division analysis was performed using a BD LSRFortessa, and data were analyzed with FlowJo software (Tree Star, Ashland, OR). Division index represents the average number of divisions that a cell (present in the starting population) has undergone.
Splenocyte/CD4+ T-cell phenotype analysis
Freshly isolated splenocytes/CD4+ T cells (5 × 10⁶ cells/ml) were incubated and stimulated as indicated above. Cell surface markers were determined by staining with fluorochrome-conjugated monoclonal antibodies. The antibody panel consisted of APC-conjugated anti-mouse CD3 for T lymphocytes, PE-conjugated anti-mouse CD69 for early activated T cells, and PE-conjugated anti-mouse CD25 for IL-2 receptors. Cells stimulated in 48-well plates were centrifuged and washed twice with PBS buffer. Next, cells (2 × 10⁶ cell/tube) were resuspended in 50 μl of PBS containing moderate concentrations of antibodies according to the manufacturer's instructions and incubated for 20 min at 4 °C in the dark. Flow cytometry was performed using a BD LSRFortessa, and data were analyzed with FlowJo software.
Cytokine assay
Freshly isolated splenocytes/CD4+ T cells (5 × 10⁶ cell/ml) were incubated and stimulated as indicated in the legend to Fig. 6. Cell culture supernatants were collected, and the concentration of IL-2 in the supernatant was determined using an ELISA kit according to the manufacturer's instructions. Absorbance values were measured with a microplate reader at a measurement wavelength of 450 nm and reference wavelength of 620 nm.
RNA extraction and quantitative real-time PCR (qRT-PCR)
CD4+ T cells were resuspended in RPMI 1640 medium supplemented with 10% FBS at a final density of 5 × 10⁶ cells/ml, and then stimulated with SEC2/ST-4 at a final concentration of 5000 ng/ml in 48-well flat-bottomed plates at 3 × 10⁶ cells/well in 0.5 ml of culture medium at 37 °C in a humidified atmosphere containing 5% CO2 for 72 h. Untreated cells served as a negative control. After incubation, CD4+ T cells were harvested, and total RNA was extracted from 5 × 10⁶ cells using the RNA-extracting reagent RNAiso Plus. A 0.5-μg sample of total RNA was reverse-transcribed using the Primescript RT Master Kit according to the manufacturer's instructions. Resulting cDNA was used for amplification by qRT-PCR with a SYBR Premix Ex TaqTM Kit and ABI Prism 7000 (Applied Biosystems, Norwalk, CT). PCR conditions were as follows: initial denaturation at 94 °C (30 s), followed by 40 cycles at 94 °C (25 s), 60 °C (45 s), and 72 °C (45 s). Primers for mouse TCR Vβ and β-actin were as reported previously (17, 44). Relative transcription levels were determined using the 2−ΔΔCt analysis method. The equation is as follows: -fold change = 2−ΔΔCt; ΔCt = Ct (sample) − Ct (endogenous control); ΔΔCt = ΔCt (sample) − ΔCt (negative control).
Transfection of Lck siRNA
The siRNA sequences for mouse Lck (Lck1 siRNA, 5′-ggc ugu guc ugc agc uca aac-3′ and 5′-uug agc ugc aga cac agc cca-3′; Lck2 siRNA, 5′-ggu ucu uca aga auc uga gcc gua a-3′ and 5′-uua cgg cuc aga uuc uug aag aac caa-3′) and control (nonspecific siRNA, 5′-uuc ucc gaa cgu guc acg utt-3′ and 5′-acg uga cac guu cgg aga att-3′) were as reported previously (45–47). Transient transfection of siRNA was performed with the siRNA-Mate transfection regent (Genepharma Co.) according to the manufacturer's instructions. Briefly, 20 pmol of Lck siRNA or control was mixed with 2 μl of siRNA-Mate and incubated in 50 μl of serum-free RPMI 1640 medium for 20 min. The siRNA-Mate–siRNA complex was allowed to incubate with mice splenocytes/CD4+ T cells in 48-well flat-bottomed plates at a density of 3 × 10⁶ cells/well for 4 h. Then SEC2/ST-4 was added to mixed cultures at a final concentration of 5000 ng/ml at 37 °C in a humidified atmosphere containing 5% CO2 for the indicated times in Fig. 9. Nonspecific control siRNA-transfected splenocytes/CD4+ T cells were used as a negative control.
SDS-PAGE and Western blotting
After treatment with SEC2/ST-4 and inhibitor or anti-IL-2 antibody as indicated above, a total of 1 × 10⁷ splenocytes/CD4+ T cells were collected and lysed in radioimmune precipitation assay lysis buffer at 4 °C for 10 min to extract cellular protein. Samples containing an equal amount of protein (10–30 μg) were mixed with 5× Laemmli buffer, boiled, and subjected to 10% SDS-PAGE. After electrophoresis, samples were transferred from gels onto polyvinylidene difluoride membranes (Millipore, Billerica, MA), which were blocked with 5% skimmed milk for 1 h. Polyvinylidene difluoride membranes were subsequently reacted with the primary antibody at an appropriate dilution, followed by a horseradish peroxidase–conjugated secondary antibody. Detection was performed using an enhanced chemiluminescence method.
Data analysis
All values are given as mean ± S.D. Data were analyzed using a two-way analysis of variance method. The followup least significant difference test was used for post hoc comparison to assess which groups were different from others. p values < 0.05 were considered to indicate a significant difference between groups. Pearson's correlation analysis was conducted with SPSS Statistics version 17.0 (IBM, Armonk, NY). p values < 0.05 were considered to be statistically significant.
Author contributions
X. F., M. X., and Y. S. data curation; X. F., M. X., and Y. S. software; X. F., M. X., and Y. S. formal analysis; X. F. supervision; X. F., M. X., Y. S., H. Z., and J. Z. funding acquisition; X. F., M. X., Y. S., Y. L., and H. Z. investigation; X. F., M. X., Y. S., J. Z., and C. Z. methodology; X. F., M. X., Y. S., J. Z., and C. Z. writing-original draft; X. F., M. X., Y. S., and C. Z. project administration; X. F., M. X., Y. S., J. Z., and C. Z. writing-review and editing; M. X. and Y. S. conceptualization; M. X. and Y. S. resources; M. X. and Y. S. visualization.
Acknowledgment
We thank Liwen Bianji (Edanz Group China) for editing the English text of a draft of the manuscript.
This work was supported by Strategic Priority Research Program of the Chinese Academy of Sciences Grant XDA12020225 and Science and Technology Plan Projects of Shenyang City Grants Z17-7-013 and Y17-4-003. The authors declare that they have no conflicts of interest with the contents of this article.
- SE
- staphylococcal enterotoxin
- SEC2
- staphylococcal enterotoxin C2
- MHC
- major histocompatibility complex
- TCR
- T-cell receptor
- IL-2
- interleukin-2
- APC
- antigen-presenting cell
- PKC
- protein kinase C
- IκB
- inhibitor of κB
- IKKα/β
- α and β IκB kinase
- Lck
- lymphocyte-specific tyrosine kinase
- IL-2R
- IL-2 receptor
- STAT
- signal transducer and activator of transcription
- PE
- phycoerythrin; microcluster
- RPMI
- Roswell Park Memorial Institute
- FBS
- fetal bovine serum
- CFSE
- carboxyfluorescein diacetate succinimidyl ester
- Abs
- absorbance
- qRT-PCR
- quantitative real-time PCR
- MTS
- 3-(4,5-dimethylthiazol-2-yl)-5-(3-carboxymethoxyphenyl)-2-(4-sulfophenyl)-2H-tetrazolium, inner salt.
References
- 1. Bohach G. A., Fast D. J., Nelson R. D., and Schlievert P. M. (1990) Staphylococcal and streptococcal pyrogenic toxins involved in toxic shock syndrome and related illnesses. Crit. Rev. Microbiol. 17, 251–272 10.3109/10408419009105728 [DOI] [PubMed] [Google Scholar]
- 2. Fraser J. D., and Proft T. (2008) The bacterial superantigen and superantigen-like proteins. Immunol. Rev. 225, 226–243 10.1111/j.1600-065X.2008.00681.x [DOI] [PubMed] [Google Scholar]
- 3. Lando P. A., Olsson C., Kalland T., Newton D., Kotb M., and Dohlsten M. (1996) Regulation of superantigen-induced T cell activation in the absence and the presence of MHC class II. J. Immunol. 157, 2857–2863 [PubMed] [Google Scholar]
- 4. Newton D. W., Dohlsten M., Lando P. A., Kalland T., Olsson C., and Kotb M. (1998) MHC class II-independent, Vβ-specific activation of T cells by superantigen mutants fused to anti-tumor Fab fragments: implications for use in treatment of human colon carcinoma. Int. J. Mol. Med. 1, 157–162 [DOI] [PubMed] [Google Scholar]
- 5. Lamphear J. G., Bohach G. A., and Rich R. R. (1998) Structural dichotomy of staphylococcal enterotoxin C superantigens leading to MHC class II-independent activation of T lymphocytes. J. Immunol. 160, 2107–2114 [PubMed] [Google Scholar]
- 6. Yokosuka T., and Saito T. (2010) The immunological synapse, TCR microclusters, and T cell activation. Curr. Top. Microbiol. Immunol. 340, 81–107 [DOI] [PubMed] [Google Scholar]
- 7. Hashimoto-Tane A., and Saito T. (2016) Dynamic regulation of TCR-microclusters and the microsynapse for T cell activation. Front. Immunol. 7, 255 [DOI] [PMC free article] [PubMed] [Google Scholar]
- 8. Marti F., Garcia G. G., Lapinski P. E., MacGregor J. N., and King P. D. (2006) Essential role of the T cell-specific adapter protein in the activation of LCK in peripheral T cells. J. Exp. Med. 203, 281–287 10.1084/jem.20051637 [DOI] [PMC free article] [PubMed] [Google Scholar]
- 9. Baier G., Telford D., Giampa L., Coggeshall K. M., Baier-Bitterlich G., Isakov N., and Altman A. (1993) Molecular cloning and characterization of PKCθ, a human novel member of the protein kinase C (PKC) gene family expressed predominantly in hematopoietic cells. J. Biol. Chem. 268, 4997–5004 [PubMed] [Google Scholar]
- 10. Isakov N., and Altman A. (2012) PKC-θ-mediated signal delivery from the TCR/CD28 surface receptors. Front. Immunol. 3, 273 [DOI] [PMC free article] [PubMed] [Google Scholar]
- 11. Brezar V., Tu W. J., and Seddiki N. (2015) PKC-θ in regulatory and effector T-cell functions. Front. Immunol. 6, 530 [DOI] [PMC free article] [PubMed] [Google Scholar]
- 12. Villalba M., Coudronniere N., Deckert M., Teixeiro E., Mas P., and Altman A. (2000) A novel functional interaction between Vav and PKCθ is required for TCR-induced T cell activation. Immunity 12, 151–160 10.1016/S1074-7613(00)80168-5 [DOI] [PubMed] [Google Scholar]
- 13. Khoshnan A., Bae D., Tindell C. A., and Nel A. E. (2000) The physical association of protein kinase Cθ with a lipid raft-associated inhibitor of κB factor kinase (IKK) complex plays a role in the activation of the NF-κB cascade by TCR and CD28. J. Immunol. 165, 6933–6940 10.4049/jimmunol.165.12.6933 [DOI] [PubMed] [Google Scholar]
- 14. Kim H. P., Imbert J., and Leonard W. J. (2006) Both integrated and differential regulation of components of the IL-2/IL-2 receptor system. Cytokine Growth Factor Rev. 17, 349–366 10.1016/j.cytogfr.2006.07.003 [DOI] [PubMed] [Google Scholar]
- 15. Vallabhapurapu S., and Karin M. (2009) Regulation and function of NF-κB transcription factors in the immune system. Annu. Rev. Immunol. 27, 693–733 10.1146/annurev.immunol.021908.132641 [DOI] [PubMed] [Google Scholar]
- 16. Shatrova A. N., Mityushova E. V., Vassilieva I. O., Aksenov N. D., Zenin V. V., Nikolsky N. N., and Marakhova I. I. (2016) Time-dependent regulation of IL-2Rα-chain (CD25) expression by TCR signal strength and IL-2-induced STAT5 signaling in activated human blood T lymphocytes. PLoS One 11, e0167215 10.1371/journal.pone.0167215 [DOI] [PMC free article] [PubMed] [Google Scholar]
- 17. Liu Y., Xu M., Su Z., Cai Y., Zhang G., and Zhang H. (2012) Increased T-cell stimulating activity by mutated SEC2 correlates with its improved antitumor potency. Lett. Appl. Microbiol. 55, 362–369 10.1111/j.1472-765X.2012.03303.x [DOI] [PubMed] [Google Scholar]
- 18. Zhang G., Xu M., Zhang H., Song Y., Wang J., and Zhang C. (2016) Up-regulation of granzyme B and perforin by staphylococcal enterotoxin C2 mutant induces enhanced cytotoxicity in Hepa1–6 cells. Toxicol. Appl. Pharmacol. 313, 1–9 10.1016/j.taap.2016.10.009 [DOI] [PubMed] [Google Scholar]
- 19. Fu X., Xu M., Yao S., Zhang H., Zhang C., and Zhang J. (2017) Staphylococcal enterotoxin C2 mutant drives T lymphocyte activation through PI3K/mTOR and NF-κB signaling pathways. Toxicol. Appl. Pharmacol. 333, 51–59 10.1016/j.taap.2017.08.006 [DOI] [PubMed] [Google Scholar]
- 20. Zheng Y., Collins S. L., Lutz M. A., Allen A. N., Kole T. P., Zarek P. E., and Powell J. D. (2007) A role for mammalian target of rapamycin in regulating T cell activation versus anergy. J. Immunol. 178, 2163–2170 10.4049/jimmunol.178.4.2163 [DOI] [PubMed] [Google Scholar]
- 21. Saito T., Yokosuka T., and Hashimoto-Tane A. (2010) Dynamic regulation of T cell activation and co-stimulation through TCR-microcluster. FEBS Lett. 584, 4865–4871 10.1016/j.febslet.2010.11.036 [DOI] [PubMed] [Google Scholar]
- 22. Hashimoto-Tane A., and Saito T. (2016) Dynamic regulation of TCR-microclusters and the microsynapse for T cell activation. Front. Immunol. 7, 255 [DOI] [PMC free article] [PubMed] [Google Scholar]
- 23. Krakauer T. (2013) Update on staphylococcal superantigen-induced signaling pathways and therapeutic interventions. Toxins 5, 1629–1654 10.3390/toxins5091629 [DOI] [PMC free article] [PubMed] [Google Scholar]
- 24. Fraser J. D., Newton M. E., and Weiss A. (1992) CD28 and T-cell antigen receptor signal transduction coordinately regulates interleukin 2 gene expression in response to superantigen stimulation. J. Exp. Med. 175, 1131–1134 10.1084/jem.175.4.1131 [DOI] [PMC free article] [PubMed] [Google Scholar]
- 25. Kaempfer R., Arad G., Levy R., Hillman D., Nasie I., and Rotfogel Z. (2013) CD28: direct and critical receptor for superantigen toxins. Toxins 5, 1531–1542 10.3390/toxins5091531 [DOI] [PMC free article] [PubMed] [Google Scholar]
- 26. Arad G., Levy R., Nasie I., Hillman D., Rotfogel Z., Barash U., Supper E., Shpilka T., Minis A., and Kaempfer R. (2011) Binding of superantigen toxins into the CD28 homodimer interface is essential for induction of cytokine genes that mediate lethal shock. PLoS Biol. 9, e1001149 10.1371/journal.pbio.1001149 [DOI] [PMC free article] [PubMed] [Google Scholar]
- 27. Kersh G. J., Kersh E. N., Fremont D. H., and Allen P. M. (1998) High- and low-potency ligands with similar affinities for the TCR: the importance of kinetics in TCR signaling. Immunity 9, 817–826 10.1016/S1074-7613(00)80647-0 [DOI] [PubMed] [Google Scholar]
- 28. Andersen P. S., Geisler C., Buus S., Mariuzza R. A., and Karjalainen K. (2001) Role of the T cell receptor ligand affinity in T cell activation by bacterial superantigens. J. Biol. Chem. 276, 33452–33457 10.1074/jbc.M103750200 [DOI] [PubMed] [Google Scholar]
- 29. Bours V., Franzoso G., Brown K., Park S., Azarenko V., and Tomita-Yamaguchi M., Kelly K., and Siebenlist U. (1992) Lymphocyte activation and the family of NF-κB transcription factor complexes. Curr. Top. Microbiol. Immunol. 182, 411–420 [DOI] [PubMed] [Google Scholar]
- 30. Sun Z., Arendt C. W., Ellmeier W., Schaeffer E. M., Sunshine M. J., Gandhi L., Annes J., Petrzilka D., Kupfer A., Schwartzberg P. L., and Littman D. R. (2000) PKC-θ is required for TCR-induced NF-κB activation in mature but not immature T lymphocytes. Nature 404, 402–407 10.1038/35006090 [DOI] [PubMed] [Google Scholar]
- 31. Coudronniere N., Villalba M., Englund N., and Altman A. (2000) NF-κB activation induced by T cell receptor/CD28 costimulation is mediated by protein kinase C-θ. Proc. Natl. Acad. Sci. U.S.A. 97, 3394–3399 10.1073/pnas.060028097 [DOI] [PMC free article] [PubMed] [Google Scholar]
- 32. Spitaler M., and Cantrell D. A. (2004) Protein kinase C and beyond. Nat. Immunol. 5, 785–790 10.1038/ni1097 [DOI] [PubMed] [Google Scholar]
- 33. Monks C. R., Kupfer H., Tamir I., Barlow A., and Kupfer A. (1997) Selective modulation of PKCθ during T-cell activation. Nature 385, 83–86 10.1038/385083a0 [DOI] [PubMed] [Google Scholar]
- 34. Thebault S., and Ochoa-Garay J. (2004) Characterization of TCR-induced phosphorylation of PKCθ in primary murine lymphocytes. Mol. Immunol. 40, 931–942 10.1016/j.molimm.2003.10.014 [DOI] [PubMed] [Google Scholar]
- 35. Evenou J. P., Wagner J., Zenke G., Brinkmann V., Wagner K., Kovarik J., Welzenbach K. A., Weitz-Schmidt G., Guntermann C., Towbin H., Cottens S., Kaminski S., Letschka T., Lutz-Nicoladoni C., Gruber T., Hermann-Kleiter N., Thuille N., and Baier G. (2009) The potent protein kinase C-selective inhibitor AEB071 (Sotrastaurin) represents a new class of immunosuppressive agents affecting early T-cell activation. J. Pharmacol. Exp. Ther. 330, 792–801 10.1124/jpet.109.153205 [DOI] [PubMed] [Google Scholar]
- 36. Li L., Guo X., Shi X., Li C., Wu W., Yan C., Wang H., Li H., and Xu C. (2017) Ionic CD3-Lck interaction regulates the initiation of T-cell receptor signaling. Proc. Natl. Acad. Sci. U.S.A. 114, E5891–E5899 10.1073/pnas.1701990114 [DOI] [PMC free article] [PubMed] [Google Scholar]
- 37. Liu Y., Witte S., Liu Y. C., Doyle M., Elly C., and Altman A. (2000) Regulation of protein kinase Cθ function during T cell activation by Lck-mediated tyrosine phosphorylation. J. Biol. Chem. 275, 3603–3609 10.1074/jbc.275.5.3603 [DOI] [PubMed] [Google Scholar]
- 38. Yamasaki S., Tachibana M., Shinohara N., and Iwashima M. (1997) Lck-independent triggering of T-cell antigen receptor signal transduction by staphylococcal enterotoxins. J. Biol. Chem. 272, 14787–14791 10.1074/jbc.272.23.14787 [DOI] [PubMed] [Google Scholar]
- 39. Bueno C., Lemke C. D., Criado G., Baroja M. L., Ferguson S. S. G., Rahman A. K., Tsoukas C. D., McCormick J. K., and Madrenas J. (2006) Bacterial superatigens bypass Lck-dependent T cell receptor signaling by activating a Gα11-dependent, PLC-β-mediated pathway. Immunity 25, 67–78 10.1016/j.immuni.2006.04.012 [DOI] [PubMed] [Google Scholar]
- 40. Kuroda K., Yagi J., Imanishi K., Yan X. J., Li X. Y., Fujimaki W., Kato H., Miyoshi-Akiyama T., Kumazawa Y., Abe H., and Uchiyama T. (1996) Implantation of IL-2-containing osmotic pump prolongs the survival of superantigen-reactive T cells expanded in mice injected with bacterial superantigen. J. Immunol. 157, 1422–1431 [PubMed] [Google Scholar]
- 41. Nakajima H., Liu X. W., Wynshaw-Boris A., Rosenthal L. A., Imada K., Finbloom D. S., Hennighausen L., and Leonard W. J. (1997) An indirect effect of STAT5a in IL-2-induced proliferation: a critical role for Stat5a in IL-2-mediated IL-2 receptor α chain induction. Immunity 7, 691–701 10.1016/S1074-7613(00)80389-1 [DOI] [PubMed] [Google Scholar]
- 42. Xu M., Wang X., Cai Y., Zhang H., Yang H., Liu C., and Zhang C. (2011) An engineered superantigen SEC2 exhibits promising antitumor activity and low toxicity. Cancer Immunol. Immunother. 60, 705–713 10.1007/s00262-011-0986-6 [DOI] [PMC free article] [PubMed] [Google Scholar]
- 43. Hovde C. J., Hackett S. P., and Bohach G. A. (1990) Nucletide sequence of the staphylococcal enterotoxin C3 gene sequence comparison of all three type C staphylococcal enterotoxins. Mol. Gen. Genet. 220, 329–333 [DOI] [PubMed] [Google Scholar]
- 44. Tomasello E., Olcese L., Vély F., Geourgeon C., Bléry M., Moqrich A., Gautheret D., Djabali M., Mattei M. G., and Vivier E. (1998) Gene structure, expression pattern, and biological activity of killer cell activating receptor-associated protein (KARAP)/DAP-12. J. Biol. Chem. 273, 34115–34119 10.1074/jbc.273.51.34115 [DOI] [PubMed] [Google Scholar]
- 45. Zhang S., Yang R., and Zheng Y. (2015) The effect of siRNA-mediated lymphocyte-specific protein tyrosine kinase (Lck) inhibition on pulmonary inflammation in a mouse model of asthma. Int. J. Clin. Exp. Med. 8, 15146–15154 [PMC free article] [PubMed] [Google Scholar]
- 46. Parmar K. M., Nambudiri V., Dai G., Larman H. B., Gimbrone M. A. Jr., and García-Cardeña G. (2005) Stains exert endothelial atheroprotective effects via the KLF2 transcription factor. J. Biol. Chem. 280, 26714–26719 10.1074/jbc.C500144200 [DOI] [PubMed] [Google Scholar]
- 47. Rajasekaran K., Kumar P., Schuldt K. M., Peterson E. J., Vanhaesebroeck B., Dixit V., Thakar M. S., and Malarkannan S. (2013) Signaling by Fyn-ADAP via the Carma1-Bcl-10-MAP3K7 signalosome exclusively regulates inflammatory cyokine. Nat. Immunol. 14, 1127–1136 10.1038/ni.2708 [DOI] [PMC free article] [PubMed] [Google Scholar]