

Abstract
Expansion of the polyglutamine (polyQ) tract in exon 1 of the huntingtin protein (Httex1) leads to Huntington's disease resulting in fatal neurodegeneration. However, it remains poorly understood how polyQ expansions alter protein structure and cause toxicity. Using CD, EPR, and NMR spectroscopy, we found here that monomeric Httex1 consists of two co-existing structural states whose ratio is determined by polyQ tract length. We observed that short Q-lengths favor a largely random-coil state, whereas long Q-lengths increase the proportion of a predominantly α-helical state. We also note that by following a mobility gradient, Httex1 α-helical conformation is restricted to the N-terminal N17 region and to the N-terminal portion of the adjoining polyQ tract. Structuring in both regions was interdependent and likely stabilized by tertiary contacts. Although little helicity was present in N17 alone, each Gln residue in Httex1 enhanced helix stability by 0.03–0.05 kcal/mol, causing a pronounced preference for the α-helical state at pathological Q-lengths. The Q-length–dependent structuring and rigidification could be mimicked in proteins with shorter Q-lengths by a decrease in temperature, indicating that lower temperatures similarly stabilize N17 and polyQ intramolecular contacts. The more rigid α-helical state of Httex1 with an expanded polyQ tract is expected to alter interactions with cellular proteins and modulate the toxic Httex1 misfolding process. We propose that the polyQ-dependent shift in the structural equilibrium may enable future therapeutic strategies that specifically target Httex1 with toxic Q-lengths.
Keywords: Huntington disease, electron paramagnetic resonance (EPR), nuclear magnetic resonance (NMR), polyglutamine, neurodegeneration, protein misfolding, conformational equilibrium
Introduction
Huntington's disease (HD)6 is one of nine known neurodegenerative, protein aggregation-associated disorders that are caused by a heritable polyglutamine (polyQ) expansion in the etiological protein (1, 2). HD patients carry a dominant mutation in the gene that encodes huntingtin (Htt) such that the polyQ tract in the first exon is expanded to contain 36 or more Q repeats (3, 4). HD progression is characterized by toxicity to neurons in the neostriatum as well as a variety of other brain regions (5). Although studies implicate specific monomeric, oligomeric, and fibrillar species of mutant Htt in neuronal toxicity (6, 7), the bounty of functions served by Htt and the variety of pathways possibly relevant to toxicity in HD have made the exact mechanism or mechanisms by which polyQ expansion leads to cell death difficult to pinpoint (8).
Several mechanisms for Htt toxicity have been proposed, ranging from misfolding and aggregate formation to toxicity due to differences between polyQ-expanded and nonexpanded Htt monomers (6, 7, 9–12). Increased Q-length has been observed to alter interactions with different cellular binding partners (13, 14), which could, at least in some cases, be the result of structural differences in the monomer. A number of N-terminal fragments of Htt occur naturally in neurons (1), with a higher frequency of fragmentation and a broader range of lengths occurring in HD brains (15). These fragments include one that comprises the Htt region encoded by exon 1 (Httex1), with which in the presence of the expanded polyQ has been proven sufficient to cause HD-like symptoms in transgenic mice (16). Thus, understanding how polyQ-length impacts the structure of the naturally occurring Httex1 monomer is important for understanding the potential pathogenic roles of Httex1 and Htt monomers. It may also provide insights into misfolding, as the monomer is the starting structure for this process.
Httex1 is composed of three domains: an N-terminal region (N17); a central polyQ region; and a C-terminal Pro-rich domain (PRD) (17). Several studies have found that Httex1 loses its conformational flexibility when the Q-length expands above disease threshold (17–19), and the reduced flexibility resulting from expanded polyQ has been suggested as a potential contributor to Htt toxicity (9). The N17 region plays a crucial role in the structural changes and altered cellular behavior conferred by polyQ expansion. Phosphorylation of serine residues 13 and 16 in the N17 modulates its secondary structure, slows down aggregation, and alters nuclear targeting of Httex1 aggregates (20). Phosphomimicking mutations at those sites furthermore proved neuroprotective in Htt-Q97 transgenic mice (21) underscoring the importance of this region for disease. Other post-translational modifications on N17 were also shown to regulate polyQ-expanded Httex1 aggregation (22). Although N17 and N17–polyQ interactions are critical for mitigating HD progression, the structural basis for this mitigation is only partly understood. Recent studies show that Httex1 as well as other N-terminal Htt fragments have a partial α-helical structure that is augmented by increased Q-length as well as decreased temperature (18, 19). Two recent NMR analyses, one performed on an Httex1-based peptide fragment containing 17 Gln residues and the other mostly performed on Httex1 containing 16 Gln residues, found α-helical propensity in the N17 region that extends into the polyQ region (23, 24). Similar results were obtained in crystallographic studies of fusion proteins containing Httex1-like sequences (25). However, these studies mostly employed short polyQ-lengths and, aside from FRET measurements and computational models (26–28), little experimental information is available for how the important pathogenic Q-lengths affect monomer structure. A more recent NMR and hydrogen–deuterium exchange (HDX) study compared structural behaviors of Httex1 between wildtype and disease Q-lengths and found both to adopt heterogeneous conformational ensembles lacking stable hydrogen bond formation, suggesting the secondary structures formed were transient or unstable (29). Ultimately a tadpole-like structural ensemble is envisioned, where the N17 and polyQ take up a more collapsed yet poorly defined structure, whereas the PRD projects away from this structure (27, 29).
Understanding potential Q-length–dependent conformational differences in the structural states of Httex1 would be important, as they could affect protein–protein interactions, which could in principle contribute to toxicity. Even if the monomer does not directly contribute to toxicity, a better understanding of Q-length–dependent structural differences could potentially be exploited for generating molecules that specifically target mutant, but not WT, huntingtin or Httex1. Here, we use a combination of circular dichroism (CD), electron paramagnetic resonance (EPR), and NMR to further investigate the Q-length dependence of the underlying structural states in Httex1 monomers.
Results
To study Httex1 structure, it was important to stabilize the monomeric conformation. We previously found that the thioredoxin huntingtin exon 1 fusion protein (Trx–Httex1) is a convenient and robust model system for studying Httex1 monomers at low micromolar concentrations (19). The presence of the fusion partner prevents the oligomerization and aggregation that would otherwise complicate the analysis of Httex1 with expanded Q-lengths. Although most of the work presented here was performed using this fusion protein, our model system was also compared with Httex1 lacking thioredoxin (Trx). The constructs used throughout this study are listed in Fig. S1.
Httex1 folding depends on temperature and Q-length
We previously used CD to investigate the secondary structure of Trx–Httex1 with Q46 and Q25 (19). These studies found that Trx–Httex1, but not Trx alone, exhibited temperature-dependent structural changes in the range between 37 and −10 °C, indicating that the temperature-dependent structural changes were solely attributable to Httex1. Moreover, the structural changes in this entire temperature range were independent of concentration and not caused by oligomerization, in agreement with previous analytical ultracentrifugation data (30) and small-angle X-ray scattering data (31), which indicated that the Trx–Httex1 fusion protein with expanded Q-length is monomeric at low micromolar concentrations. Here, we used the CD approach to systematically test the influence of Q-length on Trx–Httex1 structure. Toward this end, we recorded additional CD spectra of Trx–Httex1 with 7, 16, and 55 Gln residues at different temperatures (Fig. 1, a–c). As in our previous study (19), we included supercooled temperatures (−10 °C) to increase the temperature range available for ordering, and we visually confirmed that samples were not frozen, even in the absence of a cryoprotectant. Clearly detectable temperature-dependent spectral changes were observed in all cases. The difference spectra for the highest (37 °C) and lowest temperatures (−10 °C) gave pronounced minima at 208 and 222 nm (Fig. 1d), consistent with an increase of α-helical structure at the lower temperature. In our previous study, we demonstrated that, after subtraction of the Trx contribution, the α-helical content of Httex1 could be estimated from its mean residue ellipticity (MREHttex1) at 222 nm (19). This measure was plotted in Fig. 1e for the studied Q-lengths. In all cases, MREHttex1 values became more negative with decreasing temperature and/or increasing Q-length, indicating that both of these factors promote the α-helical structure. Additionally, the temperature-dependent increases in α-helix became larger for longer Q-lengths. Next, we used the MREHttex1 values to estimate the number of nominal residues that convert from a random coil into an α-helical conformation when transitioning from 37 to −10 °C. These estimates were gradually increasing with Q-length and ranged from 11 amino acids for Q7 to 32 amino acids for Q55 (Fig. 1f). Inasmuch as the number of residues becoming α-helical was often larger than 17 (for Q25 and higher), regions outside of the N17 must have contributed to the observed helicity.
Figure 1.
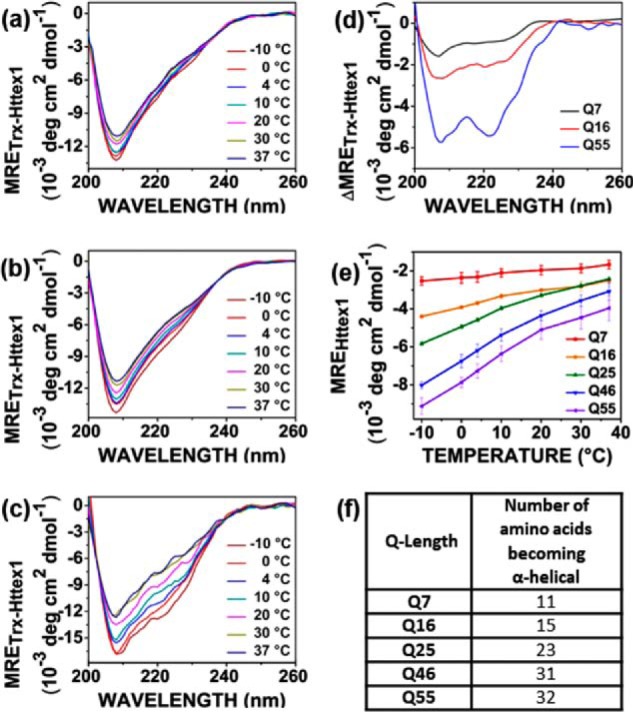
CD of Trx–Httex1 with different Q-lengths as function of temperature. The CD spectra for Httex1 with Q7 (a), Q16 (b), and Q55 (c) derivatives of Trx–Httex1 were obtained at the indicated temperatures. The data were normalized to give MRETrx–Httex1. d shows the difference spectra (difference between −10 and 37 °C) for the spectra shown in a–c. All difference spectra exhibit double minima at 208 and 222 nm that become more negative with increasing Q-length. e shows MREHttex1 values at 222 nm for each temperature tested. All data are represented as mean ± S.D. of three independent experiments. Data for Q25 and Q46 were from Ref. 19. f provides an estimate of the number of amino acids that become more helical upon lowering the temperature from 37 to −10 °C. Estimates were obtained using a helix-coil transition model (19, 49, 50).
Co-existing populations of different structures characterize the N17 and the N-terminal region of polyQ
To locate the regions in which the temperature and Q-length–dependent structural changes occur, we employed site-directed spin labeling of 14 Trx–Httex1(Q46) derivatives and performed EPR spectroscopy at 10 temperatures from −10 to 37 °C. As illustrated in Fig. 2a, these derivatives harbored single spin labels at selected sites in the N17 (5R1, 9R1, 11R1, and 17R1), polyQ (21R1, 30R1, 35R1, 48R1, and 63R1), and PRD (66R1, 76R1, 81R1, 91R1, and 101R1). To ensure the monomeric nature of the spin-labeled proteins, all samples were subjected to ultrafiltration at 4 °C immediately prior to EPR measurements. Fig. 2b shows spectra for representative derivatives for each of the three regions. The spectra for 11R1 (N17) and 35R1 (polyQ) shared the interesting similarity that they had multiple components that became more clearly resolved at lower temperatures. One of these spectral components indicated a highly mobile structural state (Fig. 2b, denoted m), whereas another one is characteristic of a more immobilized and stable structural state (denoted i). In contrast, 81R1 lacked the immobilized spectral component and was dominated solely by the mobile spectral component. Inspection of the spectra from other labeling sites (Fig. S2) revealed the general trend that all labeling positions in the N17 (5R1, 9R1, and 17R1) and the more N-terminally located sites in the polyQ (21R1 and 30R1) exhibited two-component spectra. In contrast, all sites in the C-terminal region of the polyQ (48R1 and 63R1) as well as all sites in the PRD (66R1, 76R1, 91R1, and 101R1) lacked the strongly immobilized components, and their spectra were dominated by high mobility only. The lack of immobilization for these sites indicated relatively dynamic regions that do not engage in significant tertiary packing interactions. The collective occurrence of pronounced multicomponent EPR spectra that were exclusively found at all N-terminal sites up to residue 35 strongly suggested that this region was characterized by at least two co-existing structural populations. One of these populations was dynamic and largely disordered, and the other was more ordered, likely corresponding to the α-helical structure observed by CD.
Figure 2.
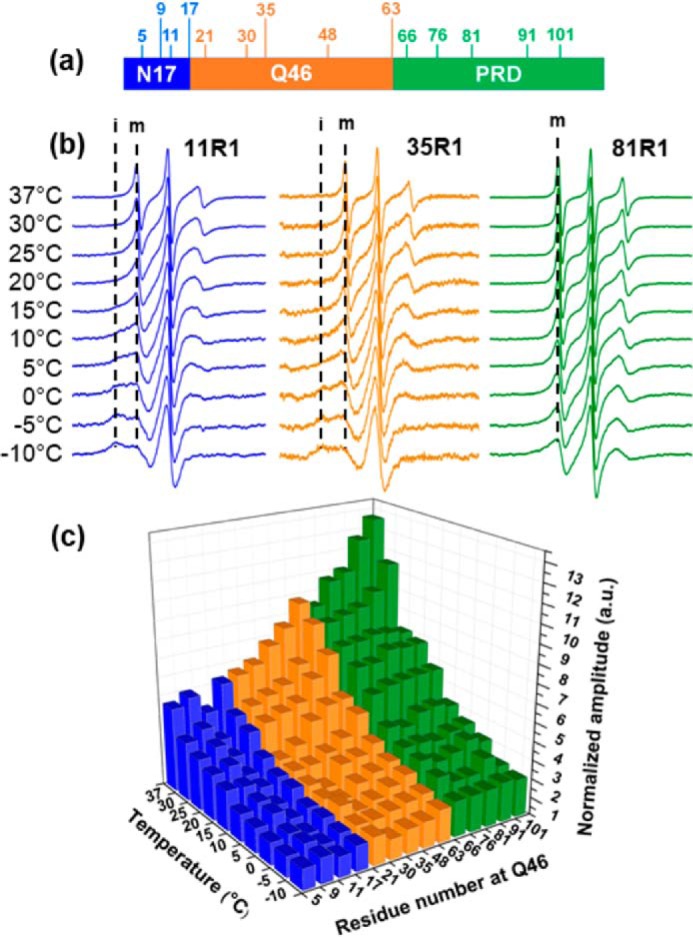
EPR measurements of spin-labeled Trx–Httex1(Q46) derivatives at different temperatures. a, schematic representation of the Httex1 domain organization illustrating the location of spin-labeled sites. b, EPR spectra for representative sites from each domain (11R1, 35R1, and 81R1). The dashed lines (labeled i and m) denote spectral components arising from immobile and mobile components, respectively. To better visualize the line shapes, the EPR spectra are arbitrarily scaled to the same amplitude. They are not normalized to the same concentration or number of spins. c, 3D plot of spin-normalized EPR spectral amplitude obtained from double integration for all spin-labeled Trx–Httex1 derivatives as a function of temperature. In general, the amplitude, which is a measure of mobility, increases with increasing residue number and temperature.
Structural ordering in Httex1 occurs in N17 and the N-terminal region of the polyQ
Next, we sought to further summarize the 140 EPR spectra (Fig. 2c) from the different derivatives at several temperatures with a simple semi-quantitative measure of mobility. Two common measures of mobility are the width and the amplitude of the central line. As mobility increases, the central line becomes sharper, and consequently, the amplitude increases. Here, we chose to use the amplitudes of EPR spectra normalized to the same number of spins. This was done because amplitudes are more sensitive to the presence of multicomponent spectra than line widths, which are generally dominated by the most mobile component in a spectrum. As such, both i and m spectral characteristics will be captured by this approach. Fig. 2c shows that the normalized amplitudes of all spectra strongly depended on labeling position and temperature. In accordance with an increase of random-coil conformations, the amplitudes from all derivatives progressively increased with temperature. When comparing amplitudes obtained at the same temperature, the labeling sites in the N17 (Fig. 2c, blue) tended to have the lowest amplitudes, indicative of lowest mobility/highest order in this region. In contrast, the largest amplitudes (highest mobilities) were found in the PRD. The amplitudes in the polyQ region gradually increased from the N- to the C-terminal end. These data indicated the presence of a mobility gradient where mobility progressively decreased with increasing distance from the N17. The generally reduced mobility in the N-terminal region of the protein was consistent with the finding that N-terminal residues up to position 35 had immobilized spectral components, but the more C-terminal sites did not. Thus, this mobility gradient likely reflected the different degrees of α-helix formation along the Httex1 sequence.
To corroborate our results, we ascertained whether the Trx moiety modulated the Httex1 structure and perhaps even contributed to the two different spectral components for the N-terminal sites. Toward this end, we resorted to another way to stabilize its monomeric form and prevent it from aggregating over time. This was achieved by binding Trx-free Httex1 derivatives to nickel beads (His-60 nickel superflow resin) via a C-terminal His tag. This modification left the N terminus tag-free. The EPR spectra of bead-bound Httex1 and Trx–Httex1 from selected sites in the N17 (11R1), in the polyQ tract (35R1), and in the PRD (81R1) were essentially superimposable (Fig. S2). Thus, the presence of the Trx moiety did not measurably affect the local structure and was not responsible for the more immobile components in the spectra of 11R1 and 35R1.
NMR demonstrates inhomogeneous, temperature-dependent helical structure in polyQ of Trx–Httex1(Q46) and Httex1(Q46)
To further characterize the conformational preferences of the polyQ region, we next performed solution NMR measurements of Trx–Httex1(Q46) at pH 7.4 and 5 °C. If all polyQ residues of Trx–Httex1(Q46) were structurally homogeneous, a single intense resonance would dominate the NMR spectra. In Trx–Httex1(Q46), dominating backbone HN and side-chain H2N resonances were indeed detected (Fig. S3). However, the strongest HN backbone resonance clearly was not 46 times stronger than signals from other residues, suggesting that the polyQ region was not structurally homogeneous. The exchange of backbone amides with the solvent may have contributed to the relatively weak polyQ signal intensities. When slowing exchange by reducing the pH to 6.0, the polyQ signals became stronger, but their broad dispersion remained (Fig. 3a). In contrast, when adding 8 m urea as denaturant at pH 7.4, essentially one strong Q signal resulted at both the backbone and side-chain level (Fig. S3). In accordance with a polyQ mobility gradient, the dispersion of Q signals in the absence of urea confirms the polyQ region of Trx–Httex1(Q46) to be structurally inhomogeneous.
Figure 3.
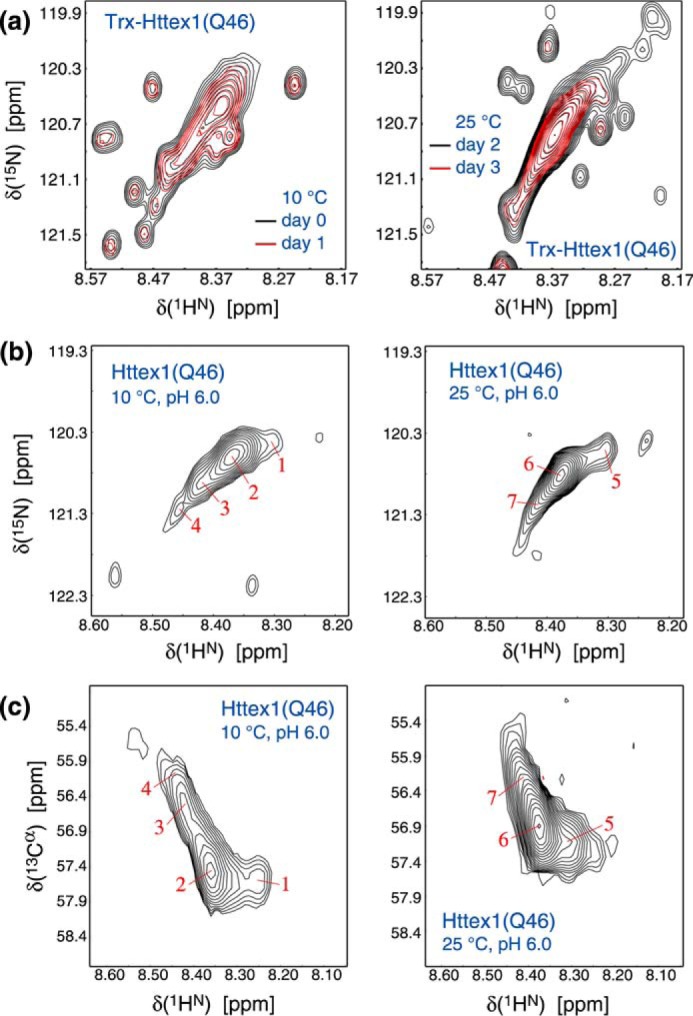
NMR spectra of Trx–Httex1(Q46) and Httex1(Q46) at pH 6.0. a, comparison of HN–N correlation spectra obtained at 10 or 25 °C for Trx–Httex1(Q46). Spectral regions with the most intense resonances, corresponding to polyQ, are shown. b and c show the corresponding HN–N and HN–Cα spectra for Httex1(Q46). The spectra were recorded in 25 mm MES, pH 6.0, 25 mm NaCl at 700 MHz using protein concentrations of 20 and 12 μm for Trx–Httex1(Q46) and Httex1(Q46), respectively.
To expand our findings, we next studied the 13Cα chemical shifts of polyQ in Trx–Httex1(Q46) and also Trx-free Httex1(Q46) at pH 6.0. These shifts correlate with backbone torsion angles (32) and identify the secondary structural propensities of resolved polyQ segments. For both proteins, we experienced a progressive loss of signal over time, reflecting their self-aggregation during the 20-h NMR experiments. Nonetheless, this did not affect their apparent spectral features (Fig. 3a). We ascribe this observation to the dependence of solution NMR line width on isotropic correlation time, i.e. any oligomers formed will have broader resonances than the monomer, which renders their contribution small or undetectable, allowing even the direct study of Httex1(Q46).
At 10 °C, at least four different polyQ resonances were detected, which were similar for Trx–Httex1(Q46) and Httex1(Q46) (Fig. 3, a and b). This similarity further illustrates that the Trx fusion tag does not have a major impact on Httex1 structure. The resonances exhibited positive but varying secondary 13Cα chemical shifts, termed Δδ(13Cα) (Fig. 3c and Table S1), indicative of different degrees of helical content. Stable helical structure would be reached at Δδ(13Cα) ≈3 ppm, showing that all observed segments were only partially helical in accordance with the continued increase in helicity at temperatures below 10 °C (Fig. 1, a–c). At 25 °C, some polyQ resonances detected at 10 °C apparently merged (Fig. 3, b and c) and exhibited reduced Δδ(13Cα) values (Table S1), i.e. structural inhomogeneity and helical content decreased. These findings not only identify the polyQ region as a source of the temperature-dependent variations in Httex1 helical content but also show that polyQ segregates into regions of different helical contents in a temperature-dependent manner. It is even conceivable that individual resonances were detected for the co-existing polyQ populations at 10 °C.
Longer Q-lengths shift equilibrium toward ordered state
After systematic analysis of Httex1(Q46), we next tested how the identified structural features were affected by Q-length. We therefore generated additional spin-labeled derivatives for Trx–Httex1 with Q7, Q16, Q25, and Q55 and compared the EPR spectra of equivalent labeling positions. For representative sites in N17 (5R1), polyQ (21R1 and 35R1), and PRD (3rd position in PRD, equivalent to residue 66R1 in Httex1(Q46)), spectra were compared. Low temperature was chosen for this comparison, as the mobile and immobile spectral components in the N-terminal region were best resolved here (Fig. 4a). The greatest similarities were found for the PRD sites where nearly identical single-component EPR spectra were obtained for all Q-lengths. The spectra for 5R1, 21R1, and 35R1 were also qualitatively similar in exhibiting two-component EPR spectra. Yet, they all showed an interesting quantitative difference, as the relative populations of the mobile and immobile components (designated m and i in Fig. 4) correlated with Q-length. Specifically, the immobile component increased with increasing Q-length, suggesting that long-range effects in elongated polyQ segments promoted the formation of the more ordered, structural state. This effect was strongest for the polyQ sites but also clearly discernible for the N17 site.
Figure 4.

Q-length dependence of Httex1 EPR spectra. a–d, EPR spectra of spin-labeled Httex1 derivatives where the indicated equivalent positions are labeled in proteins with different Q-lengths. Again, residues in the N17 (5R1 (a)) and the N-terminal portion of the polyQ (21R1 (c) and 35R1 (d)) give rise to spectra with immobile (i) and mobile (m) components. Only a mobile component can be seen for the third residue in the PRD (b). For sites with two multicomponent EPR spectra, the immobile component increases with increasing Q-length. Spectra were obtained at −10 °C. Through spectral subtraction it was possible to obtain the immobile (e) and mobile (f) components shown for the example of 21R1. From the ratio of the respective components, ΔG0 values were obtained as function of Q-lengths for 21R1 (g) and 35R1 (h). The dashed lines are fits with the indicated parameters.
To examine the structuring of polyQ on a quantitative level, we used spectral subtractions (see “Experimental procedures”) to generate the underlying mobile and immobile components of the EPR spectrum of 21R1 (Fig. 4, e and f). Quantifying the amounts of the mobile and immobile components normalized by double integration then allowed us to estimate free energy (ΔG0) values for the interconversion between the two different states. As shown in Fig. 4g, the ΔG0 values decreased essentially linearly with Q-length, meaning that the conversion from the mobile to the immobile state became increasingly more favorable with increasing Q-length. The magnitude of this slope was approximately −0.03 kcal/mol per Q. When analyzing 35R1 analogously (Fig. 4h) for all Q variants except Q7, where this position falls outside of the polyQ region, a similar slope of −0.05 kcal/mol per Q was obtained. Thus, at −0.03 to −0.05 kcal/mol, the per residue contributions of individual Glns are relatively small, rationalizing the significant increase in the number of Qs required to achieve the changes in α-helical polyQ content.
Structures of N17 and polyQ are interdependent
To examine secondary structural propensities at shorter Q-lengths, we studied Trx–Httex1(Q7) by solution NMR. Compared with Trx–Httex1(Q46), this construct could be studied at 10-fold higher concentrations without significant signal loss. The higher solubility allowed an essentially complete backbone assignment. As a simple measure of relative backbone dynamics along the Trx–Httex1(Q7) sequence, we compared signal intensities (Fig. 5a). The linker resonances exhibited the highest intensities, verifying the efficient uncoupling of the Trx domain from Httex1(Q7) already indicated in the aforementioned EPR (Fig. S2) and NMR (Fig. 3) experiments. The PRD also exhibited high albeit variable dynamics in overall accordance with EPR analysis (Fig. 2). Surprisingly, intensities for the N17 and polyQ regions were lower than for Trx despite their smaller domain sizes. This behavior indicates that these regions experienced additional dynamic events such as inhomogeneous folding or oligomerization. Their secondary 13Cα shifts were virtually identical at 10 and 25 °C (Fig. 5b), documenting a loss of temperature-induced folding. Moreover, Δδ(13Cα) of N17 and polyQ was near zero (Fig. 5b), which indicates mostly random-coil structure. In other words, in the absence of a sufficiently long polyQ, both N17 and polyQ lost α-helical propensity. This conclusion is consistent with the CD spectrum of a peptide corresponding to the N17 region (Fig. S4), which is dominated by random-coil characteristics in aqueous buffer. In conclusion, the folding of N17 depends on a sufficiently long polyQ sequence, identifying long-range interactions between these regions.
Figure 5.
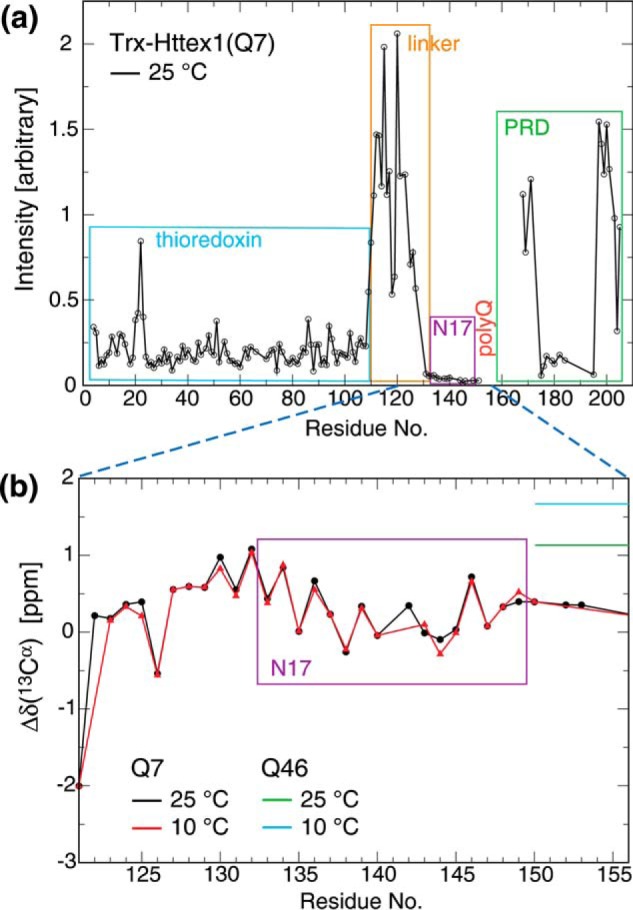
NMR spectral properties of Trx–Httex1(Q7). a, HN–N resonance intensities as a function of residue number. b, secondary Cα chemical shifts, termed Δδ (13Cα), for the linker N17–polyQ segment of Trx–Httex1(Q7). The data were recorded in 25 mm MES, pH 6.0, 25 mm NaCl at 700 MHz a using a protein concentration of 200 μm.
Temperature modulates the N17–polyQ interaction in analogy to Q-length variation
The CD spectra of the different Q variants (Fig. 1) show that shifts in temperature can compensate for expansions in Q-length. To examine whether this “temperature Q-length compensation” was contributed to by a shift in the order–disorder equilibrium, we compared EPR spectra from proteins with different Q-lengths but identical spin-label positions. Indeed, it was possible to obtain good spectral overlaps for Httex1 with different Q-lengths when appropriate temperatures were compared. This is illustrated for 21R1 in the shortest (Q7) and longest (Q55) Httex1 variant. Nearly superimposable spectra could be obtained when the Q55 spectra were recorded at temperatures that are 15 °C higher than those used for Q7 (Fig. 6a). A slightly reduced “temperature shift” of 10 °C was found when 21R1 spectra from Q25 and Q55 proteins were compared (Fig. 6b). An identical behavior (10 °C temperature shift between Q25 and Q55) was also observed for 35R1 where the shortest Q-length was Q25 (Fig. 6c). Together, these data indicate that proteins with different Q-lengths can take up related structural states and that temperature can compensate for the effects of Q-length by shifting the order–disorder equilibrium. We find that a difference of 48 Gln residues (for Httex1 with Q55 and Q7) corresponds to a temperature shift of 15 °C, whereas a difference of 30 Gln residues (for Httex1 with Q55 and Q25) results in a temperature shift of 10 °C. Thus, both cases lead to the estimate that addition of ∼3 Gln residues shifts the order–disorder equilibrium analogous to decreasing the temperature by 1°. In other words, increasing Q-lengths freeze out Httex1 motions and cause rigidification of the protein, thereby likely increasing the lifetime of intramolecular contacts.
Figure 6.
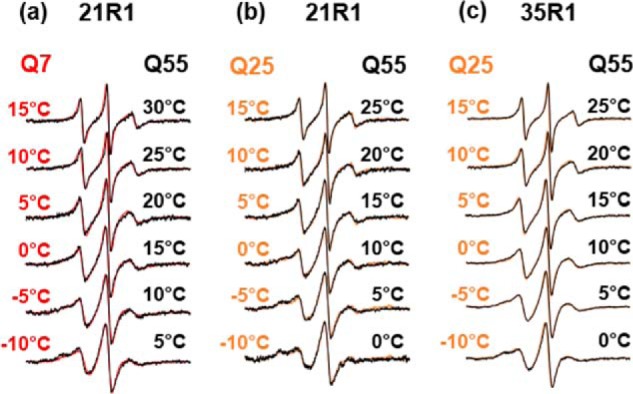
EPR data showing temperature Q-length compensation. Good spectral overlap can be obtained when 21R1 or 35R1 spectra are compared from Httex1 proteins with different Q-lengths if the higher Q-length–containing proteins have their spectra recorded at higher temperature. This “temperature shift” between Q7 and Q55 is 15 °C (a), and the shift between Q25 and Q55 (b and c) is 10 °C. These shifts correspond to about 1/3 °C per Gln.
Discussion
Here, we combined CD, EPR, and NMR spectroscopy to investigate the structural features of monomeric Httex1 as a function of polyQ-length. The bulk of the data were obtained using the readily accessible Trx–Httex1 fusion protein in solution with key results confirmed using Trx-free Httex1 either on beads or free in solution. The CD data show that α-helical content of Httex1 increases with decreasing temperature and increasing Q-length. NMR spectroscopy further reveals that polyQ partakes in this temperature-dependent α-helix formation. However, helical structure is not uniformly adopted throughout the polyQ region. Rather, multiple NMR resonances are observed for the polyQ region, each arising from sequence populations of different helical content. Moreover, EPR amplitudes of spin-labeled residues in Trx–Httex1(Q46) document a mobility gradient ranging from a more structured and presumably more helical N17–polyQ border to a dynamic C-terminal end (Fig. 7a). This mobility gradient is also consistent with the structuring present in flanking regions. EPR amplitudes show that polyQ is flanked by a relatively ordered N17 and a highly dynamic PRD, which is known to contain PPII helical structure and random coil structure (25, 33, 34). Our results concur with prior NMR and X-ray studies (23–25, 35–38), most of which were performed on Httex1-mimicking proteins with short, nonpathogenic polyQ segments. The so far discussed structural and dynamic features would be compatible with a simple model of Httex1 in which a stable N17 α-helical structure propagates into polyQ, where helical structure then begins to fray (Fig. 7a). Perhaps surprisingly, the notion that the N17 is the sole dominant player for structuring proved insufficient for explaining our further results.
Figure 7.
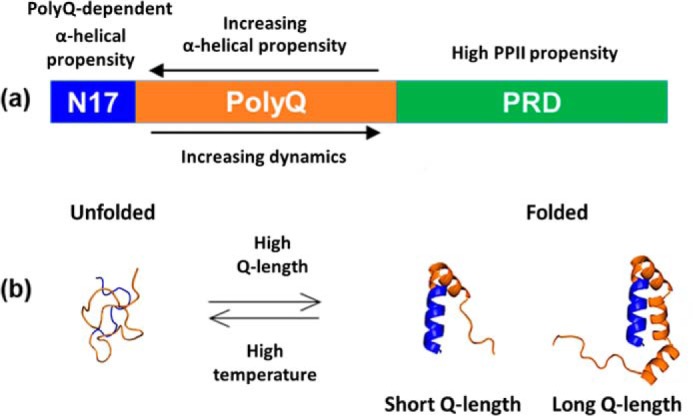
Summary of Httex1 monomer structure. a, Httex1 domain organization with structural features highlighted. b, schematic illustration of the Q-length and temperature-dependent equilibrium between unfolded and folded states. Blue highlights residues in the N17, and orange is used for the polyQ. Not shown is the PRD.
N17 by itself or within Trx–Httex1(Q7) did not exhibit significant α-helical structure as determined by CD and NMR. Only in the context of longer Q-lengths could ordering be detected in N17 and polyQ. This means that a polyQ of sufficient length is required for both regions to adopt helical structure. In addition, a mutual stabilization of N17 and polyQ structuring exists, which must be long-range in nature as it is sensitive to the extension of polyQ at its C-terminal end. EPR spin-labeling analysis of Trx–Httex1(Q46) reveals the co-existence of two structural states in the N17 and the adjacent N-terminal portion of polyQ. One of these states is highly dynamic and largely disordered, whereas the other state is ordered, consistent with α-helical structure. The folding–unfolding transition is governed by temperature and Q-lengths, which affect the relative populations of the respective states. We were able to estimate that each additional Gln residue in the polyQ stabilizes the folded state by ∼0.03 to 0.05 kcal/mol. It follows that the Gln contacts in the folded state are only slightly more favorable than those in the unfolded state (presumably with water). Although this free energy difference was relatively small on a per residue basis, the large number of Gln residues present in Httex1 with pathogenically expanded Q-lengths was sufficient to decisively shift the folding equilibrium toward the folded state. This cumulative effect of multiple Gln residues can be substantial. We found a difference of more than 1 kcal/mol for the stability of the folded state when high and low Q-lengths are compared. Thus, although there is no drastic or highly cooperative conformational change at a particular Q-length threshold, there is a significant cumulative energetic effect when comparing high and low Q-lengths. A similar cumulative effect can also be observed for the temperature–Q-length compensation. We found that the Q-length–dependent shift in equilibrium could be compensated by a temperature increase of about 1 °C for every three added Gln residues. When comparing Httex1 with Q7 to Q55, this temperature-Q-length compensation required a temperature differential of 15 °C. Thus, enhancing the Q-length was equivalent to a substantial freezing out of molecular motions, as long Q-length and low temperature similarly promote structuring and tertiary contact formation. What could be the structural origin for the synergy between N17 and polyQ during helix formation? It cannot be fully excluded that, as added Gln residues enhance polyQ α-helicity, a continuous N17–polyQ helix emerges via a coil–helix transition. However, the possibility of tertiary contacts between domains is better supported by the data in this study and previous studies (17, 19, 29). In such a model, folded N17 and polyQ residues engage in intramolecular contacts that become more extensive and stabilizing as Q-length increases and/or as temperature decreases (Fig. 7b). The relatively strong immobilization seen for the immobile components in the EPR spectra of residues in the N17 and the N-terminal portion of the polyQ (Fig. 2 and Fig. S2) is consistent with this notion. Similarly, tertiary contacts are also part of the tadpole model proposed by Warner et al. (27) and Newcombe et al. (29). Moreover, the distinct changes in NMR spectra of polyQ at 25 and 10 °C (Fig. 3) are compatible with an increased lifetime of such contacts at lower temperatures (slow exchange kinetics). Selective Q-labeling of polyQ further supports this view (24), and we note that a lifetime in the millisecond range may give rise to slow exchange on the NMR chemical shift time scale. The ordered conformations that we found Httex1 to adopt must still be transient and not stable for minutes, as indicated by HDX data showing a lack of persistent hydrogen bonding in both WT and expanded Httex1 on this time scale (29).
Regardless of the precise structure, the folded state of Httex1 must be different from that of a typical globular protein. Folding of the latter is driven by sequestration of hydrophobic residues into the interior of the protein in a process that is characterized by a highly cooperative folding–unfolding transition (39). The folding of Httex1 lacks such cooperativity, as evidenced by the gradual change in temperature-dependent structuring and the lack of a clear transition temperature (Fig. 1). Moreover, the formation of an extensive hydrophobic core is not possible given that the polyQ consists of polar Gln residues and that the N17 has many polar or charged residues. In lieu of extensive hydrophobic interactions, we therefore expect that the folded state is largely stabilized by electrostatic interactions, including hydrogen bonds between Gln residues as well as between Gln residues and the N17. The temperature–Q-length compensation data and the striking similarities among the spectral components from the same sites in different Q-lengths show that similar local conformations are taken up in overlapping protein segments (N17 and N-terminal polyQ regions present in all constructs). Thus, the molecular interactions that stabilize the folded Httex1 state must be similar among the different Q-lengths. This is especially the case in the most N-terminal regions of the polyQ (Fig. 7b). As polyQ-length increases, additional amino acids are available for taking up helical structure, further stabilizing the folded state (Fig. 7b). Several lines of evidence support the notion that longer Q-lengths not only shift the equilibrium toward the folded state but that they also make the α-helical structure more extensive. The CD data indicate that the number of residues becoming helical for longer Q-lengths is larger than the total number of N17 and Gln residues combined for the Q7 protein (Fig. 1f). Furthermore, the 35R1 spectra indicate that significant amounts of ordered helical structure are present for longer Q-length (Fig. 4) even though this position is already outside the Q-region in the Q7 protein. Thus, although the overall structure in the N-terminal regions of the polyQ is similar among the various Q-lengths, the extent to which structuring can further propagate into the C-terminal region of the polyQ increases with Q-length (Fig. 7b).
The Q-length–dependent formation of the folded state also has important biological implications. Because of their drastically different structures, the folded and unfolded forms of Httex1 are expected to have differences in their affinity to cellular binding partners. Considering the wide range of Httex1-interacting proteins (40–42), polyQ-length–dependent folding may modulate these interactions and potentially contribute to toxicity. Because the free energy of the folded state can be more than 1 kcal/mol greater for longer Q-lengths, binding affinities might be altered by this free energy as well. This could lead to significant changes in binding interactions. The difference in monomer structures may also impact its aggregation propensities. The aggregation of Httex1 proceeds via a stepwise mechanism that is initiated by an oligomer predominantly stabilized by α-helical structure in the N-terminal region in solution and on the membrane (37, 43, 44). Moreover, Wetzel and co-workers found concentration-dependent helicity in the N17 (45, 46), signifying that this region becomes more helical with oligomerization. Inasmuch as longer Q-lengths affect the monomer by shifting the local equilibrium toward higher helicities, the increased helical propensity of the monomer may promote the formation of helical oligomers during aggregation. Conversely, disruption of the helical structure in the monomer could oppose Q-length–dependent alterations in binding interactions and reduce Httex1 aggregation propensity. The Q-length–dependent structural differences in Httex1 monomer structure could also in principle be exploited in efforts to specifically target the mutant Httex1 with expanded Q-length. Considering that most Huntington patients have only one mutant allele such a strategy could make it possible to only target the mutant protein without interfering with the normal cellular functions of the WT protein.
Experimental procedures
Protein expression, labeling, and purification
The Trx–Httex1 proteins with different Q-lengths (Q7, Q16, Q25, Q46, and Q55) were expressed using pET32a or pET28a vectors as before (19). Both cysteines of the thioredoxin moiety were mutated to serine (34). Overnight cultures of BL21(DE3) were grown at 37 °C and diluted 50-fold into LB medium containing 100 μg/ml ampicillin (for pET32a) or kanamycin (for pET28a) and grown at 37 °C to 0.6 A600. At this time, expression was induced using 1 mm isopropyl 1-thio-β-d-galactopyranoside at 18 °C typically overnight. Pellets were collected by centrifugation (4500 rpm, 20 min, 4 °C) and either used directly or stored at −80 °C. Pellets were resuspended in 20 mm Tris-HCl, pH 7.4, 300 mm NaCl with 10 mm imidazole containing 1% TritonTM X-100 (Sigma) and 1 mm DTT (ThermoFisher Scientific) for 20 min at room temperature on a rocker. Cell walls were disrupted on ice by sonication using a model XL2000 ultrasonic cell disruptor (MICROSON) three times for 30 s with pulse mode output of 10 watts or until clear lysate was observed. After centrifugation (19,000 rpm, 15 min, 4 °C), the supernatant was incubated for 1 h at 4 °C on a rocker with nickel-nitrilotriacetic acid–agarose beads (Qiagen) packed into an Econo-Pac chromatography column (Bio-Rad). The column was washed with 3 column volumes of 20 mm Tris-HCl, pH 7.4, 300 mm NaCl, 50 mm imidazole, 1 mm DTT, and 2 column volumes of 20 mm Tris-HCl, pH 7.4, 300 mm NaCl, 50 mm imidazole. Purified proteins were eluted using 25 ml of 20 mm Tris-HCl, pH 7.4, 300 mm NaCl, 300 mm imidazole, and spin-labeled by incubation with a 5–15-fold excess of MTSL spin label (Toronto Research Chemicals, Inc., North York, Ontario, Canada) for 1 h at room temperature to generate the new spin-labeled side chain R1. Labeled proteins were diluted 1:10 into 10 mm Tris-HCl, pH 7.4, and then purified on a HiTrap Q XL column (GE Healthcare) using an AKTA FPLC system (Amersham Biosciences). The protein was eluted using 20 mm Tris-HCl, pH 7.4, buffer and a salt gradient from 20 mm to 1 m NaCl. The eluted protein was consequently diluted to ∼30 μm, and then a PD10 column was used to buffer exchange it into 20 mm sodium phosphate, pH 7.4, 150 mm NaCl.
Preparation of Httex1 monomer stably bound to nickel beads
Bead binding of spin-labeled Httex1 monomers was mediated by a His tag that was appended at the C-terminal end of Httex1 in the Trx–Httex1 fusion protein (19). For cleaving of the Trx fusion partner, spin-labeled Trx–Httex1 derivatives were adjusted to 5 μm concentration and subjected to EKMax (Invitrogen) digestion for 50 min using 1 unit of enzyme/ml of reaction volume. The reaction was stopped by addition of 4 m urea, and samples were filtered through 0.2-μm syringe filters. The subsequent purification of Httex1 monomer was performed on a C4 column (15 μm, 300 Å, 250 × 4.60 mm) using an AKTA FPLC system (Amersham Biosciences) with buffer A (99.9% water, 0.1% TFA) and buffer B (90% acetonitrile, 9.9% water, 0.1% TFA). The appropriate fractions were collected and lyophilized followed by storage of lyophilized powder in a vacuum desiccator until further use. The lyophilized powder was treated in 0.5% TFA (v/v) in methanol to disaggregate any preformed seeds (43). The organics were removed under a gentle stream of N2 gas, and the resultant film was resuspended in buffer containing 4 m urea with nickel beads and kept on shaker for 30 min for binding. The protein on the beads was further washed three times with buffer without urea using the centrifugation method, and the bead-bound protein was finally suspended in the appropriate buffer at the desired concentration prior to EPR measurements.
Continuous-wave EPR
All samples were freshly filtered using Amicon Ultra-4 100,000 MWCO centrifugal filters (Millipore) to remove potential oligomers. This step was performed at 4 °C, as lower temperature is the more stringent condition for oligomerization (47, 48). Spin-labeled samples were prepared at 15 μm or less in 20 mm sodium phosphate, pH 7.4, 150 mm NaCl, 25% glycerol and loaded into glass capillaries (0.6-mm inner diameter × 0.84-mm outer diameter, VitroCom, Mt. Lakes, NJ). The addition of glycerol, which was added to reduce tumbling, did not affect the temperature-dependent secondary structure formation according to CD. EPR spectra were recorded on an X-band Bruker EMX spectrometer (Bruker Biospin Corp.) equipped with an ER 4131VT temperature controller and HS cavity. EPR spectra were recorded at an incident microwave power of 3.20 milliwatts for −10, −5, and 0 °C and 12.60 milliwatts for 5, 10, 15, 20, 25, 30, and 37 °C. All spectra are shown at 100 G scan width. In some cases, spectra were spin-normalized by double integration, which was used to generate spectra that are scaled to represent the same number of spins. The normalized spectra were used for the amplitude plots as well as the estimation of percentages of individual mobile and immobile components, which were obtained by spectral subtraction. Toward this end, the spectra for the same sites in different Q-length–containing proteins were subtracted from each other to generate the respective mobile and immobile components. Using this basis set, spectral subtractions were performed to obtain relative amounts of mobile and immobile components in the respective EPR spectra. The relative contributions of mobile and immobile components were then converted into an equilibrium constant (Keq) for a simple two-state system. Free energies were then determined using ΔG = −RT ln Keq.
CD measurements
CD was performed using a Jasco 815 spectropolarimeter (Jasco Inc., Easton, MD). Temperature was regulated by a Jasco PFD-425S Peltier type FDCD attachment connected to a PolyScience recirculator (PolyScience, Niles, IL). For spectra at each temperature, measurements were taken every 1 nm from 200 to 260 nm, scanning at 50 nm/min with an averaging time of 1 s. Spectra were obtained from samples in 20 mm phosphate, pH 7.4, and 150 mm NaCl. For spectra spanning from 190 to 260 nm, the same protocol was used except that the buffer did not contain NaCl. Ten scans, or 12 scans for 190–260-nm readings, were averaged for each sample spectrum; background spectra were obtained by averaging 20 scans, and the appropriate ones were subtracted from the respective sample spectra. Spectra were smoothed by the Savitsky-Golay algorithm. Single-wavelength readings at 222 nm were obtained at −10, 0, 4, 10, 20, 30, and 37 °C. In each case, MRETrx–Httex1 was measured every 1 s for 300 s; the 301 readings for each sample at each temperature were averaged, and MRETrx was subtracted. The number of amino acids in each sample to experience a change in helicity from −10 to 37 °C was estimated using a previously developed helix–coil transition model, which gives the change in fraction of helicity (ΔfHelix) by Equation 1 (19, 49, 50),
| (Eq. 1) |
where fHelix at each temperature is given as shown in Equation 2,
| (Eq. 2) |
where MREHttex1 describes the helix–coil transition in Httex1, obtained from the difference between MRETrx–Httex1 at 222 nm of the fusion protein at the given temperature and the product of MRETrx at 222 nm at the same temperature and the fraction of residues comprised by Trx in that particular construct, see Equations 3 and 4,
| (Eq. 3) |
| (Eq. 4) |
where T is temperature in °C and Nr is the number of residues.
To calculate an equilibrium of the two-states model, percent α-helicity was calculated using the relation of MREHttex1 = 0 and −34,700 (degrees cm2 dmol−1) for 0 and 100% helicity, respectively.
NMR measurements
Trx–Httex1(Q46) samples were prepared at a concentration of 20 μm in either 20 mm NaH2PO4/Na2HPO4, pH 7.4, 6% D2O solution, or 25 mm MES, pH 6.0, 25 mm NaCl, 0.02% w/v NaN3, 6% D2O solution. In the MES buffer, samples of Httex1(Q46) and Trx–Httex1(Q7) were also prepared at concentrations of 12 and 300 μm, respectively. NMR experiments on 15N- or 13C/15N-labeled proteins were performed on a cryoprobe-equipped Bruker Avance 700 spectrometer. For Trx–Httex1(Q46) and Httex1(Q46), HSQC, HNCA, and CBCA(CO)NH experiments were carried out. For Trx–Httex1(Q7), the HNCACB experiment was additionally acquired. To increase spectral resolution, HNCA experiments of Trx–Httex1(Q7) were acquired with 50 × 92 × 768 complex points (t1(Cα) = 10.0 ms, t2(N) = 49.7 ms, and t3(HN) = 61.4 ms) in a semi-constant time mode (51, 52). For Trx–Httex1(Q46) and Httex1(Q46), typical acquisition times of HSQC and HNCA experiments were 2.5 and 20 h, respectively. NMR data were processed and analyzed with the nmrPipe package (53). Backbone assignment of Trx–Httex1(Q7) was carried out with the program CARA.
Author contributions
J. M. B.-A., N. C. K., T. S. U., and R. L. formal analysis; J. M. B.-A., N. C. K., T. S., N. K. P., and A. J. S. investigation; J. M. B.-A., N. C. K., and R. L. methodology; J. M. B.-A., N. C. K., T. S. U., and R. L. writing-review and editing; N. K. P., T. S. U., and R. L. validation; R. L. conceptualization; R. L. supervision; R. L. funding acquisition; R. L. writing-original draft.
Supplementary Material
This work was supported in part by Cure Huntington's Disease Initiative (CHDI) Award A-12640 and National Institutes of Health Grant NS084345. The authors declare that they have no conflicts of interest with the contents of this article. The content is solely the responsibility of the authors and does not necessarily represent the official views of the National Institutes of Health.
This article contains Figs. S1–S4, Table S1, and supporting Refs. 1 and 2.
The NMR chemical shift data of this paper are available from the Biological Magnetic Resonance Data Bank under BMRB accession number 27636.
- HD
- Huntington's disease
- Trx
- thioredoxin
- polyQ
- polyglutamine
- N17
- N terminus containing 17 amino acids
- PRD
- proline-rich domain
- MRE
- mean residue ellipticity
- HDX
- hydrogen–deuterium exchange.
References
- 1. Hoffner G., and Djian P. (2015) Polyglutamine aggregation in Huntington disease: does structure determine toxicity? Mol. Neurobiol. 52, 1297–1314 10.1007/s12035-014-8932-1 [DOI] [PubMed] [Google Scholar]
- 2. Margulis B. A., Vigont V., Lazarev V. F., Kaznacheyeva E. V., and Guzhova I. V. (2013) Pharmacological protein targets in polyglutamine diseases: mutant polypeptides and their interactors. FEBS Lett. 587, 1997–2007 10.1016/j.febslet.2013.05.022 [DOI] [PubMed] [Google Scholar]
- 3. Rosenblatt A., Kumar B. V., Mo A., Welsh C. S., Margolis R. L., and Ross C. A. (2012) Age, CAG repeat length, and clinical progression in Huntington's disease. Mov. Disord. 27, 272–276 10.1002/mds.24024 [DOI] [PubMed] [Google Scholar]
- 4. Walker F. O. (2007) Huntington's disease. Lancet 369, 218–228 10.1016/S0140-6736(07)60111-1 [DOI] [PubMed] [Google Scholar]
- 5. Kaliszewski M., Knott A. B., and Bossy-Wetzel E. (2015) Primary cilia and autophagic dysfunction in Huntington's disease. Cell Death Differ. 22, 1413–1424 10.1038/cdd.2015.80 [DOI] [PMC free article] [PubMed] [Google Scholar]
- 6. Nagai Y., Inui T., Popiel H. A., Fujikake N., Hasegawa K., Urade Y., Goto Y., Naiki H., and Toda T. (2007) A toxic monomeric conformer of the polyglutamine protein. Nat. Struct. Mol. Biol. 14, 332–340 10.1038/nsmb1215 [DOI] [PubMed] [Google Scholar]
- 7. Miller J., Arrasate M., Brooks E., Libeu C. P., Legleiter J., Hatters D., Curtis J., Cheung K., Krishnan P., Mitra S., Widjaja K., Shaby B. A., Lotz G. P., Newhouse Y., and Mitchell E. J., et al. (2011) Identifying polyglutamine protein species in situ that best predict neurodegeneration. Nat. Chem. Biol. 7, 925–934 10.1038/nchembio.694 [DOI] [PMC free article] [PubMed] [Google Scholar]
- 8. Clabough E. B. (2013) Huntington's disease: the past, present, and future search for disease modifiers. Yale J. Biol. Med. 86, 217–233 [PMC free article] [PubMed] [Google Scholar]
- 9. Truant R., Atwal R. S., Desmond C., Munsie L., and Tran T. (2008) Huntington's disease: revisiting the aggregation hypothesis in polyglutamine neurodegenerative diseases. FEBS J. 275, 4252–4262 10.1111/j.1742-4658.2008.06561.x [DOI] [PubMed] [Google Scholar]
- 10. Zhang Q. C., Yeh T. L., Leyva A., Frank L. G., Miller J., Kim Y. E., Langen R., Finkbeiner S., Amzel M. L., Ross C. A., and Poirier M. A. (2011) A compact β model of huntingtin toxicity. J. Biol. Chem. 286, 8188–8196 10.1074/jbc.M110.192013 [DOI] [PMC free article] [PubMed] [Google Scholar]
- 11. Schaffar G., Breuer P., Boteva R., Behrends C., Tzvetkov N., Strippel N., Sakahira H., Siegers K., Hayer-Hartl M., and Hartl F. U. (2004) Cellular toxicity of polyglutamine expansion proteins: mechanism of transcription factor deactivation. Mol. Cell 15, 95–105 10.1016/j.molcel.2004.06.029 [DOI] [PubMed] [Google Scholar]
- 12. Hoffner G., and Djian P. (2014) Monomeric, oligomeric and polymeric proteins in Huntington disease and other diseases of polyglutamine expansion. Brain Sci.4, 91–122 10.3390/brainsci4010091 [DOI] [PMC free article] [PubMed] [Google Scholar]
- 13. Modregger J., DiProspero N. A., Charles V., Tagle D. A., and Plomann M. (2002) PACSIN 1 interacts with huntingtin and is absent from synaptic varicosities in presymptomatic Huntington's disease brains. Hum. Mol. Genet. 11, 2547–2558 10.1093/hmg/11.21.2547 [DOI] [PubMed] [Google Scholar]
- 14. Cornett J., Cao F., Wang C. E., Ross C. A., Bates G. P., Li S. H., and Li X. J. (2005) Polyglutamine expansion of huntingtin impairs its nuclear export. Nat. Genet. 37, 198–204 10.1038/ng1503 [DOI] [PubMed] [Google Scholar]
- 15. Hoffner G., Island M. L., and Djian P. (2005) Purification of neuronal inclusions of patients with Huntington's disease reveals a broad range of N-terminal fragments of expanded huntingtin and insoluble polymers. J. Neurochem. 95, 125–136 10.1111/j.1471-4159.2005.03348.x [DOI] [PubMed] [Google Scholar]
- 16. Mangiarini L., Sathasivam K., Seller M., Cozens B., Harper A., Hetherington C., Lawton M., Trottier Y., Lehrach H., Davies S. W., and Bates G. P. (1996) Exon 1 of the HD gene with an expanded CAG repeat is sufficient to cause a progressive neurological phenotype in transgenic mice. Cell 87, 493–506 10.1016/S0092-8674(00)81369-0 [DOI] [PubMed] [Google Scholar]
- 17. Caron N. S., Desmond C. R., Xia J., and Truant R. (2013) Polyglutamine domain flexibility mediates the proximity between flanking sequences in huntingtin. Proc. Natl. Acad. Sci. U.S.A. 110, 14610–14615 10.1073/pnas.1301342110 [DOI] [PMC free article] [PubMed] [Google Scholar]
- 18. Cui X., Liang Q., Liang Y., Lu M., Ding Y., and Lu B. (2014) TR-FRET assays of Huntingtin protein fragments reveal temperature and polyQ-length-dependent conformational changes. Sci. Rep. 4, 5601 [DOI] [PMC free article] [PubMed] [Google Scholar]
- 19. Fodale V., Kegulian N. C., Verani M., Cariulo C., Azzollini L., Petricca L., Daldin M., Boggio R., Padova A., Kuhn R., Pacifici R., Macdonald D., Schoenfeld R. C., Park H., and Isas J. M., et al. (2014) Polyglutamine- and temperature-dependent conformational rigidity in mutant huntingtin revealed by immunoassays and circular dichroism spectroscopy. PLoS ONE 9, e112262 10.1371/journal.pone.0112262 [DOI] [PMC free article] [PubMed] [Google Scholar]
- 20. Deguire S. M., Ruggeri F. S., Fares M. B., Chiki A., Cendrowska U., Dietler G., and Lashuel H. A. (September 5, 2018) N-terminal Huntingtin (Htt) phosphorylation is a molecular switch regulating Htt aggregation, helical conformation, internalization, and nuclear targeting. J. Biol. Chem. 293, 18540–18558 10.1074/jbc.RA118.004621 [DOI] [PMC free article] [PubMed] [Google Scholar]
- 21. Gu X., Greiner E. R., Mishra R., Kodali R., Osmand A., Finkbeiner S., Steffan J. S., Thompson L. M., Wetzel R., and Yang X. W. (2009) Serines 13 and 16 are critical determinants of full-length human mutant huntingtin induced disease pathogenesis in HD mice. Neuron 64,828–840 10.1016/j.neuron.2009.11.020 [DOI] [PMC free article] [PubMed] [Google Scholar]
- 22. Chiki A., DeGuire S. M., Ruggeri F. S., Sanfelice D., Ansaloni A., Wang Z. M., Cendrowska U., Burai R., Vieweg S., Pastore A., Dietler G., and Lashuel H. A. (2017) Mutant Exon1 Huntingtin aggregation is regulated by T3 phosphorylation-induced structural changes and crosstalk between T3 phosphorylation and acetylation at K6. Angew. Chem. Int. Ed. Engl. 56, 5202–5207 10.1002/anie.201611750 [DOI] [PubMed] [Google Scholar]
- 23. Baias M., Smith P. E., Shen K., Joachimiak L. A., Źerko S., Koźmiński W., Frydman J., and Frydman L. (2017) Structure and dynamics of the Huntingtin Exon-1 N-terminus: a solution NMR perspective. J. Am. Chem. Soc. 139, 1168–1176 10.1021/jacs.6b10893 [DOI] [PubMed] [Google Scholar]
- 24. Urbanek A., Morató A., Allemand F., Delaforge E., Fournet A., Popovic M., Delbecq S., Sibille N., and Bernadó P. (2018) A general strategy to access structural information at atomic resolution in polyglutamine homorepeats. Angew. Chem. Int. Ed. Engl. 57, 3598–3601 10.1002/anie.201711530 [DOI] [PMC free article] [PubMed] [Google Scholar]
- 25. Kim M. W., Chelliah Y., Kim S. W., Otwinowski Z., and Bezprozvanny I. (2009) Secondary structure of Huntingtin amino-terminal region. Structure 17,1205–1212 10.1016/j.str.2009.08.002 [DOI] [PMC free article] [PubMed] [Google Scholar]
- 26. Kang H., Vázquez F. X., Zhang L., Das P., Toledo-Sherman L., Luan B., Levitt M., and Zhou R. (2017) Emerging β-sheet rich conformations in supercompact Huntingtin Exon-1 mutant structures. J. Am. Chem. Soc. 139, 8820–8827 10.1021/jacs.7b00838 [DOI] [PMC free article] [PubMed] [Google Scholar]
- 27. Warner J. B. 4th, Ruff K. M., Tan P. S., Lemke E. A., Pappu R. V., and Lashuel H. A. (2017) Monomeric Huntingtin Exon 1 has similar overall structural features for wild-type and pathological polyglutamine lengths. J. Am. Chem. Soc. 139, 14456–14469 10.1021/jacs.7b06659 [DOI] [PMC free article] [PubMed] [Google Scholar]
- 28. Williamson T. E., Vitalis A., Crick S. L., and Pappu R. V. (2010) Modulation of polyglutamine conformations and dimer formation by the N-terminus of huntingtin. J. Mol. Biol. 396, 1295–1309 10.1016/j.jmb.2009.12.017 [DOI] [PMC free article] [PubMed] [Google Scholar]
- 29. Newcombe E. A., Ruff K. M., Sethi A., Ormsby A. R., Ramdzan Y. M., Fox A., Purcell A. W., Gooley P. R., Pappu R. V., and Hatters D. M. (2018) Tadpole-like conformations of Huntingtin Exon 1 are characterized by conformational heterogeneity that persists regardless of polyglutamine length. J. Mol. Biol. 430, 1442–1458 10.1016/j.jmb.2018.03.031 [DOI] [PMC free article] [PubMed] [Google Scholar]
- 30. Bennett M. J., Huey-Tubman K. E., Herr A. B., West A. P. Jr., Ross S. A., and Bjorkman P. J. (2002) A linear lattice model for polyglutamine in CAG-expansion diseases. Proc. Natl. Acad. Sci. U.S.A. 99, 11634–11639 10.1073/pnas.182393899 [DOI] [PMC free article] [PubMed] [Google Scholar]
- 31. Owens G. E., New D. M., West A. P. Jr., and Bjorkman P. J. (2015) Anti-PolyQ antibodies recognize a short PolyQ stretch in both normal and mutant Huntingtin exon 1. J. Mol. Biol. 427, 2507–2519 10.1016/j.jmb.2015.05.023 [DOI] [PMC free article] [PubMed] [Google Scholar]
- 32. Spera S. and Bax A. (1991) Empirical correlation between protein backbone conformation and C-α and C-β C-13 nuclear-magnetic-resonance chemical-shifts. J. Am. Chem. Soc. 113, 5490–5492 10.1021/ja00014a071 [DOI] [Google Scholar]
- 33. Isas J. M., Langen R., and Siemer A. B. (2015) Solid-state nuclear magnetic resonance on the static and dynamic domains of Huntingtin Exon-1 fibrils. Biochemistry 54, 3942–3949 10.1021/acs.biochem.5b00281 [DOI] [PMC free article] [PubMed] [Google Scholar]
- 34. Bugg C. W., Isas J. M., Fischer T., Patterson P. H., and Langen R. (2012) Structural features and domain organization of huntingtin fibrils. J. Biol. Chem. 287, 31739–31746 10.1074/jbc.M112.353839 [DOI] [PMC free article] [PubMed] [Google Scholar]
- 35. Kim M. (2013) β conformation of polyglutamine track revealed by a crystal structure of Huntingtin N-terminal region with insertion of three histidine residues. Prion 7, 221–228 10.4161/pri.23807 [DOI] [PMC free article] [PubMed] [Google Scholar]
- 36. Peters-Libeu C., Miller J., Rutenber E., Newhouse Y., Krishnan P., Cheung K., Hatters D., Brooks E., Widjaja K., Tran T., Mitra S., Arrasate M., Mosquera L. A., Taylor D., Weisgraber K. H., and Finkbeiner S. (2012) Disease-associated polyglutamine stretches in monomeric huntingtin adopt a compact structure. J. Mol. Biol. 421, 587–600 10.1016/j.jmb.2012.01.034 [DOI] [PMC free article] [PubMed] [Google Scholar]
- 37. Sivanandam V. N., Jayaraman M., Hoop C. L., Kodali R., Wetzel R., and van der Wel P. C. (2011) The aggregation-enhancing huntingtin N terminus is helical in amyloid fibrils. J. Am. Chem. Soc. 133, 4558–4566 10.1021/ja110715f [DOI] [PMC free article] [PubMed] [Google Scholar]
- 38. De Genst E., Chirgadze D. Y., Klein F. A., Butler D. C., Matak-Vinković D., Trottier Y., Huston J. S., Messer A., and Dobson C. M. (2015) Structure of a single-chain Fv bound to the 17 N-terminal residues of huntingtin provides insights into pathogenic amyloid formation and suppression. J. Mol. Biol. 427, 2166–2178 10.1016/j.jmb.2015.03.021 [DOI] [PMC free article] [PubMed] [Google Scholar]
- 39. Crampin J., Nicholson B. H., and Robson B. (1978) Protein folding and heterogeneity inside globular proteins. Nature 272, 558–560 10.1038/272558a0 [DOI] [PubMed] [Google Scholar]
- 40. Harjes P., and Wanker E. E. (2003) The hunt for huntingtin function: interaction partners tell many different stories. Trends Biochem. Sci. 28, 425–433 10.1016/S0968-0004(03)00168-3 [DOI] [PubMed] [Google Scholar]
- 41. Sittler A., Wälter S., Wedemeyer N., Hasenbank R., Scherzinger E., Eickhoff H., Bates G. P., Lehrach H., and Wanker E. E. (1998) SH3GL3 associates with the Huntingtin exon 1 protein and promotes the formation of polyGln-containing protein aggregates. Mol. Cell 2, 427–436 10.1016/S1097-2765(00)80142-2 [DOI] [PubMed] [Google Scholar]
- 42. Tam S., Spiess C., Auyeung W., Joachimiak L., Chen B., Poirier M. A., and Frydman J. (2009) The chaperonin TRiC blocks a huntingtin sequence element that promotes the conformational switch to aggregation. Nat. Struct. Mol. Biol. 16, 1279–1285 10.1038/nsmb.1700 [DOI] [PMC free article] [PubMed] [Google Scholar]
- 43. Pandey N. K., Isas J. M., Rawat A., Lee R. V., Langen J., Pandey P., and Langen R. (2018) The 17-residue-long N terminus in huntingtin controls stepwise aggregation in solution and on membranes via different mechanisms. J. Biol. Chem. 293, 2597–2605 10.1074/jbc.M117.813667 [DOI] [PMC free article] [PubMed] [Google Scholar]
- 44. Ceccon A., Schmidt T., Tugarinov V., Kotler S. A., Schwieters C. D., and Clore G. M. (2018) Interaction of Huntingtin Exon-1 peptides with lipid-based micellar nanoparticles probed by solution NMR and Q-band pulsed EPR. J. Am. Chem. Soc. 140, 6199–6202 10.1021/jacs.8b02619 [DOI] [PMC free article] [PubMed] [Google Scholar]
- 45. Jayaraman M., Kodali R., Sahoo B., Thakur A. K., Mayasundari A., Mishra R., Peterson C. B., and Wetzel R. (2012) Slow amyloid nucleation via α-helix-rich oligomeric intermediates in short polyglutamine-containing huntingtin fragments. J. Mol. Biol. 415, 881–899 10.1016/j.jmb.2011.12.010 [DOI] [PMC free article] [PubMed] [Google Scholar]
- 46. Jayaraman M., Mishra R., Kodali R., Thakur A. K., Koharudin L. M., Gronenborn A. M., and Wetzel R. (2012) Kinetically competing huntingtin aggregation pathways control amyloid polymorphism and properties. Biochemistry 51, 2706–2716 10.1021/bi3000929 [DOI] [PMC free article] [PubMed] [Google Scholar]
- 47. Crick S. L., Ruff K. M., Garai K., Frieden C., and Pappu R. V. (2013) Unmasking the roles of N- and C-terminal flanking sequences from exon 1 of huntingtin as modulators of polyglutamine aggregation. Proc. Natl. Acad. Sci. U.S.A. 110, 20075–20080 10.1073/pnas.1320626110 [DOI] [PMC free article] [PubMed] [Google Scholar]
- 48. Posey A. E., Ruff K. M., Harmon T. S., Crick S. L., Li A., Diamond M. I., and Pappu R. V. (2018) Profilin reduces aggregation and phase separation of huntingtin N-terminal fragments by preferentially binding to soluble monomers and oligomers. J. Biol. Chem. 293, 3734–3746 10.1074/jbc.RA117.000357 [DOI] [PMC free article] [PubMed] [Google Scholar]
- 49. Luo P., and Baldwin R. L. (1997) Mechanism of helix induction by trifluoroethanol: a framework for extrapolating the helix-forming properties of peptides from trifluoroethanol/water mixtures back to water. Biochemistry 36, 8413–8421 10.1021/bi9707133 [DOI] [PubMed] [Google Scholar]
- 50. Jayasinghe S. A., and Langen R. (2005) Lipid membranes modulate the structure of islet amyloid polypeptide. Biochemistry 44, 12113–12119 10.1021/bi050840w [DOI] [PubMed] [Google Scholar]
- 51. Logan T. M., Olejniczak E. T., Xu R. X., and Fesik S. W. (1993) A general-method for assigning Nmr-spectra of denatured proteins using 3d Hc(Co)Nh-Tocsy triple resonance experiments. J. Biomol. NMR 3, 225–231 [DOI] [PubMed] [Google Scholar]
- 52. Grzesiek S., and Bax A. (1993) Amino-acid type determination in the sequential assignment procedure of uniformly C-13/N-15-enriched proteins. J. Biomol. NMR 3, 185–204 [DOI] [PubMed] [Google Scholar]
- 53. Delaglio F., Grzesiek S., Vuister G. W., Zhu G., Pfeifer J., and Bax A. (1995) Nmrpipe–a multidimensional spectral processing system based on unix pipes. J. Biomol. NMR 6, 277–293 [DOI] [PubMed] [Google Scholar]
Associated Data
This section collects any data citations, data availability statements, or supplementary materials included in this article.