Abstract
Helminth.net (www.helminth.net) is a web-based resource that was launched in 2000 as simply ‘Nematode.net’ to host and investigate gene sequences from nematode genomes. Over the years it has evolved to become the moniker for a collection of databases: Nematode.net and Trematode.net. These databases host information for 73 nematode (roundworms) and 17 trematode (flatworms) species and serve as backbone for a number of tools that allow users to query slices of the data for multifactorial combinations of species-omics properties. Recent focus has been on inclusion of gene and protein expression data, population genomics and cross-kingdom interactions (metagenomics datasets). This chapter describes the website, the available tools and some of the new features.
Keywords: Nematodes, Trematodes, Database, Search, Genome Browser, BLAST, Functional Annotation, Transcriptome, Proteome, Metagenome
1. Introduction
The website Nematode.net was established in 2000 as an outgrowth of the parasitic nematode transcriptomic project at Washington University’s Genome Institute (WUGI). Over the next decade it developed into a specialty repository that made accessible the rapidly expanding nucleotide sequence data and related resources from species across the phylum Nematoda. Seventeen year later, it is a moniker for a collection of databases, Helminth.net, for the two main metazoan parasitic phyla Nematoda (roundworms) and Platyhelminthes (flatworms). Updates on development and improvements have been provided in 2004[1], 2008[2], 2012[3] and 2015[4] communicating to the community information needed to facilitate dissemination of diverse datasets in a useful and usage-friendly manner. Bioinformatics tools employed to access and/or analyze the omics datasets have also been developed (NemaPath[5], HelmCoP[6], modDFS[7] and TL-microbiome[8]) and are discussed in the appropriate sections below. A very detailed bioinformatics training protocol we have developed as part of our ‘Bioinformatics Workshop for Helminth Genomics’ that was held at the Washington University’s Genome Institute in 2015 and an ‘Introduction to Nematodes’ lecture in six languages, are both provided in the left dropdown menu under “Education”. The dropdown menu on the left also provides access to species hub pages that summarize the data available for each species. The Sitemap (Fig. 1, Fig. 2) includes a summary of all main pages that can be accessed from the grey bar on the top for each of the two databases. This chapter provides detailed methods that outline the steps involved in navigating the web site and in retrieving information from the database.
Figure 1. Sitemap of Nematode.net.
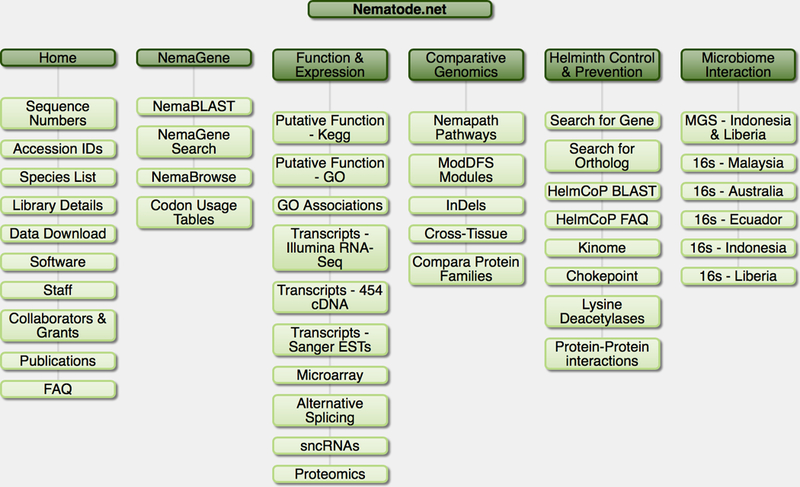
Shown are the tabs of the main navigation bar on the main page and the subcategories revealed by clicking on these tabs.
Figure 2. Sitemap of Trematode.net.
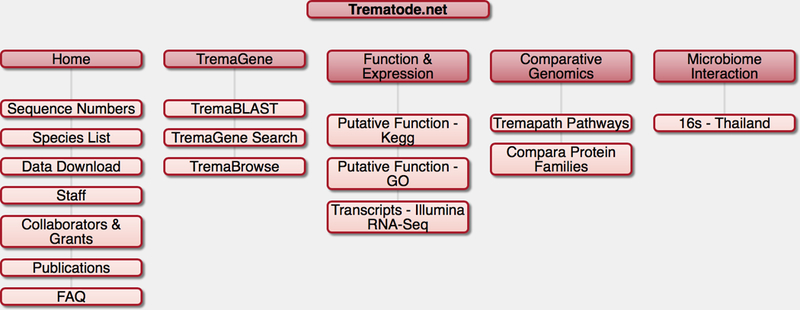
Shown are the tabs of the main navigation bar on the main page and the subcategories revealed by clicking on these tabs.
2. Materials
The following is needed to access, navigate and extract information from the website:
-
–
Device: Computer (desktop or laptop), tablet or smartphone.
-
–
Internet access
-
–
Internet browser (designed to work on Firefox, Safari, Internet Explorer and Chrome)
3. Methods
3.1. NemaGene & TremaGene
NemaGene (http://nematode.net/NemaGene.html) and TremaGene (http://trematode.net/TremaGene.html) are collections of transcript assembly contigs and genes produced and annotated at the McDonnell Genome Institute (MGI) or published by other researchers. Functional annotations are assigned by sequence similarity searches using InterProScan (software version 4.8, InterPro database release 32.0) [9,10] and WU-BLAST 2.0 [11] and include annotation with InterPro (IPR) ids, Gene Ontology (GO) terms [12] and KEGG Orthology IDs (KO) [13]. NemaGene currently hosts 1,456,372 entries spanning 73 species and TremaGene holds 253,360 entries spanning 12 species (7 are in progress and will become available in the near future; Fasciola gigantica, Fasciolopsis buski, Opisthorchis viverrini, Paragonimus westermani, P. kellicotti, P. miyazaki, and P. heterotremus).
Access to N/Tr- emaGene frequently comes from other tools within the Helminth.net sites such as the contig links from N/Tr- emaPath [5] which directly jump to the details pages that are the end point of a N/Tr- emaGene search, or from external sites. But the N/Tr- emaGene Search tool can also be used to extract custom slices of our database using available annotations as filters. This tool is also very useful for retrieving the full protein or nucleotide fasta of our genesets, or of a user-defined slice.
NemaGene can be searched using InterPro, GO and/or KO id filters. NemaGene is accessed via the link provided above, or via NemaGene Search available from the NemaGene menu. First click on the [+] Expand label for the Species selection section and select 1 or more species to start your query. After selecting the species of interest, expand the sections below to set specific filters you’d like to apply. You’re able to request a specific gene name (or comma-delimited list of gene names), orthologous protein families, InterPro id, GO term and/or KO id. Comma-delimited lists of any of those ids are also allowed as input. Filtering on multiple ids of a single type will return genes/transcripts annotated by any of those ids (i.e. a union set), while setting filters using 2 or more id types (i.e. InterPro id + KO id) each gene or transcript returned will be required to have at least one id from each of the supplied lists (Fig. 3).
Figure 3. Input selection for NemaGene.
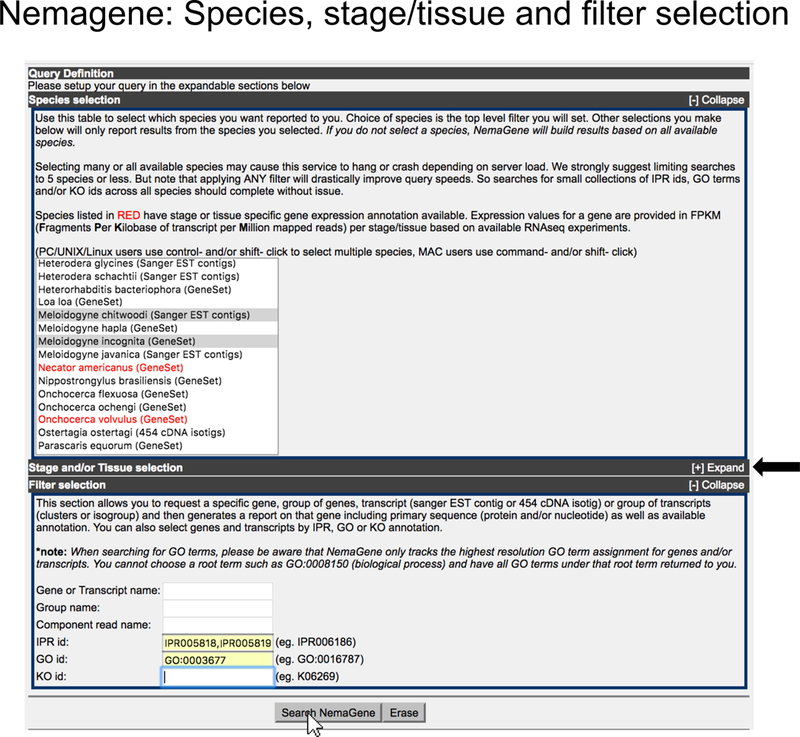
On the main NemaGene page, the user can select one of more species, stage and/or tissue, and different combinations of filters. Clicking on “Search NemaGene” button (shown by a white arrow pointer) submits the input to NemaGene.
This will then lead to a page showing the slice of resulting filtered data retrieved from NemaGene (Fig. 4A). The Query Definition section now displays the query that was made to extract the results shown. Below this, the Data Download section provides links to download the full fasta for all the genes/transcripts that were requested. The Results section will list all the resulting genes and/or transcripts organized by species and then by group if available (software used to generate orthologous protein family groups include OrthoMCL[14] or InParanoid[15]). Each gene or transcript name is a link to a final detail page showing the available annotations for that entity (Fig. 4B). The user can also download that single entity or directly forward its sequence to NemaBlast for further analysis. For more information on NemaGene and the available annotations see the NemaGene FAQ.
Figure 4. NemaGene results.
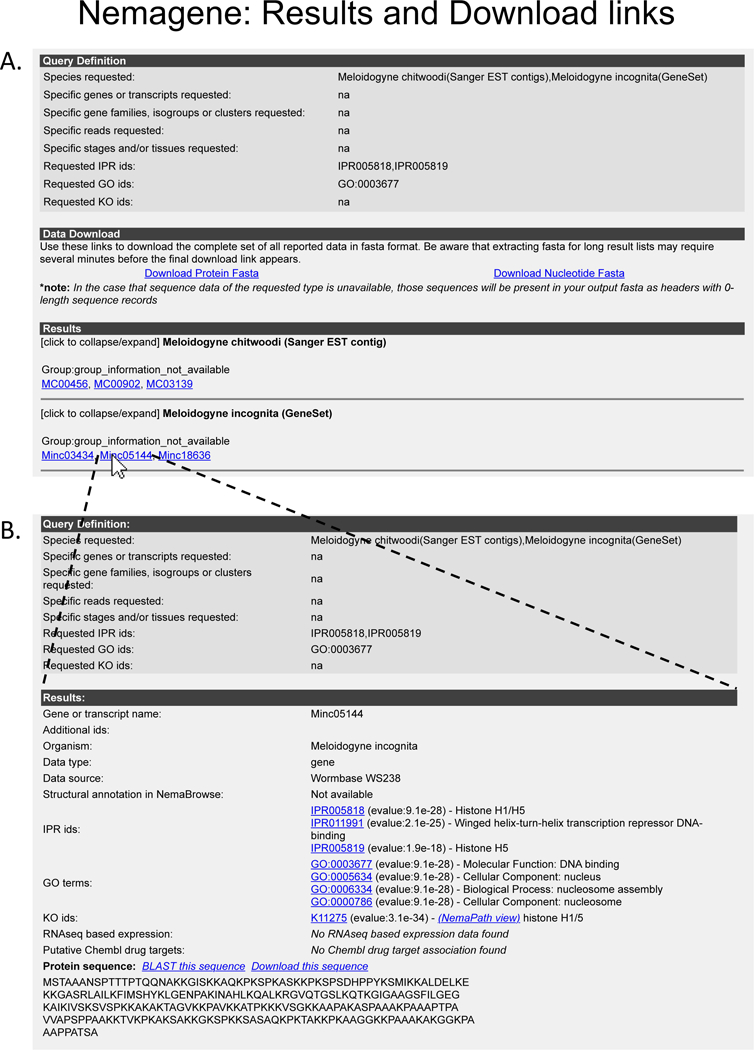
(A) The first result page on submitting input (Fig. 3) shows the details of the submitted query, the download links in both protein and nucleotide sequences of the results, and links to detail pages for each of the resulting genes(s). (B) The detail page of the results showing sequence and annotation for the selected gene.
3.2. NemaBlast & TremaBlast
NemaBlast (http://nematode.net/NemaBlast.html) and TremaBlast (http://trematode.net/TremaBlast.html) enable visitors to search for a sequence of interest against a custom database they define. Both services use WU-BLAST 2.0 for generating alignments.
NemaBlast maintains two collections for mapping. The first comprises Expressed Sequence Tag (EST) reads grouped by library. This set represents all EST reads produced for species we’ve sequenced, grouped by species and sequencing library, allowing the user to mix and match in the creation of their search space. Assembled EST contigs are not hosted by NCBI therefore we are providing the annotated Sanger based assembled transcripts to the community. The ‘EST reads grouped by library’ collection contains 275,850 EST sequences from 132 libraries across 31 nematode species. The second collection contains assembled transcript contigs, isotigs and genes. This collection provides a view closer to the full gene sets for the species we are hosting. The complete database to blast search against contains all 73 nematode species. Some species have multiple entries because users can select to search against a transcript or a gene dataset.
TremaBlast allows users to search against the protein sets available in TremaGene. Currently this includes 221,003 protein sequences spanning 12 trematode species. The user can select any combination of these species to form the search space for this alignment.
An example illustrating how to use NemaBlast is presented in Fig. 5 and Fig. 6. To use NemaBlast the user enters a query sequence, then selects the blast program to use - BLASTX if the query is nucleotide data; BLASTP if the query is amino acid sequence. The user then selects whether they’d like to filter the query for low-complexity sequence using SEG [16] and also whether they want to mask the query using RepeatMasker[17]. Then they indicate the combination of species they’d like to map against and click the ‘BLAST Search’ button. Search results in the form of standard WU-BLAST 2.0 text output will be emailed to the address provided in the form.
Figure 5. Building NemaBlast query page.
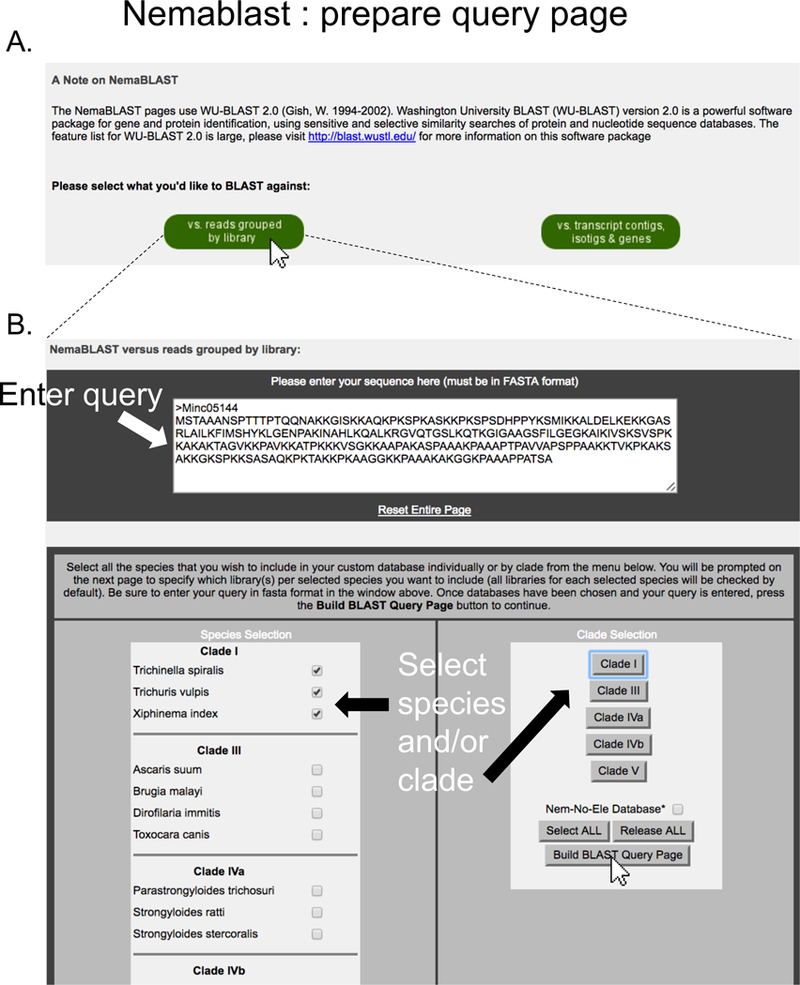
(A) On the main NemaBlast page, the user indicates whether they want to search the reads database or the transcript database. The illustrated example shows a search in the reads database (indicated by a white arrow pointer on the corresponding button). This leads to an intermediate page (B) where the user enters the query sequence and selects the species/clades of interest that will form the search database.
Figure 6. Setting BLAST options and executing NemaBlast search.
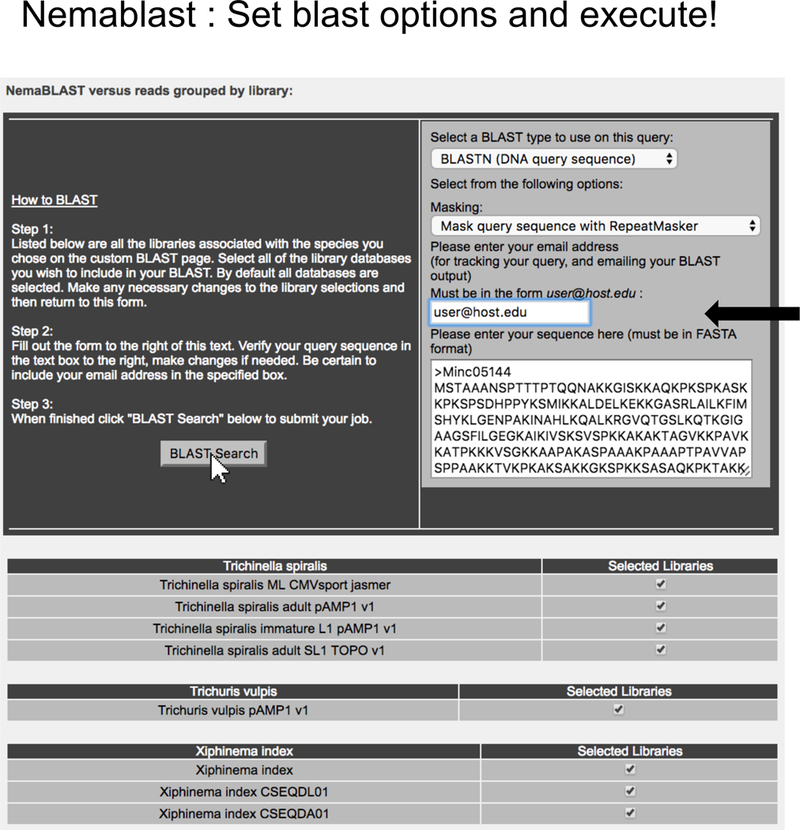
NemaBlast submission page with the relevant choices for BLAST program and sequence masking. The results in the standard WU-BLAST 2.0 format are sent to the email address provided by the user on this page.
3.3. NemaBrowse & TremaBrowse
NemaBrowse (http://nematode.net/NemaBrowse.html) and TremaBrowse (http://trematode.net/TremaBrowse.hmtl) use GMOD’s GBrowse [18] to offer a visualization of gene annotations and variants mapped on top of genomic assemblies. These provide a view of sometimes in-progress nematode and trematode genomes and, where variant calls on specific lab and field isolates are available, offer a useful comparative view.
Visualized annotations typically include Maker protein coding gene and RNA gene predictions [19,20], tRNAs predicted by tRNAscan [21] and Single Nucleotide Polymorphism (SNP) loci predicted using the Genome Analysis ToolKit (GATK) [22] and annotated using SnpEff [23]. Exceptions to the typical annotation tools are noted on the entry portals. NemaBrowse currently hosts annotations for 10 species and TremaBrowse hosts 1 species. Our recent focus has been to provide tracks for SNPs and SNP annotations in the browser. At present there are genetic variants called from 27 strains of the river blindness agent Onchocerca volvulus[24], nine strains for the lungworm Dictyocaulus viviparus[25], a susceptible and a resistant strain of Trichostongylus circumcincta (unpublished) and 7 strains of Fasciola hepatica[26].
At the entry portal page into NemaBrowse, the user selects their species of interest and clicks the ‘Gene list’ link (Fig. 7A). This leads to the gene list interface, which provides links directly to all the annotated gene features for that organism (Fig. 7B). Minimal annotation is made available in the gene list using either final gene product information as annotated by the BER pipeline, or information derived from WU-BLAST 2.0 mappings to the NCBI non-redundant (NR) database using a post-alignment cutoff of 35 bits + 55% identity. Clicking on a Gene annotation link will take the user to the GBrowse view (Fig. 8). Once inside the GBrowse view the user can directly navigate along the reference and make use of the standard functions of the GBrowse environment.
Figure 7. Selecting NemaBrowse input.
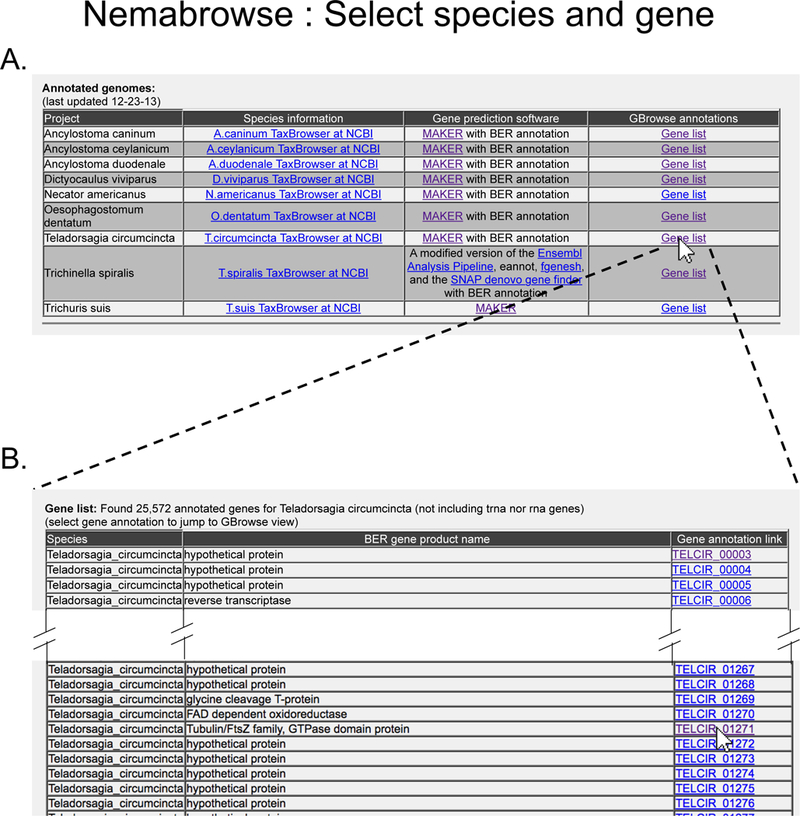
(A) On the main NemaBrowse page, the user can select one of the species for which NemaBrowse view is available. Clicking on “Gene list” link (shown by a white arrow pointer) takes to a page (B) that lists all the genes in the database for the species of interest.
Figure 8. GBrowse trakcs in NemaBrowse.
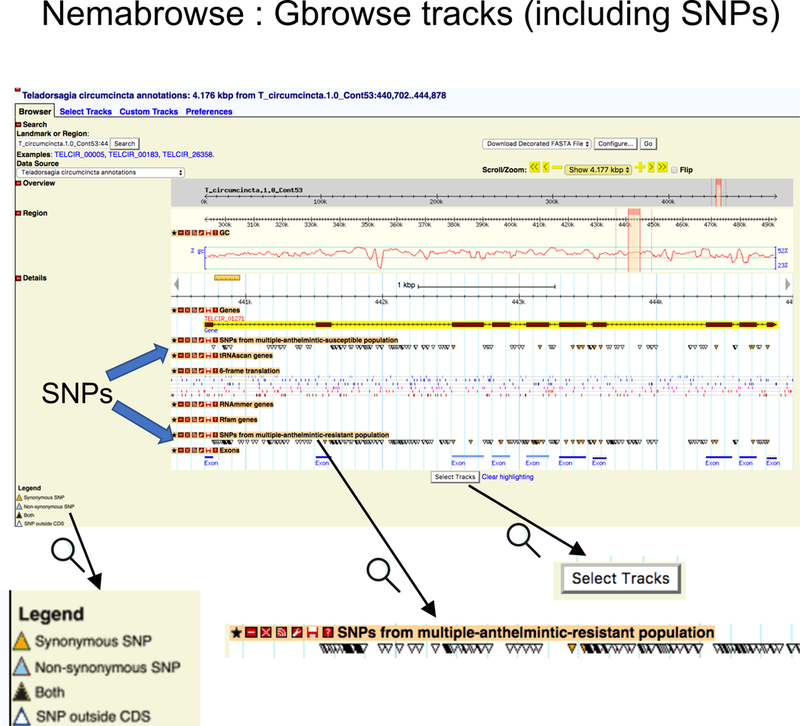
The GBrowse view centered on the gene selected as NemaBrowse input (Fig. 7) with some default tracks plotted. The user can select any of the available tracks using the “Select Tracks” button at the bottom. As an example, the two SNP tracks available for T. circumcincta are shown, with the SNP loci indicated by colored triangles, colored according to SNPEff annotation of the SNP. Zoomed in images of some parts are shown at the bottom for clarity.
Depending on the datasets available, the GBrowse tracks can include plottable information more than the basic tracks such as gene annotation, GC percent, 6-frame translation etc. For the species with available variant information, these include tracks for SNP loci that can be selected for plotting. These loci are marked and identified according to their SNPEff annotation – non-coding SNPs (i.e. intronic or intergenic), synonymous coding SNPs and non-synonymous coding SNPs. For any genes of interest, users can navigate the GBrowse for such information and can also provide their dataset of interest to be included as additional tracks.
3. 4. Functional annotations and related tools
3.4.1. NemaPath & TremaPath
N/Tr- emaPath is a tool for visualizing the presence, absence and overall coverage of enzymatic pathways in species based on the KO annotations of genes [13]. In addition to the single organism view N/Tr- emaPath supports comparative views between pairs of species. This allows users to visually see and explore enzymatic pathway differences between these entities based on actual transcriptomic data. This tool can assist users in various ways, from identifying potential drug targets to helping understand the differences between species utilizing different survival strategies. NemaPath has 1,103,786 annotated genes and transcripts spanning 63 species, while TremaPath is populated by 204,647 proteins spanning 11 trematodes.
KO annotations are assigned to genes using WU-BLAST 2.0 alignments against the KEGG genes database (release 68.0). The KO ids of the subjects hit are used to relate helminth sequences to the KEGG pathways. Enzymatic nodes of the KEGG pathway maps are painted to indicate the number of supporting genes found from each species.
Users first select a species (Fig. 9A) and are then provided a graphical distribution of the number of KO hits with varying e-value confidence scores for their chosen species (Fig. 9B). The user must then set an alignment strength threshold to assign KOs to genes. Only homologies whose alignment strength meets that cutoff are considered when populating the view. Choosing a less stringent score will be more sensitive, but can introduce false positive mappings. After confirming their choices (Fig. 9C) users are then presented with a menu of pathways supported by N/Tr- emaPath (Fig. 10A). After pathway selection, a graphic displaying the compounds and reactions of that pathway for their species of choice is shown, with populated enzymes colored green, and darker shading indicating multiple genes annotated (Fig. 10B). This figure also includes more details about the enzymes that show up as mouse-over menu for each enzyme (Fig. 10C). The user can then optionally choose a second species for comparison using a dropdown menu near the top right of the page (Fig. 11A), mapping genes onto the same pathway and highlighting differences in pathway usage between the species (Fig. 11B). Information about the genes mapping to each node are available on mouse-over including the KEGG target(s) that sponsored the assignment to the node and the strength of the alignment(s). The query names link into N/Tr- emaGene and the subject names link to the KEGG website.
Figure 9. Selecting genome and annotation threshold for TremaPath usage.
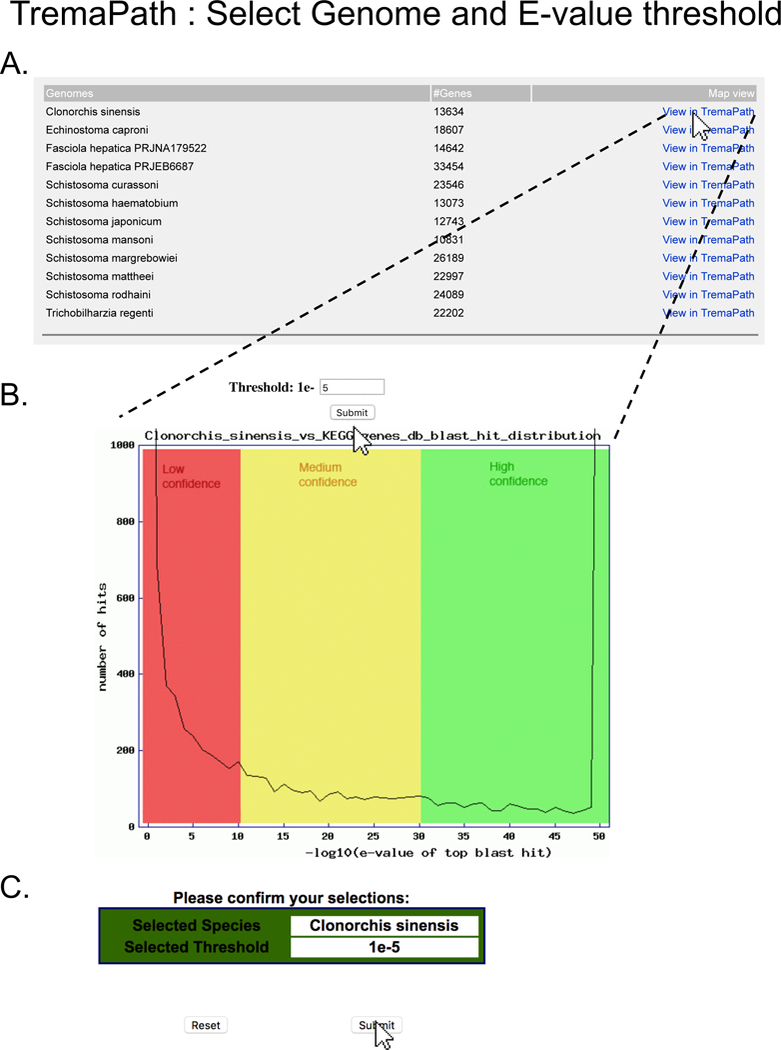
On the main TremaPath page, clicking on the “Species-specific TremaPath comparisons” link takes the user to a page (A) where the user can select the species and assembly of interest. Clicking on “View in TremaPath” link leads to a page (B) that shows the distribution of KOs assigned at different E-value thresholds, with colors distinguishing low, medium and high confidence annotation. The user can indicate the E-value threshold they want by filling in the exponent and clicking the Submit button and confirming their input at the next page (C).
Figure 10. Visualizing a metabolic pathway for a single species.
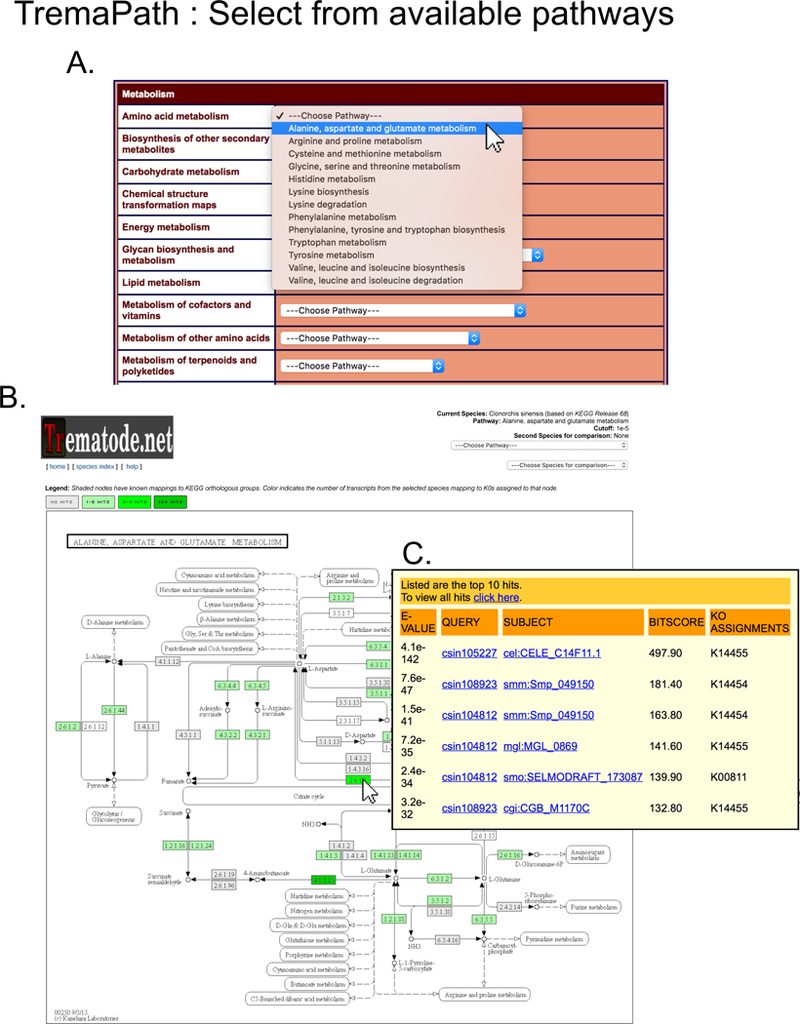
(A) After confirming the species and annotation threshold (Fig. 9), the user selects the pathway of interest by dropdown menus grouped under major categories of KEGG pathways. (B) The resulting page shows KEGG pathways with the enzyme nodes shown in shades of green, representing the number of genes with the corresponding annotation. The user can mouse-over on any of these nodes to peek at the details of such genes and BLAST hits (C).
Figure 11. Comparing a metabolic pathway for two species.
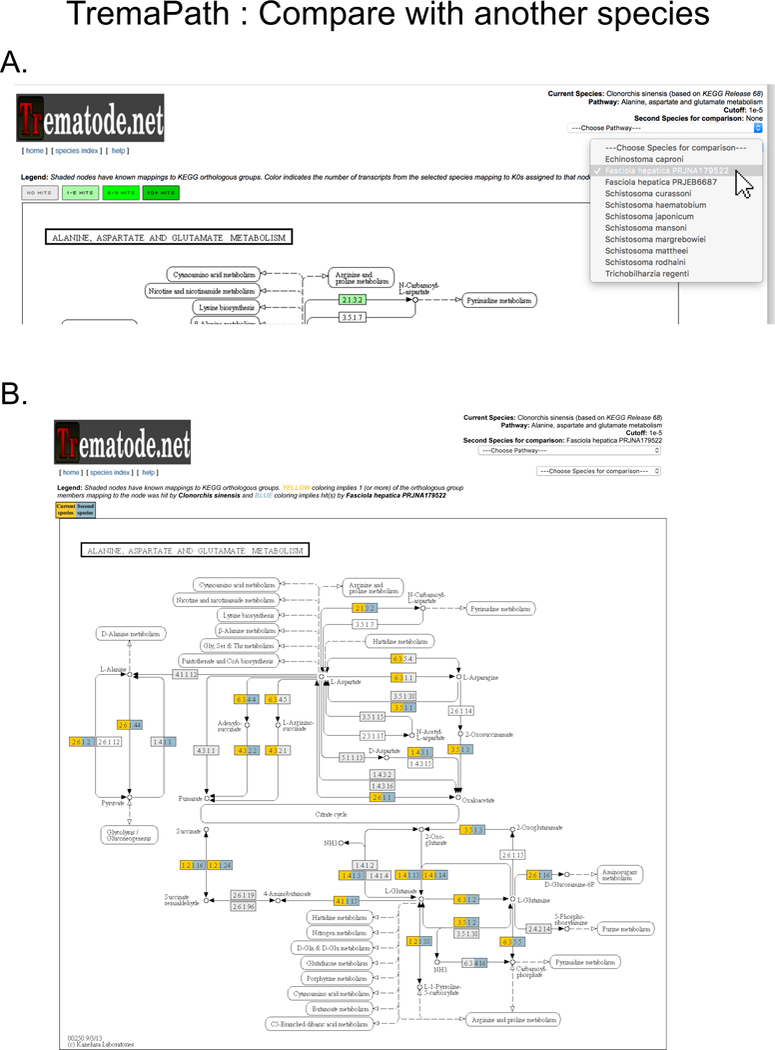
(A) After visualizing the pathway of interest for one species (Fig. 10) in TremaPath, a second species can be selected on a dropdown menu on top right (selection shown with a white arrow). This leads to a pathway view (B) with the two species painted in different colors, juxtaposing the presence of enzymes from that pathway in the two species.
3.4.2. AmiGO
The GO association page (nematode.net/GO_associations.html) hosts the AmiGO tool [27] for viewing gene ontologies assigned to 172,505 NemaGene genes and transcripts from 31 nematode species. GO classifications, assigned by homologies detected using InterProScan, are loaded into the AmiGO software’s backend database. AmiGO then provides a graphical view in which users can search NemaGene transcripts by ontological class.
First, the user selects the organism they want to explore. This will present an AmiGO overview showing the number of genes and transcripts annotated under each GO category. Categories expand to display child categories along with their assignment counts. The pie images next to each GO category are clickable and expand into views showing counts in all child categories beneath the level at which the user clicked. Genes and transcripts of the selected species assigned a specific GO term of interest can be explored by entering the GO id into the ‘Search GO’ field, leaving the ‘Terms’ box checked, and clicking. This leads to a detailed view corresponding to the GO term. This view lists the transcripts and/or genes assigned to the current term and provides more information about the term itself. Note that if the user clicks on one of the GO terms on the original AmiGO overview, it would also directly lead them to this detailed view.
3.4.3. Transcriptomics data
[nematode.net/IlluminaTranscripts.html; nematode.net/cDNA454.html; nematode.net/SangerESTs.html and trematode.net/IlluminaTranscripts.html]
Nematode.net provides access to a large collection of transcript data including Illumina RNA-Seq (Table 1), cDNA transcript assemblies (Table 2) and Sanger ESTs clusters (Table 3). All transcript expression data originate from either whole organism, developmental stage, gender or tissues specific RNA population. Normalized gene expression values, for subset of species, are also included on the gene pages.
Table 1.
Available Illumina RNAseq reads
| Nematode Species | # RNAseq reads |
Stages/Tissues | Accession ids |
|---|---|---|---|
| Ancylostoma caninum | 401157883 | L2, L3(non-activated), L3(untreated), female, male, oesophagus,gut |
SRX1971542,SRX1971543, SRX1971544,SRX1971545, SRX1971546,SRX1971547, SRX1971548 |
| Ancylostoma ceylanicum | 1410548651 | L3(non-activated), L3(activated), L3(infective), 48hr L3, 72hr L3, 72hr L4, female, male, L4 8day female, 24hr small intestine, 24hr stomach, gut, |
SRX1116899,SRX1116900, SRX1116901,SRX1116902, SRX1116903,SRX1116904, SRX1116905,SRX1116906, SRX1116907,SRX1116908, SRX1116909,SRX1116910, SRX1116911,SRX1116912, SRX1116913,SRX1116915, SRX1116916,SRX1116917, SRX1116918,SRX1116919, SRX1116920,SRX1116921, SRX1116922,SRX1116923, SRX1127457 |
| Ascaris suum | 2259230956 | female head, male head, female pharynx, male pharynx, female intestine, male intestine, anterior intestine, mid intestine, posterior intestine, repro-associated unattached intestine, whole intestine, 24hr anterior intestine (treatment: hsiRNA2), 24hr anterior intestine (treatment: hsiRNA5), 24hr posterior intestine (treatment: hsiRNA2), 24hr posterior intestine (treatment: hsiRNA5), ovary, uterus, seminal vesicle, testis, Whole worm |
SRX1013923,SRX1013925, SRX1013926,SRX1013928, SRX1013929,SRX1013930, SRX1013931,SRX1013932, SRX1013933,SRX1013934, SRX1013935,SRX1013936, SRX1013937,SRX1013938, SRX1013939,SRX1013940, SRX1013941,SRX1013942, SRX1013943,SRX1013944, SRX1013945,SRX1013946, SRX1013948,SRX1013949, SRX1013950,SRX1013951, SRX1013953,SRX1013954, SRX1013956,SRX1013957, SRX157781,SRX278110,SRX278111, SRX278113,SRX278114,SRX278115, SRX278116,SRX278117,SRX278118, SRX278119,SRX278120,SRX278121, SRX278122,SRX278123,SRX278124, SRX278125,SRX278126,SRX278127, SRX278128,SRX278129,SRX278130, SRX278131,SRX278133,SRX278134, SRX278135,SRX278136,SRX278137, SRX278138,SRX278139,SRX278140, SRX278141,SRX278142,SRX278143, SRX278144,SRX278151,SRX278152, SRX278153,SRX278154,SRX278155, SRX278156,SRX278157,SRX278158, SRX278159,SRX278160,SRX278161, SRX278162,SRX278163,SRX278164, SRX278165,SRX278166 |
| Dictyocaulus viviparus | 821515897 | L1, L2, L3, L4, L5(mixed), L5(female), L5(male), female, male, egg, hypobiotic larvae |
SRX371002,SRX693266,SRX693267, SRX371003,SRX693295,SRX868541, SRX371004,SRX371005,SRX371006, SRX371007,SRX371008,SRX693298, SRX693301,SRX371010,SRX371011, SRX371012,SRX693296,SRX693299, SRX693297,SRX371009,SRX693300, SRX371413,SRX693302,SRX693304, SRX693303 |
| Haemonchus contortus | 184431397 | female intestine, male intestine |
SRX736496,SRX736495 |
| Necator americanus | 37157105 | L3, adult | SRX202018,SRX202022 |
|
Oesophagostomum
dentatum |
654919328 | L2, L3, L4, female, male, total rna(drug resistant population), total rna(drug susceptible population) |
SRX2085121,SRX2085118, SRX2085106,SRX2085107, SRX2085122,SRX2085126, SRX2085123,SRX2085109, SRX2085108,SRX2085110, SRX2085112,SRX2085113, SRX2085125,SRX2085127, SRX2085111,SRX2085124, SRX2085119,SRX2085115, SRX2085116,SRX2085114, SRX2085117,SRX2085120 |
| Teladorsagia circumcincta | 226574759 | total rna(anthelmintic resistant), total rna (anthelmintic susceptible) |
SRX1507696,SRX1507697, SRX1507698 |
| Trichuris suis | 693989167 | 10 day larvae, 16 day larvae, 17 day larvae, 21 day larvae, 28 day larvae, 35 day larvae, 42 day larvae, female, male, adult(mixed), female anterior body, Male anterior body, ovary, testis |
SRX1838979,SRX1838981, SRX1838978,SRX1838982, SRX1838974,SRX736471, SRX736470,SRX1838977, SRX1838980,SRX1838975, SRX1838976,SRX1838983, SRX1838985,SRX1838984, SRX1838986 |
| Trematode species | |||
| Fasciola hepatica | 415324163 | egg, metacercariae, adult |
SRX1037419,SRX1037418, SRX1037417,SRX1037421, SRX1037416,SRX1037420, SRX1798471,SRX1798472, SRX1037423,SRX1037422, SRX1798475,SRX1798474, SRX1798473 |
| Paragonimus skrjabini | 49816749 | adult | SRX1507709 |
| Paragonimus westermani | 46468226 | adult | SRX1507710 |
Table 2.
Available Roche/454 cDNA assembled transcripts
| Species | # isogroups | # isotigs | Stages/Tissues |
|---|---|---|---|
| Ancylostoma caninum | 19277 | 23388 | L3(infective), L3(serum stimulated), adult female, adult male |
| Cooperia oncophora | na | 30025 | L3, adult female, adult male |
| Dictyocaulus viviparus | 20529 | 36626 | L1, L3, L5, adult female, adult male, egg |
| Heterorhabditis bacteriophora | 7310 | 7857 | na |
| Necator americanus | 9253 | 9693 | na |
| Oesophagostomum dentatum | 16788 | 30030 | L2, L3, L4, adult female, adult male |
| Ostertagia ostertagi | na | 34871 | L3, L4 |
| Teladorsagia circumcincta | 29991 | 33148 | adult |
| Trichostrongylus colubriformis | 19833 | 27615 | adult female, adult male |
Table 3.
Available Sanger EST assembled transcript clusters (i.e. genes)
| Species | # EST clusters |
|---|---|
| Ancylostoma caninum | 5484 |
| Ancylostoma ceylanicum | 4953 |
| Ascaris suum | 5137 |
| Brugia malayi | 1609 |
| Caenorhabditis remanei | 12334 |
| Dirofilaria immitis | 2534 |
| Ditylenchus africanus | 5214 |
| Globodera pallida | 2973 |
| Globodera rostochiensis | 9482 |
| Heterodera glycines | 12313 |
| Heterodera schachtii | 1595 |
| Haemonchus contortus | 9842 |
| Meloidogyne arenaria | 3356 |
| Meloidogyne chitwoodi | 5880 |
| Meloidogyne hapla | 11193 |
| Meloidogyne incognita | 9107 |
| Meloidogyne javanica | 5165 |
| Meloidogyne paranaensis | 2263 |
| Nippostrongylus brasiliensis | 4532 |
| Onchocerca flexuosa | 1665 |
| Ostertagia ostertagi | 4794 |
| Parastrongylus trichosuri | 4923 |
| Pratylenchus penetrans | 488 |
| Pristionchus pacificus | 2654 |
| Radopholus similus | 5551 |
| Strongyloides ratti | 5237 |
| Strongyloides stercoralis | 3479 |
| Toxocara canis | 2082 |
| Trichinella spiralis | 5958 |
| Trichuris muris | 3735 |
| Xiphinema index | 5485 |
| Zeldia punctata | 202 |
The Illumina RNA-Seq table provides links to the experiment ids (SRX ids) organized by species and annotated with stage, tissue and sequencing platform information. The links point to the corresponding record in NCBI’s Sequence Read Archive (SRA) [28]. This same layout is used in both the Nematode.net and Trematode.net Illumina transcript data tables.
cDNA transcript assemblies are listed in an expandable table with the section for each of the 9 nematode species providing various information. Expanding any of the rows provides information on the numbers and platform types of reads used in each assembly. Also shown are the numbers of isotigs (putative transcripts), isogroups (isotig group putatively representing all the expressed isoforms for a gene locus) and numbers of reads per stage if that information is available. For each assembly download links are provided for:
Isotig nucleotide fasta:
Isotigs refer to alternatively spliced isoforms of genes.
Isotig protein translations:
These are protein translations (made using prot4EST [29]) of the isotigs produced by the assembler.
Isogroup membership file:
Isogroup refers to the grouping of isotigs that putatively represent multiple isoforms for a gene locus. This file lists the detected isogroups by the assembler and provides the list of member isotigs per isogroup. This file is generated by local perl scripts.
Read membership file:
The read membership file lists the read members for each isotig in the isotig file.
Our currently hosted transcript assemblies are from both, Roche/454 data using the Newbler assembler (v2.5) [30] which generated the isotig and isogroup information and Sanger EST data which is clustered using the Phred/Phrap/Consed suite of analysis tools[31–33] and the consensus of these clusters is provided on the site. In addition to the cluster consensus sequence, Nematode.net also provides translated protein sequence built using the prot4EST program[29].
3.4.5. non-coding small RNAs
Non-coding small RNAs have been published only for a very few nematodes and trematodes. While most of the publications have their miRNAs in miRBase[34], predictions of miRNA targets are not presented, primarily owing to the difficulty in reliably predicting miRNA-target relationship based on in silico bioinformatics methods. Nevertheless, some data related to miRNA, miRNA abundances, and potential mRNA targets of miRNAs have started to emerge and Nematode.net has now begun to host such data. This is a new feature and as an example of such data hosting, we currently have included Ascaris suum intestinal miRNAs and their predicted targets in the database. Based on interest from the community we will expand this to other available nematode and trematode miRNA and target information.
3.4.6. Proteomics
[nematode.net/Proteomics.html]
Protein expression data are, at present, hosted in derivative tables that provide spectra abundance per protein per species. We are in the process of including this information directly on the gene pages.
4. Helminth Control and Prevention
4.1. HelmCoP (Nematode.net)
HelmCoP (Helminth Control and Prevention; nematode.net/HelmCoP.html) [6] is a database of integrated functional, structural and comparative genomics data from plant, animal and human parasitic nematodes and trematodes, as well as model organisms and several host organisms (18 species) all capped by a query interface that allows users to ask complex questions of these data. HelmCoP’s primary goal is to assist researchers in the process of building a list of candidate drug, pesticide and vaccine targets in helminthes. HelmCoP has the versatility to enable users to search for drug targets for specific parasite species or for a group of species of interest and also to allow the user to search for broad-spectrum drug targets that span multiple taxonomic groups or phyla.
Querying HelmCoP is done using one of two forms. One is for users interested in building gene-based custom queries (Fig. 12A) and the other for users wanting to search the database using ortholog based queries. The upper half of both the gene and ortholog based search forms are used to build the set of genes that will be tested according to the user’s filter selections. For the gene based search you can either enter a specific gene name or you can select a combination of species to define the gene space to which the filters you select will be applied.
Figure 12. HelmCoP options setup.
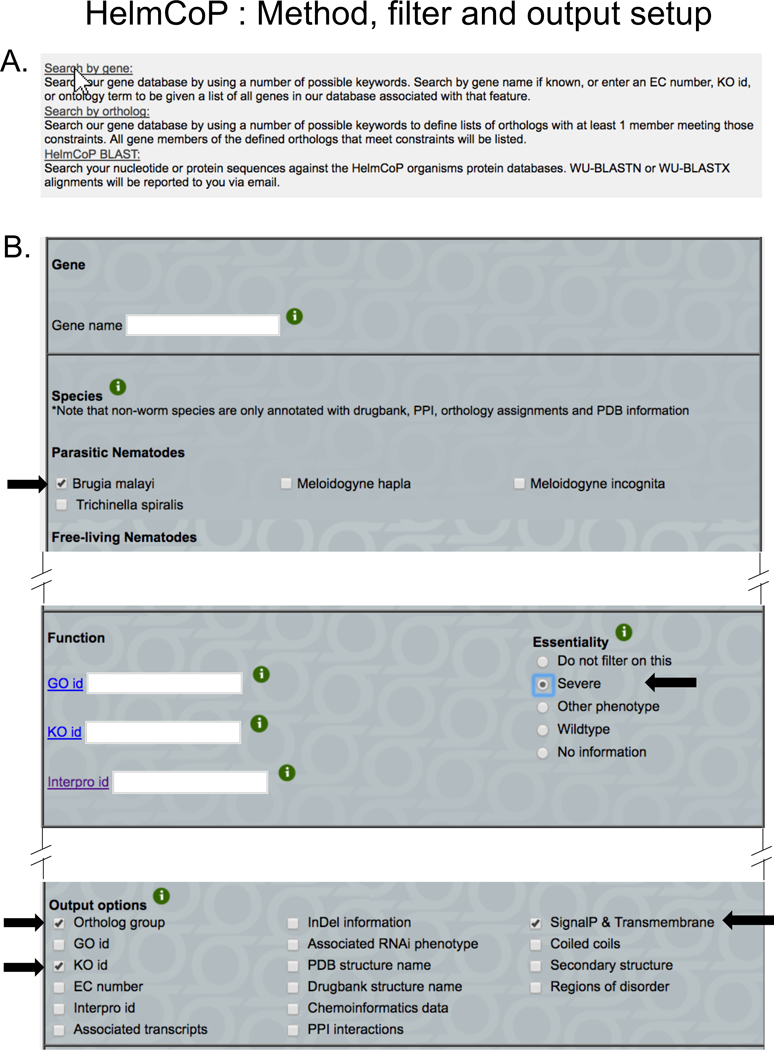
(A) On the main HelmCoP page, the user indicates whether they want to search by gene, ortholog, or using the HelmCoP BLAST. The illustrated example shows a search by gene (indicated by a white arrow pointer on the corresponding link). (B) The main input page, where the user can select the gene(s) or species of interest (if any), the filters selecting any properties of interest (e.g. “Essentiality” required to be “Severe” as shown here), and the columns that the user wants to populate the results table. The example here shows a query for all genes in Brugia malayi that are annotated with “severe” essentiality, reporting their ortholog group, KO ids, and any SignalP & Transmembrane annotation.
If you are building an ortholog based query (i.e. results are returned by ortholog if any gene within that ortholog meets the criteria you define) you use the ortholog search page. Most users won’t have a specific ortholog in mind when using this page, so the typical user will define their set of orthologs by choosing species to include or exclude (or ignore) when defining the search space. Leaving an organism set to ‘Do not filter on this’ will cause that species to not be considered when defining the result set. Your choices will result in an initial set of orthologs that have at least one gene from any of the ‘included’ species. But having even one gene member from an ‘excluded’ species will remove the entire ortholog from the return set.
For both the gene and ortholog based searches after defining the set of species to query and thus defining the gene space the next task is to apply desired filters to limit your output down to only those genes or orthologs of interest to you (Fig. 12B). The user can also request specific output columns in the result table at this step.
Several annotations are specific to the HelmCoP database. The Function section allows you to set specific GO, KO and/or IPR ids that you require to be present in returned genes, or at least in one of the members of returned orthologous groups. The Structure based filters allow you to limit your return set by requiring them to have shown sequence similarity to the PDB id you enter [35]. This section also allows you to filter your results based on the presence or absence of a detected signal peptide. The search for signal peptides is performed using the Phobius program [36].The Drugs section allows you to filter on genes with homology to targets in DrugBank [37]. It also allows you to filter based on whether or not your returned gene (or at least one of the genes per each returned orthologous group) is considered a ‘Hopkins druggable target’ [38]. The putative Vaccine candidates section allows the user to filter based on the presence of various structural based hints that may imply epitopes that are vaccine candidates. You can pick and choose specific traits or just turn on the ‘Show all vaccine candidates’ switch to apply them all. Finally the user needs to set their Output options. These allow the user to customize the output to include only information of interest to them. Some columns will always be returned, such as gene and ortholog name as well as species of origin, but otherwise the user needs to select the other information they want reported.
Due to technical limitations the output of a HelmCoP query is limited to 20,000 rows displayed in HTML. This limitation means that it is possible that ortholog based search results may be truncated mid-ortholog. In other words you are not guaranteed to consistently have every gene member of filter-passing orthologs reported to you in the HTML display. The full and complete results are made available as a downloadable text file that is presented to the user on the results page (Fig. 13). To be assured of getting the full results the user should always download the provided full results text file.
Figure 13. HelmCoP results.
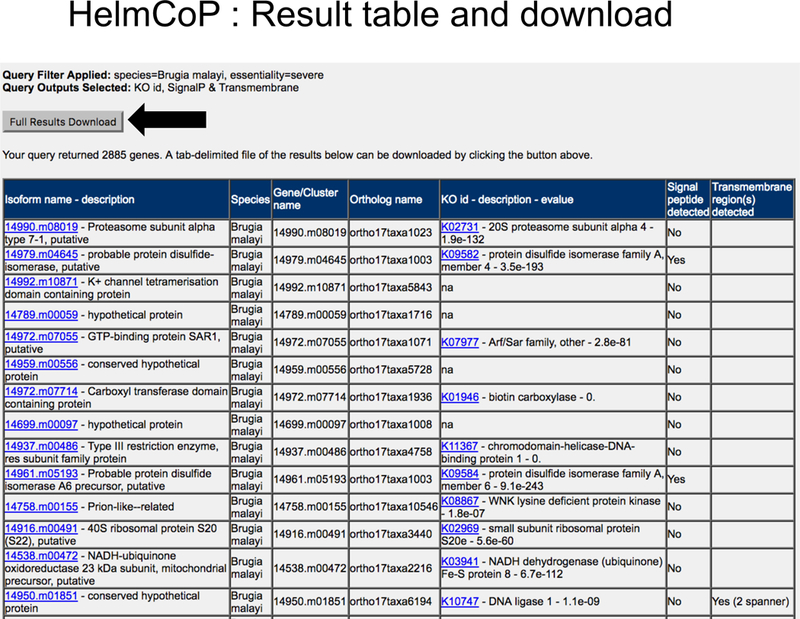
The result page for HelmCoP contains a table showing the properties selected by the user (Fig. 12) for the genes satisfying the filters of interest. A download link is also provided for the entire result table (since the shown table may be truncated, depending on how many genes are part of the result).
Another consideration when using this tool is that due to the size of some return sets, selecting many or all of the available outputs can cause your query to take a long time to build. In some cases this may even cause the website to time out before the information can be fed back to user’s browser. When a query is submitted we do first run a query manager that tries to estimate if your query is complete-able within an amount of time that should avoid this timeout but the manager is not infallible. If the manager deems that the query would not complete within the time limits we will suggest which are the most time-intensive options for your search. Users can then reconstruct their query with fewer requested outputs or define a smaller starting search space (i.e. choosing fewer species or a more restrictive set of orthologs in the species selection).
This is what the HTML results of a HelmCoP search looks like (Fig. 13). The output table is gene based with ortholog information provided as well for ortholog based search returns (or in the case that the user selects to see orthologous group annotation for a gene based search return). Every requested output will be a column, so requesting many outputs can result in your data spanning multiple page-widths. Where appropriate the HTML view provides link-outs to the various resources each output type is based upon. And for orthologous group output it aggregates cases where multiple members of an ortholog report the same information.
Towards the top of the page users will be shown the query filters and output requests that they have specified that resulted in the provided report. The button for accessing a full, tab-delimited text version of the output table is also available here (it is strongly recommended that users download the full report text file to avoid the issues mentioned above).
4.2. Other function specific candidate drug targets
Much research has been conducted on inhibitors for different gene families leading to a wealth of compounds that target them that have potential to be lead anthelmintic drugs. Nematode.net provides several derivative tables that provide information for specific gene families or specific functions that have been obtained as a result of genome-driven knowledge based drug target discovery. We host information on kinases, metabolic chokepoints, lysine deacetylases and protein-protein interactions as targets. These candidate targets are linked to inhibitors via homologous targets in drugbanks.
5. Microbiome Interactions
Both of the Helminth.net sites host information derived from the study of microbial communities in helminth infected subjects (nematode.net/Microbiome.html; trematode.net/Microbiome.html). This information includes bacterial abundances per sample (based on targeted metagenomic 16S rRNA gene sequencing or shotgun metagenomic sequencing), sample infectious status, and cohort demographics.
Acknowledgements
We sincerely thank all the past and present members of Mitreva lab for their contribution to the database over the past 17 years (nematode.net/staff.html) and we thank the numerous collaborators in the helminth community (nematode.net/collaborators.html and trematode.net/collaborators.html), for providing invaluable worm material and being involved in data generation/analysis activities, and the dedicated members of the production group at The McDonnell Genome Institute (http://genome.wustl.edu/) for the library construction and sequencing. Helminth.net is funded by National Institutes of Health [AI081803 and GM097435] and NIFA [2013–01109].
References
- 1.Wylie T, Martin JC, Dante M, Mitreva MD, Clifton SW, Chinwalla A, Waterston RH, Wilson RK, McCarter JP (2004) Nematode.net: a tool for navigating sequences from parasitic and free-living nematodes. Nucleic Acids Res 32 (Database issue):D423–426. doi: 10.1093/nar/gkh010 [DOI] [PMC free article] [PubMed] [Google Scholar]
- 2.Martin J, Abubucker S, Wylie T, Yin Y, Wang Z, Mitreva M (2009) Nematode.net update 2008: improvements enabling more efficient data mining and comparative nematode genomics. Nucleic Acids Res 37 (Database issue):D571–578. doi: 10.1093/nar/gkn744 [DOI] [PMC free article] [PubMed] [Google Scholar]
- 3.Martin J, Abubucker S, Heizer E, Taylor CM, Mitreva M (2012) Nematode.net update 2011: addition of data sets and tools featuring next-generation sequencing data. Nucleic Acids Res 40 (Database issue):D720–728. doi: 10.1093/nar/gkr1194 [DOI] [PMC free article] [PubMed] [Google Scholar]
- 4.Martin J, Rosa BA, Ozersky P, Hallsworth-Pepin K, Zhang X, Bhonagiri-Palsikar V, Tyagi R, Wang Q, Choi YJ, Gao X, McNulty SN, Brindley PJ, Mitreva M (2015) Helminth.net: expansions to Nematode.net and an introduction to Trematode.net. Nucleic Acids Res 43 (Database issue):D698–706. doi: 10.1093/nar/gku1128 [DOI] [PMC free article] [PubMed] [Google Scholar]
- 5.Wylie T, Martin J, Abubucker S, Yin Y, Messina D, Wang Z, McCarter JP, Mitreva M (2008) NemaPath: online exploration of KEGG-based metabolic pathways for nematodes. BMC Genomics 9:525. doi: 10.1186/1471-2164-9-525 [DOI] [PMC free article] [PubMed] [Google Scholar]
- 6.Abubucker S, Martin J, Taylor CM, Mitreva M (2011) HelmCoP: an online resource for helminth functional genomics and drug and vaccine targets prioritization. PLoS One 6 (7):e21832. doi: 10.1371/journal.pone.0021832 PONE-D-11–02640 [pii] [DOI] [PMC free article] [PubMed] [Google Scholar]
- 7.Tyagi R, Rosa BA, Lewis WG, Mitreva M (2015) Pan-phylum Comparison of Nematode Metabolic Potential. PLoS Negl Trop Dis 9 (5):e0003788. doi: 10.1371/journal.pntd.0003788 [DOI] [PMC free article] [PubMed] [Google Scholar]
- 8.Torbati ME, Mitreva M, Gopalakrishnan V (2016) Application of Taxonomic Modeling to Microbiota Data Mining for Detection of Helminth Infection in Global Populations. Data (Basel) 1 (3). doi: 10.3390/data1030019 [DOI] [PMC free article] [PubMed] [Google Scholar]
- 9.Jones P, Binns D, Chang HY, Fraser M, Li W, McAnulla C, McWilliam H, Maslen J, Mitchell A, Nuka G, Pesseat S, Quinn AF, Sangrador-Vegas A, Scheremetjew M, Yong SY, Lopez R, Hunter S (2014) InterProScan 5: genome-scale protein function classification. Bioinformatics 30 (9):1236–1240. doi: 10.1093/bioinformatics/btu031 [DOI] [PMC free article] [PubMed] [Google Scholar]
- 10.Hunter S, Jones P, Mitchell A, Apweiler R, Attwood TK, Bateman A, Bernard T, Binns D, Bork P, Burge S, de Castro E, Coggill P, Corbett M, Das U, Daugherty L, Duquenne L, Finn RD, Fraser M, Gough J, Haft D, Hulo N, Kahn D, Kelly E, Letunic I, Lonsdale D, Lopez R, Madera M, Maslen J, McAnulla C, McDowall J, McMenamin C, Mi H, Mutowo-Muellenet P, Mulder N, Natale D, Orengo C, Pesseat S, Punta M, Quinn AF, Rivoire C, Sangrador-Vegas A, Selengut JD, Sigrist CJ, Scheremetjew M, Tate J, Thimmajanarthanan M, Thomas PD, Wu CH, Yeats C, Yong SY (2012) InterPro in 2011: new developments in the family and domain prediction database. Nucleic Acids Res 40 (Database issue):D306–312. doi: 10.1093/nar/gkr948 [DOI] [PMC free article] [PubMed] [Google Scholar]
- 11.Gish W (1996–2003) http://blast.wustl.edu.
- 12.Blake JA, Dolan M, Drabkin H, Hill DP, Li N, Sitnikov D, Bridges S, Burgess S, Buza T, McCarthy F, Peddinti D, Pillai L, Carbon S, Dietze H, Ireland A, Lewis SE, Mungall CJ, Gaudet P, Chrisholm RL, Fey P, Kibbe WA, Basu S, Siegele DA, McIntosh BK, Renfro DP, Zweifel AE, Hu JC, Brown NH, Tweedie S, Alam-Faruque Y, Apweiler R, Auchinchloss A, Axelsen K, Bely B, Blatter M, Bonilla C, Bouguerleret L, Boutet E, Breuza L, Bridge A, Chan WM, Chavali G, Coudert E, Dimmer E, Estreicher A, Famiglietti L, Feuermann M, Gos A, Gruaz-Gumowski N, Hieta R, Hinz C, Hulo C, Huntley R, James J, Jungo F, Keller G, Laiho K, Legge D, Lemercier P, Lieberherr D, Magrane M, Martin MJ, Masson P, Mutowo-Muellenet P, O’Donovan C, Pedruzzi I, Pichler K, Poggioli D, Porras Millán P, Poux S, Rivoire C, Roechert B, Sawford T, Schneider M, Stutz A, Sundaram S, Tognolli M, Xenarios I, Foulgar R, Lomax J, Roncaglia P, Khodiyar VK, Lovering RC, Talmud PJ, Chibucos M, Giglio MG, Chang H, Hunter S, McAnulla C, Mitchell A, Sangrador A, Stephan R, Harris MA, Oliver SG, Rutherford K, Wood V, Bahler J, Lock A, Kersey PJ, McDowall DM, Staines DM, Dwinell M, Shimoyama M, Laulederkind S, Hayman T, Wang S, Petri V, Lowry T, D’Eustachio P, Matthews L, Balakrishnan R, Binkley G, Cherry JM, Costanzo MC, Dwight SS, Engel SR, Fisk DG, Hitz BC, Hong EL, Karra K, Miyasato SR, Nash RS, Park J, Skrzypek MS, Weng S, Wong ED, Berardini TZ, Huala E, Mi H, Thomas PD, Chan J, Kishore R, Sternberg P, Van Auken K, Howe D, Westerfield M, Consortium GO (2013) Gene Ontology annotations and resources. Nucleic Acids Res 41 (Database issue):D530–535. doi: 10.1093/nar/gks1050 [DOI] [PMC free article] [PubMed] [Google Scholar]
- 13.Kanehisa M, Goto S, Sato Y, Kawashima M, Furumichi M, Tanabe M (2014) Data, information, knowledge and principle: back to metabolism in KEGG. Nucleic Acids Res 42 (Database issue):D199–205. doi: 10.1093/nar/gkt1076 [DOI] [PMC free article] [PubMed] [Google Scholar]
- 14.Fischer S, Brunk BP, Chen F, Gao X, Harb OS, Iodice JB, Shanmugam D, Roos DS, Stoeckert CJ Jr (2011) Using OrthoMCL to assign proteins to OrthoMCL-DB groups or to cluster proteomes into new ortholog groups. Curr Protoc Bioinformatics Chapter 6:Unit 6 12 11–19. doi: 10.1002/0471250953.bi0612s35 [DOI] [PMC free article] [PubMed] [Google Scholar]
- 15.Sonnhammer EL, Ostlund G (2015) InParanoid 8: orthology analysis between 273 proteomes, mostly eukaryotic. Nucleic Acids Res 43 (Database issue):D234–239. doi: 10.1093/nar/gku1203 [DOI] [PMC free article] [PubMed] [Google Scholar]
- 16.Wootton JC, Federhen S (1993) Statistics of local complexity in amino acid sequences and sequence databases. Computers & chemistry 17 (2):149–163 [Google Scholar]
- 17.Bedell JA, Korf I, Gish W (2000) MaskerAid: a performance enhancement to RepeatMasker. Bioinformatics 16 (11):1040–1041 [DOI] [PubMed] [Google Scholar]
- 18.Stein LD (2013) Using GBrowse 2.0 to visualize and share next-generation sequence data. Brief Bioinform 14 (2):162–171. doi: 10.1093/bib/bbt001 [DOI] [PMC free article] [PubMed] [Google Scholar]
- 19.Cantarel BL, Korf I, Robb SM, Parra G, Ross E, Moore B, Holt C, Sanchez Alvarado A, Yandell M (2008) MAKER: an easy-to-use annotation pipeline designed for emerging model organism genomes. Genome Res 18 (1):188–196. doi: 10.1101/gr.6743907 [DOI] [PMC free article] [PubMed] [Google Scholar]
- 20.Lagesen K, Hallin P, Rodland EA, Staerfeldt HH, Rognes T, Ussery DW (2007) RNAmmer: consistent and rapid annotation of ribosomal RNA genes. Nucleic Acids Res 35 (9):3100–3108. doi: 10.1093/nar/gkm160 [DOI] [PMC free article] [PubMed] [Google Scholar]
- 21.Lowe TM, Eddy SR (1997) tRNAscan-SE: a program for improved detection of transfer RNA genes in genomic sequence. Nucleic Acids Res 25 (5):955–964 [DOI] [PMC free article] [PubMed] [Google Scholar]
- 22.McKenna A, Hanna M, Banks E, Sivachenko A, Cibulskis K, Kernytsky A, Garimella K, Altshuler D, Gabriel S, Daly M, DePristo MA (2010) The Genome Analysis Toolkit: a MapReduce framework for analyzing next-generation DNA sequencing data. Genome Res 20 (9):1297–1303. doi: 10.1101/gr.107524.110 [DOI] [PMC free article] [PubMed] [Google Scholar]
- 23.Cingolani P, Platts A, Wang le L, Coon M, Nguyen T, Wang L, Land SJ, Lu X, Ruden DM (2012) A program for annotating and predicting the effects of single nucleotide polymorphisms, SnpEff: SNPs in the genome of Drosophila melanogaster strain w1118; iso-2; iso-3. Fly 6 (2):80–92. doi: 10.4161/fly.19695 [DOI] [PMC free article] [PubMed] [Google Scholar]
- 24.Choi YJ, Tyagi R, McNulty SN, Rosa BA, Ozersky P, Martin J, Hallsworth-Pepin K, Unnasch TR, Norice CT, Nutman TB, Weil GJ, Fischer PU, Mitreva M (2016) Genomic diversity in Onchocerca volvulus and its Wolbachia endosymbiont. Nat Microbiol 2:16207. doi: 10.1038/nmicrobiol.2016.207 [DOI] [PMC free article] [PubMed] [Google Scholar]
- 25.McNulty SN, Strube C, Rosa BA, Martin JC, Tyagi R, Choi YJ, Wang Q, Hallsworth Pepin K, Zhang X, Ozersky P, Wilson RK, Sternberg PW, Gasser RB, Mitreva M (2016) Dictyocaulus viviparus genome, variome and transcriptome elucidate lungworm biology and support future intervention. Sci Rep 6:20316. doi: 10.1038/srep20316 [DOI] [PMC free article] [PubMed] [Google Scholar]
- 26.McNulty SN, Tort JF, Rinaldi G, Fischer K, Rosa BA, Smircich P, Fontenla S, Choi YJ, Tyagi R, Hallsworth-Pepin K, Mann VH, Kammili L, Latham PS, Dell’Oca N, Dominguez F, Carmona C, Fischer PU, Brindley PJ, Mitreva M (2017) Genomes of Fasciola hepatica from the Americas Reveal Colonization with Neorickettsia Endobacteria Related to the Agents of Potomac Horse and Human Sennetsu Fevers. PLoS Genet 13 (1):e1006537. doi: 10.1371/journal.pgen.1006537 [DOI] [PMC free article] [PubMed] [Google Scholar]
- 27.Carbon S, Ireland A, Mungall CJ, Shu S, Marshall B, Lewis S, Hub A, Group WPW (2009) AmiGO: online access to ontology and annotation data. Bioinformatics 25 (2):288–289. doi: 10.1093/bioinformatics/btn615 [DOI] [PMC free article] [PubMed] [Google Scholar]
- 28.Leinonen R, Sugawara H, Shumway M, Collaboration INSD (2011) The sequence read archive. Nucleic Acids Res 39 (Database issue):D19–21. doi: 10.1093/nar/gkq1019 [DOI] [PMC free article] [PubMed] [Google Scholar]
- 29.Wasmuth JD, Blaxter ML (2004) prot4EST: translating expressed sequence tags from neglected genomes. BMC Bioinformatics 5:187. doi: 10.1186/1471-2105-5-187 [DOI] [PMC free article] [PubMed] [Google Scholar]
- 30.Margulies M, Egholm M, Altman WE, Attiya S, Bader JS, Bemben LA, Berka J, Braverman MS, Chen YJ, Chen Z, Dewell SB, Du L, Fierro JM, Gomes XV, Godwin BC, He W, Helgesen S, Ho CH, Irzyk GP, Jando SC, Alenquer ML, Jarvie TP, Jirage KB, Kim JB, Knight JR, Lanza JR, Leamon JH, Lefkowitz SM, Lei M, Li J, Lohman KL, Lu H, Makhijani VB, McDade KE, McKenna MP, Myers EW, Nickerson E, Nobile JR, Plant R, Puc BP, Ronan MT, Roth GT, Sarkis GJ, Simons JF, Simpson JW, Srinivasan M, Tartaro KR, Tomasz A, Vogt KA, Volkmer GA, Wang SH, Wang Y, Weiner MP, Yu P, Begley RF, Rothberg JM (2005) Genome sequencing in microfabricated high-density picolitre reactors. Nature 437 (7057):376–380. doi: 10.1038/nature03959 [DOI] [PMC free article] [PubMed] [Google Scholar]
- 31.Ewing B, Hillier L, Wendl MC, Green P (1998) Base-calling of automated sequencer traces using phred. I. Accuracy assessment. Genome Res 8 (3):175–185 [DOI] [PubMed] [Google Scholar]
- 32.Ewing B, Green P (1998) Base-calling of automated sequencer traces using phred. II. Error probabilities. Genome Res 8 (3):186–194 [PubMed] [Google Scholar]
- 33.Gordon D, Abajian C, Green P (1998) Consed: a graphical tool for sequence finishing. Genome Res 8 (3):195–202 [DOI] [PubMed] [Google Scholar]
- 34.Kozomara A, Griffiths-Jones S (2011) miRBase: integrating microRNA annotation and deep-sequencing data. Nucleic Acids Res 39 (Database issue):D152–157. doi: 10.1093/nar/gkq1027 [DOI] [PMC free article] [PubMed] [Google Scholar]
- 35.Berman HM, Westbrook J, Feng Z, Gilliland G, Bhat TN, Weissig H, Shindyalov IN, Bourne PE (2000) The Protein Data Bank. Nucleic Acids Res 28 (1):235–242 [DOI] [PMC free article] [PubMed] [Google Scholar]
- 36.Kall L, Krogh A, Sonnhammer EL (2004) A combined transmembrane topology and signal peptide prediction method. J Mol Biol 338 (5):1027–1036. doi: 10.1016/j.jmb.2004.03.016 [DOI] [PubMed] [Google Scholar]
- 37.Knox C, Law V, Jewison T, Liu P, Ly S, Frolkis A, Pon A, Banco K, Mak C, Neveu V, Djoumbou Y, Eisner R, Guo AC, Wishart DS (2011) DrugBank 3.0: a comprehensive resource for ‘omics’ research on drugs. Nucleic Acids Res 39 (Database issue):D1035–1041. doi: 10.1093/nar/gkq1126 [DOI] [PMC free article] [PubMed] [Google Scholar]
- 38.Hopkins AL, Groom CR (2002) The druggable genome. Nat Rev Drug Discov 1 (9):727–730. doi: 10.1038/nrd892 [DOI] [PubMed] [Google Scholar]


