Figure 2.

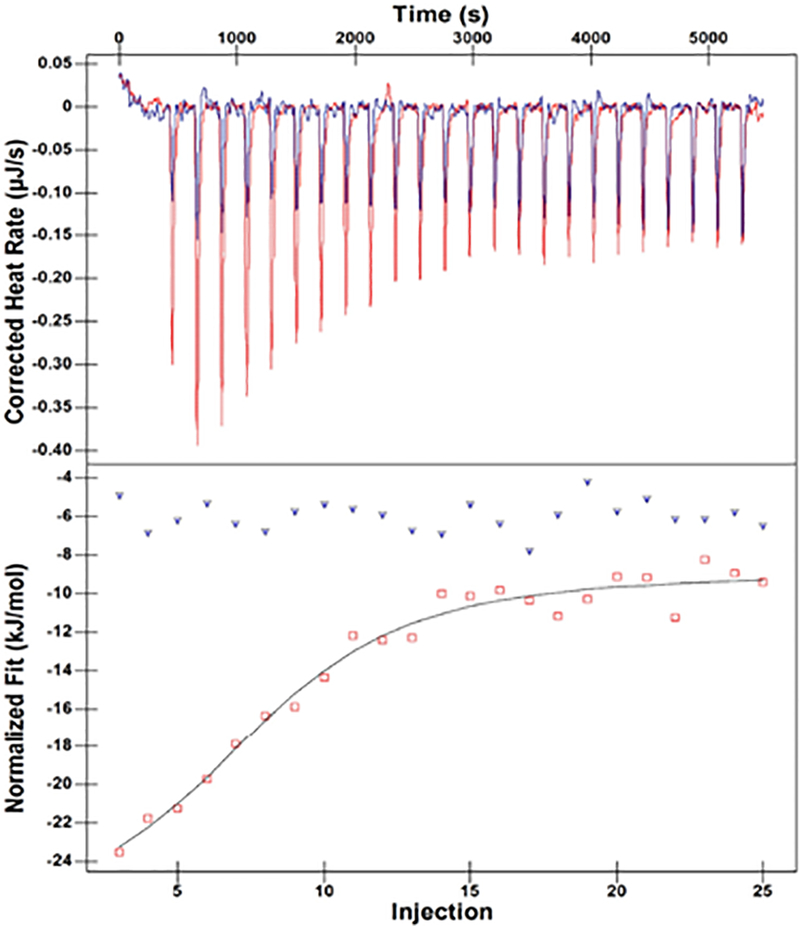
ITC results of L-captopril titrations with NDM-1 and SPS-1. Upper panels show the titration thermograms, and lower panels the data integration with fitted curves. NDM-1 protein is highlighted with red, and SPS-1 is highlighted with blue.

ITC results of L-captopril titrations with NDM-1 and SPS-1. Upper panels show the titration thermograms, and lower panels the data integration with fitted curves. NDM-1 protein is highlighted with red, and SPS-1 is highlighted with blue.