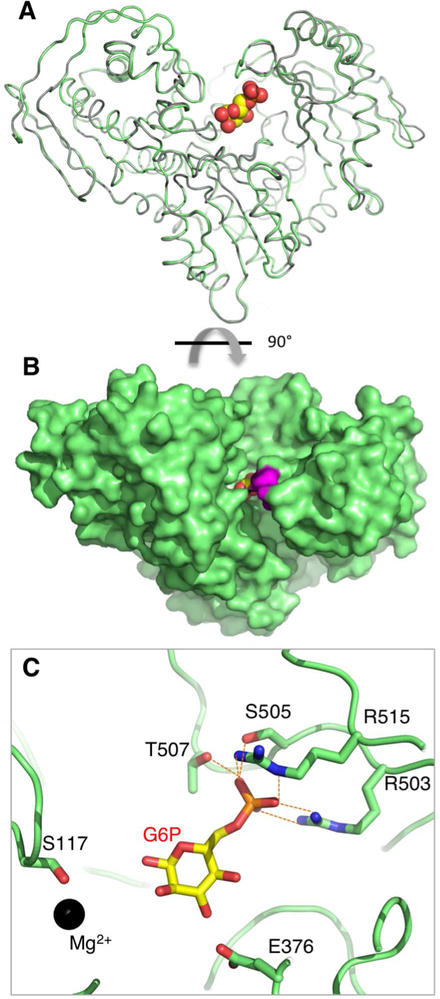
Figure 3. Crystal structure of the PGM1 complex with glucose 6-phosphate.
(A) A backbone superposition of the apo-enzyme (gray) and enzyme-ligand complex (green). G6P is shown in a space-filling model. (B) Space-filling representation of the PGM1-G6P complex, looking down into the active site. View is a 90° rotation relative to (A). Residues in the mobile flap are in magenta. (C) A close-up view of the PGM1-G6P interactions involving residues in the D4 loop (dashed orange lines). An additional interaction with the backbone amide of Gly506 is not shown. Ser117 and the bound metal ion (black sphere) are shown for reference. For an omit map of the ligand, see Figure S2B.

