

Abstract
Purpose of review
The immune system plays a critical role in the development and modulation of atherosclerosis. New high-parameter technologies, including mass cytometry (CyTOF) and single-cell RNA sequencing (scRNAseq), allow for an encompassing analysis of immune cells. Unexplored marker combinations and transcriptomes can define new immune cell subsets and suggest their functions. Here, we review recent advances describing the immune cells in the artery wall of mice with and without atherosclerosis. We compare technologies and discuss limitations and advantages.
Recent findings
Both CyTOF and scRNAseq on leukocytes from digested aortae show 10–30 immune cell subsets. Myeloid, T, B and natural killer cells were confirmed. Although cellular functions can be inferred from RNA-Seq data, some subsets cannot be identified based on current knowledge, suggesting they may be new cell types. CyTOF and scRNAseq each identified four B-cell subsets and three macrophage subsets in the atherosclerotic aorta. Limitations include cell death caused by enzymatic digestion and the limited depth of the scRNAseq transcriptomes.
Summary
High-parameter methods are powerful tools for uncovering leukocyte diversity. CyTOF is currently more powerful at discerning leukocyte subsets in the atherosclerotic aorta, whereas scRNAseq provides more insight into their likely functions.
Keywords: atherosclerosis, immune system, leukocytes, mass cytometry, single-cell RNA sequencing
INTRODUCTION
Heart attacks and strokes account for the majority of deaths worldwide. Most are caused by arterial thrombosis, a complication of ruptured or eroded atherosclerotic plaque [1]. The normal arterial wall contains endothelial cells, smooth muscle cells (SMCs), adventitial fibroblasts and leukocytes including vascular macrophages [2], T cells and B cells [3■■,4]. Several arterial leukocyte lineages were discovered by immunostaining and studied by flow cytometry (FACS) of digested aortae of experimental animals. After onset of atherosclerosis, endothelial cells are activated and SMC phenotype changes [5,6], the number of leukocytes increases in the adventitia and a eointima forms that also contains many leukocytes. Vascular macrophages proliferate locally [7■], and new leukocyte subsets are recruited to the arterial wall from circulation, either across the luminal endothelium or from vasa vasorum. Stem cells have been observed in the adventitia that may give rise to both SMC and macrophages [8].
Immunohistochemistry uncovered the presence of myeloid, T, B and natural killer (NK) cells in atherosclerotic lesions. FACS allows the simultaneous use of 18 fluorochrome-tagged antibodies and forward scatter (cell size) and side scatter (granularity), thus revealing more leukocyte subsets in the atherosclerotic mouse aorta. FACS-defined myeloid cells include three subsets of macrophages [9], neutrophils [10] and monocytes [11]. Furthermore, dendritic cells [3■■,12] and small numbers of plasmacytoid dendritic cells [13,14] can be found. Among αβ T cells, CD4 and CD8 [15] were found to be present, and a small number of γδ T cells [16]. FACS allows for intracellular staining of transcription factors, which identified Th1 [17], Th17 [18], follicular helper [19] and regulatory (Treg) [20] cells among CD4 T cells. Th1 cells are the predominant CD4 T-cell subset residing in the plaque [21]. Although Th2 cells are scarce in Apolipoprotein E-deficient (Apoe–/–) mice on the C57BL6/J background, possibly due to the known Th1 bias of this strain [22], single-cell RNA sequencing (scRNAseq) of murine aortae clearly demonstrated the presence of a Th2 subset residing within the aorta [23■■]. In addition, natural killer T cells [24], innate lymphoid cells [25,26] and NK cells [24] were found in atherosclerotic aortae. Using Cxcr6GFP mice, a CXCR6+ CD4 T-cell subset was identified [27], which was confirmed by scRNAseq [28■■]. The FACS approach identified only a few cell types per study. The main advantage of FACS is its low cost per cell and high throughput (Table 1). A 14-marker FACS panel resolved 12 different aortic leukocyte populations simultaneously (Table 1 and [23■■]) (Fig. 1).
Table 1.
Comparison of single-cell methods
| Methodology | Flow cytometry | Mass cytometry | Single-cell RNA sequencing (10× Genomics drop-seq) |
|---|---|---|---|
| Parameters | 4–18 | <42 | ~1000–1800 |
| Cells, n | Millions | 1 million | Up to 20000 |
| Actual cells analyzed | ~5000 | ~5000 | 555/909/2077 Winkels et al. [23■■] |
| 327/854/1219 Cochain et al. [28■■] | |||
| Cell types detectable | 12 (with 14 markers) | 23 (with 35 markers) | 11–13 (with 1004–1873 genes/cell) |
| Cost/cell | ~0.005 cents/cell (with 1 mio events and ~250$/mAB equaling 100 tests) |
~0.034 cents/cell (with 1 mio events and 400$/mAB equaling 50 tests) |
~16–20 cents |
Prices exclude salary and equipment costs.
FIGURE 1.
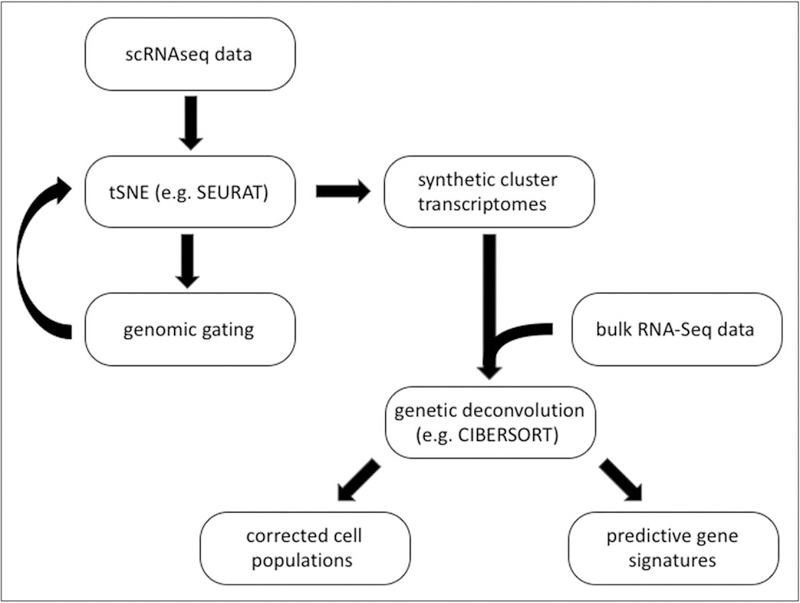
Proposed analysis workflow of single-cell RNA sequencing data. The prognostic value of gene signature requires data sets including patient follow-up information.
THE IMMUNE CELL LANDSCAPE IN ATHEROSCLEROSIS ASSESSED BY MASS CYTOMETRY
Mass cytometry (CyTOF) allows for the simultaneous detection of up to 42 parameters based on metal-conjugated monoclonal antibodies with no spectral overlap [29]. These are clear advantages over FACS. We recently performed CyTOF to more comprehensively and precisely assess the immune landscape in the Apoe–/– model of atherosclerosis [23■■,28■■]. We applied a 35-marker CyTOF panel followed by Pheno-Graph, a dimensionality reduction and unsupervised clustering algorithm [30]. Of the, at least, 32 billion possible marker combinations, the analysis grouped aortic leukocytes into 23 clusters (Table 2), including four B-cell clusters, five T-cell clusters, NK cells, eosinophils, neutrophils, three dendritic cell clusters, two monocyte clusters, three macrophage clusters and three yet unknown populations with unique marker combinations. Although the frequency of macrophages was unsurprisingly increasing in the aorta of Apoe–/– mice fed Western diet, one B-cell population and a Ly-6Chi CD8+ T-cell population both vanished [23■■]. Cole et al. [31■] identified 13 principal aortic immune populations in aortas of Apoe–/– mice including one population each of neutrophils, eosinophils, B cells, monocytes, macrophages, CD4+ T cells, CD8+ T cells, γδ T cells, NK cells, ILCs, plasmacytoid dendritic cells and two populations of dendritic cells. Subclustering of only myeloid cells uncovered 20 different populations of which subsets of CD169+CD206+ macrophages (one expressing CD209b and the other not) and common dendritic cells were significantly reduced in the aortae of cholate-free high-fat-fed Apoe–/– mice [31■].
Table 2.
Comparison of aortic leukocyte population of Apoe−/− and Ldlr−/− mice identified by single-cell RNA sequencing and mass cytometry
| Publication | Cochain et al. [28■■] |
Cochain et al. [28■■] |
Cochain et al. [28■■] |
Cochain et al. [28■■] |
Winkels et al. [23■■] |
Winkels et al. [23■■] |
Winkels et al. [23■■] |
Winkels et al. [23■■] |
|---|---|---|---|---|---|---|---|---|
| Method | ScRNAseq | scRNAseq | scRNAseq | scRNAseq | scRNAseq | scRNAseq | CyTOF | CyTOF |
| Model | Ldlr−/− | Ldlr−/− | Ldlr−/− | Apoe−/− | Apoe−/− | Apoe−/− | Apoe−/− | Apoe−/− |
| Age | 17–19 weeks | 17–19 weeks | 26–28 weeks | 20 weeks | 8 weeks | 20 weeks | 20 weeks | 20 weeks |
| Diet | CD/11-week HFD | 11-week HFD | 20-week HFD | 12-week WD | CD | CD/12-week WD | CD | 12-week WD |
| Subsets, n | 13 | 12 | 9 | 13 | 5 | 11 (+1) | 23 | 21 |
| B | B | B | B | B (1) | B | B (1) | B (1) | |
| B | B (2) | B (2) | B (2) | B (2) | ||||
| B | B (3) (by genomic gating) |
B (3) | B (3) | |||||
| B | B (4) | B (4) | ||||||
| Memory T cells | Memory T cells | Memory T cells | ||||||
| Th17 | Th17 cells | |||||||
| Th2 | Th2 cells | |||||||
| CD4+ T cells | Ly6-Chi | Ly6-Chi | ||||||
| CD4+ T cells | Ly6-Cneg | Ly6-Cneg | ||||||
| γδ-T Cells | γδ-T Cells | γδ-T Cells | ||||||
| T cells | T cells (1) | |||||||
| T cells | T cells (2) | |||||||
| T cells | T cells (3) | |||||||
| T cells | CXCR6+ | CXCR6+ | CXCR6+ | CXCR6+ | ||||
| CD8+ T cells | CD8 T cells | CD8 T cells | CD8 T cells | CD8 T cells | CD8 T cells | |||
| CD8+ T cells | Ly6-Chi | |||||||
| CD8+ T cells | Ly6-Cneg | Ly6-Cneg | ||||||
| NK cells | NK | NK | NK | NK | NK | NK | NK | NK |
| Monocytes | Monocytes | Monocytes | Monocytes | Monocytes | Ly6-Clo | Ly6-Clo | ||
| Monocytes | Ly6-C+ | Ly6-C+ | Ly6-C+ | |||||
| Dendritic cells | MoDC/DC | MoDC/DC | MoDC/DC | MoDC/DC | MHC-IIhi CD117hi | MHC-IIhi CD117hi | ||
| Dendritic cells | CD103hi MHC-IIlo | CD103hi MHC-IIlo | ||||||
| Dendritic cells | CD117med MHC-IImed | CD117med MHC-IImed | ||||||
| Granulocytes | Granulocytes | Granulocytes | Neutrophils | Neutrophils | ||||
| Granulocytes | Eosinophils | Eosinophils | ||||||
| Macrophages | Resident-like | Resident-like | Resident-like | Macrophages | Macrophages 1 | Macrophages | F4/80hi CD64med | F4/80hi CD64med |
| Macrophages | Inflammatory | Inflammatory | Inflammatory | Macrophages 2 | F4/80med CD64hi | F4/80med CD64hi | ||
| Macrophages | TREM2hi | TREM2hi | TREM2hi | CD11cmed F4/80lo | CD11cmed F4/80lo | |||
| Myeloid | Mixed/mast cells | Mixed/mast cells | ||||||
| Unknown | Myeloid cells/monocytes | |||||||
| Unknown | Mixed/proliferating cells | |||||||
| Unknown | Mixed cells | |||||||
| Unknown | Mixed/T cells 1 | Mixed T cells | ||||||
| Unknown | Mixed/T cells 2 | |||||||
| Unknown | CD4/CD8 | CD4/CD8 | CD4/CD8 | |||||
| Unknown | Mixed T/B cells | |||||||
| Unknown | CD4loCD25hi CD43hi | CD4loCD25hi CD43hi | ||||||
| Unknown | TCRβloIgMlo CD11clo | TCRβloIgMlo CD11clo |
CD, chow diet; CyTOF, mass cytometry; DC, dendritic cell; HFD, high-fat diet; MoDC, monocyte-derived dendritic cell; scRNAseq, single-cell RNA sequencing; WD, Western-type diet.
BEFORE SINGLE-CELL RNA SEQUENCING
Trogan et al. [32] dissected macrophage-rich areas of atherosclerotic plaques from Apoe–/– mice by laser-capture microdissection (LCM) and analyzed the expression of several macrophage-related genes by quantitative PCR. Microarray analysis of LCM-dissected CD68+ cells from shoulder regions of human plaques showed 72 genes, among them IRF5 and CSF1, to be upregulated compared with in-vitro stimulated THP1 cells [33]. LCM was used to generate the first aortic transcript atlas of wild-type and atherosclerotic Apoe–/– mice [34■,35■,36]. Although not single-cell, this LCM effort yielded transcriptional profiles of the plaque, media, adventitia and adventitia harboring arterial tertiary lymphoid organs (ATLOs). LCM and microarrays also showed differences in the transcriptional landscape of atherosclerotic plaques obtained by carotid endarterectomy from symptomatic and nonsymptomatic patients [37■].
Next-generation sequencing allows for a deeper insight into the entire transcriptome without having to decide a priori which transcripts should be measured. This methodology was first used in atherosclerosis to determine the transcriptional differences of effector T cells (Teff), Tregs and a newly defined population of CCR5+ Teff cells appearing at later stages of atherosclerosis [38]. FACS-sorting the cells requires a-priori knowledge of the phenotype (surface markers) of the cell type to be analyzed. Thus, bulk transcriptomics is less suitable for discovery purposes of yet undefined cell types.
SINGLE-CELL RNA SEQUENCING
The first application of single-cell transcriptomics in atherosclerosis focused on T cells and described a population called Th1/Tregs [39■■], which is very similar to the aforementioned CCR5+ Teff cells. This group used the Fluidigm C1 single microfluidics chip device (Fluidigm, California, USA) for capturing and preparing libraries of 270 cells of interest sorted by FACS.
Microfluidic devices encapsulating single cells in solvent droplets embedded in silicone oil recently became commercially available (10× Genomics, Pleasanton, California, USA), allowing for massively parallel transcriptome assessment of single cells (Drop-Seq) [40]. This technology, used in two recent publications, is now robust, reproducible and economical [23■■,28■■]. At this time, new scRNAseq techniques are being described every year, and the field is not settled. There are significant differences in sensitivity, coverage, precision, reproducibility, cost, time and scalability [41].
Most of the scRNAseq techniques enrich only for the 3′ ends of the transcripts; however, a switching mechanism at the 5′ end of the RNA template, (SMART)-Seq and its derivatives [42,43], produces reads spanning entire transcripts. Although the former can be suitable for studies exploring the heterogeneity of various tissues, only the latter can be used to study splicing isoforms, structural variation and single-nucleotide polymorphisms.
A known shortcoming of Drop-Seq is the random encapsulation of cells into the drops, so abundant cell types are sequenced more often than rare ones. Another inherent shortcoming is the occurrence of doublets, which can be mitigated by reducing the number of cells per microfluidic channel [44], but this increases the cost per cell.
IMMUNE CELL HETEROGENEITY IN ATHEROSCLEROSIS ASSESSED BY SINGLE-CELL RNA SEQUENCING
scRNAseq identified 11– 13 distinct immune cell populations (Table 2) based on SEURAT, an algorithm that provides unsupervised identification of cells based on similarity in their transcriptomes [45]. The Drop-Seq approach detected an average of 1004–1873 genes per cell, which is state of the art and accounts for about 10% of the transcriptome [23■■,28■■]. Increasing sequencing depth would not detect more genes, as saturation was already reached at 1 million reads per cell. Genomic gating by Seq-Geq (FlowJo LLC, Ashland, California, USA) of scRNAseq data increased the B-cell diversity from two populations to three, which is the same number found by mass cytometry and FACS (Table 2). A B1-like cell subset was enriched for tumor necrosis factor signaling and produced large amounts of CCL5, suggesting a functional role to recruit more immune cells to the aorta [23■■]. Furthermore, two B2-like subsets, both producing IFNγ and granuolcyte monocyte colony stimulating factor, were identified.
Macrophages are resident in almost all healthy tissues [46] including healthy mouse aortae [2]. The transcriptomes of FACS-sorted macrophages have been reported [47,48], but the two recent publications [23■■,28■■] are the first to show evidence of macrophage heterogeneity in atherosclerotic mouse aortae. All macrophages express the adhesion G-protein-coupled receptor, F4/80, and most also express the Fcg receptor-1 (CD64) and the receptor tyrosine kinase, MerTK [48,49]. In healthy mouse aortae, only a single population of macrophages was found by scRNAseq [28■■], which corresponded to previously defined resident vascular macrophages [2]. In atherosclerotic Ldlr–/– aortae, two additional subsets of macrophages were uncovered, one of which uniquely expressed TREM2 and another resembled an inflammatory macrophage phenotype that may be specific for atherosclerosis [28■■]. In atherosclerotic Apoe–/– mice, CyTOF identified three macrophage subsets that expressed CX3CR1, CD11c and CD103, respectively (Table 2 and [23■■]). Genomic gating of scRNAseq data for Adgre1 (F4/80) and Cd68 revealed four macrophage subsets. It is not known if and how these correspond to the subsets seen in aortae of Ldlr–/– mice.
Direct comparison of the principal immune cell populations across the single-cell transcriptomes reveals similar proportions of NK cells and a higher abundance of T cells in aortae of Apoe–/– mice, whereas macrophages, although increasing upon Western diet feeding in both mice, are more predominant in Ldlr–/– mice (Fig. 2). Significantly, the frequency of B cells is higher in Apoe–/– and Ldlr–/– mice fed chow diet compared with Ldlr–/– mice fed a cholesterol-rich diet. This suggests a substantial dynamic range of aortic immune cells across the different models. However, at this point, it is unclear whether a difference in digestion protocols (digest for 60 min [23■■] vs. 40 min [28■■]) might favor the isolation of lymphocytes or myeloid cells.
FIGURE 2.
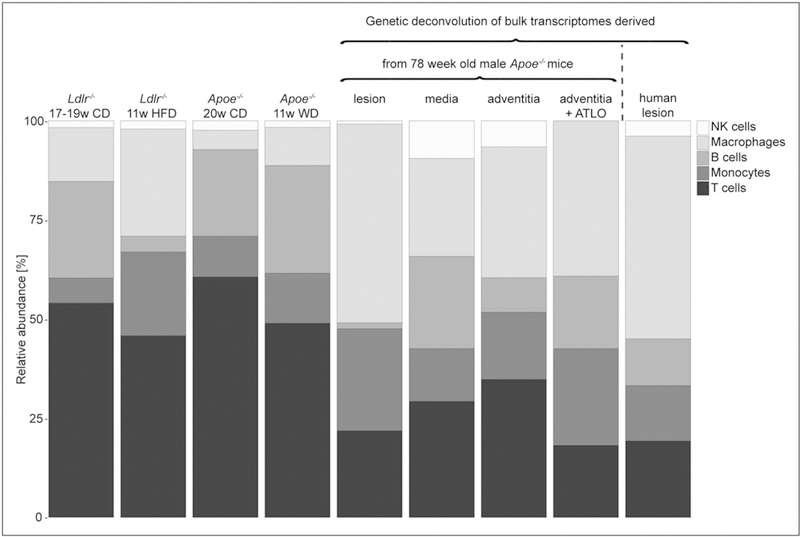
Relative presence of principal immune populations (NK cells, macrophages, B cells, monocytes, T cells) in the aortae of Apoe–/– and Ldlr–/– identified by single-cell RNA sequencing [23■■,28■■]. Bulk transcriptomes derived by laser capture microdissection from lesion, media, adventitia, and adventitia with artery tertiary lymphoid organ from 78-week old Apoe–/– mice (GSE21419) were genetically deconvolved with the single-cell transcriptome signatures of the principal immune cell populations in the aorta of Apoe–/– mice [23■■]. Similarly, bulk transcriptomes of 126 human lesions obtained by carotid endarterectomy were genetically deconvolved with the same single-cell transcriptome signatures [23■■].
GENE SIGNATURES AS PROGNOSTIC MARKERS
Single-cell technologies, like CyTOF and scRNAseq, have provided promising advances in many diseases and disease models. Spitzer et al. [50] observed a multiorgan immune system response during cancer treatment and found that specific cell-type abundance predicted effective cancer therapy. Immune cell signatures before surgery predict recovery [51]. Activation and responsiveness states of B-cell sub-sets in the bone marrow were found to predict relapse in patients with B-cell precursor acute lymphoblastic leukemia [52]. Gene signatures from bulk transcriptomic data have shown promise as prognostic or diagnostic indicators of disease [53–55]. Gene expression deconvolution algorithms, such as CIBERSORT [56], allow for the in-silico dissection of biopsies from patients by probing the transcriptome of individual leukocyte signatures and estimating their respective abundance [57]. We extracted 11 signatures from the single-cell transcriptomes of the murine aortic leukocytes and tested whether these signatures had predictive value in the BiKE cohort [37■] (Fig. 1). The BiKE study contains bulk transcriptomes from 100 human atherosclerotic plaques from carotid endarterectomies. As in mouse lesions, the predominant signature is derived from macrophages (55%), whereas T cells, B cells and monocytes make up 40% of the lesional immune cells, and NK cells are the smallest population (Fig. 2). From all 11 single-cell transcriptomes identified in atherosclerotic mouse aortae, the memory T-cell population correlated negatively and significantly with ischemic event-free survival of the patient [23■■].
Although single-cell methods require dissection and digestion, which means cellular spatial information is lost, we were able to gain insight into the spatial distribution of some immune cell populations by genetically deconvolving the individual mouse immune cell signatures with bulk transcriptomes derived by LCM of murine aortae (lesion, media, adventitia and adventitia with ATLOs) (Fig. 2 and [23■■]). This confirmed that the majority of aortic B cells reside in the adventitia, whereas macrophages, T cells and monocytes populate the plaque (Fig. 2 and [23■■]). This approach also corrects for the under-sampling of macrophages caused by the digestion and mechanical disruption of the tissue.
LIMITATIONS
Although CyTOF and scRNAseq provide a wealth of information, they both share the need for making single-cell suspensions by enzymatic and mechanical tissue disruption. Although dead cells are excluded by staining in CyTOF, cell death does not affect all cells equally, and this distorts the proportions. Large, branched cells like macrophages are systematically undersampled, as they are more likely to be destroyed by the enzymatic and mechanical dissociation [58]. As mentioned above, this can be corrected by running the scRNAseq-based gene signatures on bulk transcriptomes of LCM material using CIBERSORT. Contamination with circulating leukocytes can be controlled by injecting an anti-CD45 antibody to stain intravascular leukocytes and exclude them from subsequent analysis.
CyTOF is a destructive method, which means the cells analyzed cannot be recovered. CyTOF is currently limited by 42 lanthanide isotopes that are commercially available, but more metals are likely to become available soon. The most severe drawback of CyTOF is that it depends on user-driven selection of markers.
scRNAseq is truly hypothesis-free, but the spatial location of the interrogated cells is usually lost. An attempt to circumvent this limitation is the use of a photoconvertible fluorochrome to label a subset of immune cells in a known location before harvesting [59]. Downstream analysis of scRNAseq is more complex than bulk RNA sequencing due to the increased technical variability among individual cells, which can be attributed to the cell-cycle state [60], the burstiness of gene expression [61], the drop-out probability of low-expressed genes and the different PCR efficiency across the cells and across transcripts within the same cell. The lack of depth in scRNAseq transcriptomes appears to be fundamental and, in part, represents the fact that rare transcripts may not be in the cell at the time of harvest (stochastic dropouts). This can be overcome, partly, by constructing synthetic transcriptomes from the cells found in each t-distributed stochastic neighbor embedding cluster.
CONCLUSION
The immune system plays a crucial role in the progression and modulation of atherosclerosis. High-modality technologies including CyTOF and scRNAseq uncovered an unexpected diversity among aortic leukocytes. Furthermore, signatures constructed from single-cell transcriptomes can be useful to predict secondary ischemic events [23■■]. Although both CyTOF and scRNASeq were capable of detecting the principle immune subsets, an integration of single-cell protein and transcriptome information may uncover a potentially even larger heterogeneity among aortic immune subsets. Also, a single immune cell atlas of human plaques is yet missing. The information gained by these data will help to specifically tailor new therapeutic strategies for altering the immune response in atherosclerosis.
KEY POINTS.
Mass cytometry and scRNAseq are powerful, high-parametric technologies for uncovering leukocyte diversity and yet unknown leukocyte populations.
Both methodologies revealed an unexpected diversity among aortic leukocytes.
scRNAseq reveals leukocyte subset signatures, which can be used to deconvolve bulk transcriptomes to assess the relative contribution of immune cells within the assessed tissue.
Additional technological advances will provide a deeper look into the transcriptome, simultaneous integration of protein information and high-throughput capacity.
Acknowledgements
Financial support and sponsorship
H.W. was supported by DFG award (GZ WI 4811/1-1), K.L. was supported by grants HL115232, HL88093 and HL121697 from the National Heart, Lung, and Blood Institute.
Footnotes
Conflicts of interest
There are no conflicts of interest.
REFERENCES AND RECOMMENDED READING
Papers of particular interest, published within the annual period of review, have been highlighted as:
■ of special interest
■■ of outstanding interest
- 1.Hansson GK, Libby P, Tabas I. Inflammation and plaque vulnerability. J Intern Med 2015; 278:483–493. [DOI] [PMC free article] [PubMed] [Google Scholar]
- 2.Ensan S, Li A, Besla R, et al. Self-renewing resident arterial macrophages arise from embryonic CX3CR1(+) precursors and circulating monocytes immediately after birth. Nat Immunol 2016; 17:159–168. [DOI] [PubMed] [Google Scholar]
- 3.Galkina E, Kadl A, Sanders J, et al. Lymphocyte recruitment into the aortic wall before and during development of atherosclerosis is partially L-selectin dependent. J Exp Med 2006; 203:1273–1282.■■ The first study assessing leukocyte diversity in atherosclerotic aortas by flow cytometry.
- 4.Butcher MJ, Herre M, Ley K, Galkina E. Flow cytometry analysis of immune cells within murine aortas. J Vis Exp 2011; 53:2848. [DOI] [PMC free article] [PubMed] [Google Scholar]
- 5.Shankman LS, Gomez D, Cherepanova OA, et al. KLF4-dependent phenotypic modulation of smooth muscle cells has a key role in atherosclerotic plaque pathogenesis. Nat Med 2015; 21:628–637. [DOI] [PMC free article] [PubMed] [Google Scholar]
- 6.Feil S, Fehrenbacher B, Lukowski R, et al. Transdifferentiation of vascular smooth muscle cells to macrophage-like cells during atherogenesis. Circ Res 2014; 115:662–667. [DOI] [PubMed] [Google Scholar]
- 7.Robbins CS, Hilgendorf I, Weber GF, et al. Local proliferation dominates lesional macrophage accumulation in atherosclerosis. Nat Med 2013; 19:1166–1172.■ The study highlights the contribution of macrophage proliferation to atherosclerosis.
- 8.Majesky MW, Horita H, Ostriker A, et al. Differentiated smooth muscle cells generate a subpopulation of resident vascular progenitor cells in the adventitia regulated by Klf4. Circ Res 2017; 120:296–311. [DOI] [PMC free article] [PubMed] [Google Scholar]
- 9.Koltsova EK, Garcia Z, Chodaczek G, et al. Dynamic T cell-APC interactions sustain chronic inflammation in atherosclerosis. J Clin Invest 2012; 122:3114–3126. [DOI] [PMC free article] [PubMed] [Google Scholar]
- 10.Drechsler M, Megens RT, van Zandvoort M, et al. Hyperlipidemia-triggered neutrophilia promotes early atherosclerosis. Circulation 2010; 122:1837–1845. [DOI] [PubMed] [Google Scholar]
- 11.Swirski FK, Libby P, Aikawa E, et al. Ly-6Chi monocytes dominate hypercholesterolemia-associated monocytosis and give rise to macrophages in atheromata. J Clin Invest 2007; 117:195–205. [DOI] [PMC free article] [PubMed] [Google Scholar]
- 12.Paulson KE, Zhu SN, Chen M, et al. Resident intimal dendritic cells accumulate lipid and contribute to the initiation of atherosclerosis. Circ Res 2010; 106:383–390. [DOI] [PubMed] [Google Scholar]
- 13.Daissormont IT, Christ A, Temmerman L, et al. Plasmacytoid dendritic cells protect against atherosclerosis by tuning T-cell proliferation and activity. Circ Res 2011; 109:1387–1395. [DOI] [PMC free article] [PubMed] [Google Scholar]
- 14.Doring Y, Manthey HD, Drechsler M, et al. Auto-antigenic protein-DNA complexes stimulate plasmacytoid dendritic cells to promote atherosclerosis. Circulation 2012; 125:1673–1683. [DOI] [PubMed] [Google Scholar]
- 15.Cochain C, Koch M, Chaudhari SM, et al. CD8+ T cells regulate monopoiesis and circulating Ly6C-high monocyte levels in atherosclerosis in mice. Circ Res 2015; 117:244–253. [DOI] [PubMed] [Google Scholar]
- 16.Vu DM, Tai A, Tatro JB, et al. GammadeltaT cells are prevalent in the proximal aorta and drive nascent atherosclerotic lesion progression and neutrophilia in hypercholesterolemic mice. PLoS One 2014; 9:e109416. [DOI] [PMC free article] [PubMed] [Google Scholar]
- 17.Gjurich BN, Taghavie-Moghadam PL, Galkina EV. Flow cytometric analysis of immune cells within murine aorta. Methods Mol Biol 2015; 1339:161–175. [DOI] [PMC free article] [PubMed] [Google Scholar]
- 18.Smith E, Prasad KM, Butcher M, et al. Blockade of interleukin-17A results in reduced atherosclerosis in apolipoprotein E-deficient mice. Circulation 2010; 121:1746–1755. [DOI] [PMC free article] [PubMed] [Google Scholar]
- 19.Clement M, Guedj K, Andreata F, et al. Control of the T follicular helper-germinal center B-cell axis by CD8(+) regulatory T cells limits atherosclerosis and tertiary lymphoid organ development. Circulation 2015; 131:560–570. [DOI] [PubMed] [Google Scholar]
- 20.Maganto-Garcia E, Tarrio ML, Grabie N, et al. Dynamic changes in regulatory T cells are linked to levels of diet-induced hypercholesterolemia. Circulation 2011; 124:185–195. [DOI] [PMC free article] [PubMed] [Google Scholar]
- 21.Frostegard J, Ulfgren AK, Nyberg P, et al. Cytokine expression in advanced human atherosclerotic plaques: dominance of pro-inflammatory (Th1) and macrophage-stimulating cytokines. Atherosclerosis 1999; 145:33–43. [DOI] [PubMed] [Google Scholar]
- 22.Schulte S, Sukhova GK, Libby P. Genetically programmed biases in Th1 and Th2 immune responses modulate atherogenesis. Am J Pathol 2008; 172:1500–1508. [DOI] [PMC free article] [PubMed] [Google Scholar]
- 23.Winkels H, Ehinger E, Vassallo M, et al. Atlas of the immune cell repertoire in mouse atherosclerosis defined by single-cell RNA-sequencing and mass cytometry. Circ Res 2018; 122:1675–1688.■■ The first study assessing leukocyte diversity in atherosclerotic aortae by single-cell RNA sequencing (scRNAseq) and mass cytometry.
- 24.Rombouts M, Ammi R, Van Brussel I, et al. Linking CD11b ( ) dendritic cells and natural killer T cells to plaque inflammation in atherosclerosis. Mediators Inflamm 2016; 2016:6467375. [DOI] [PMC free article] [PubMed] [Google Scholar]
- 25.Engelbertsen D, Foks AC, Alberts-Grill N, et al. Expansion of CD25 innate lymphoid cells reduces atherosclerosis. Arterioscler Thromb Vasc Biol 2015; 35:2526–2535. [DOI] [PMC free article] [PubMed] [Google Scholar]
- 26.Newland SA, Mohanta S, Clement M, et al. Type-2 innate lymphoid cells control the development of atherosclerosis in mice. Nat Commun 2017; 8:15781. [DOI] [PMC free article] [PubMed] [Google Scholar]
- 27.Galkina E, Harry BL, Ludwig A, et al. CXCR6 promotes atherosclerosis by supporting T-cell homing, interferon-gamma production, and macrophage accumulation in the aortic wall. Circulation 2007; 116:1801–1811. [DOI] [PubMed] [Google Scholar]
- 28.Cochain C, Vafadarnejad E, Arampatzi P, et al. Single-cell RNA-seq reveals the transcriptional landscape and heterogeneity of aortic macrophages in murine atherosclerosis. Circ Res 2018; 122:1661–1674.■■ A pioneering study uncovering macrophage heterogeneity in atherosclerotic aortae by scRNAseq.
- 29.Spitzer MH, Nolan GP. Mass cytometry: single cells, many features. Cell 2016; 165:780–791. [DOI] [PMC free article] [PubMed] [Google Scholar]
- 30.Levine JH, Simonds EF, Bendall SC, et al. Data-driven phenotypic dissection of AML reveals progenitor-like cells that correlate with prognosis. Cell 2015; 162:184–197. [DOI] [PMC free article] [PubMed] [Google Scholar]
- 31.Cole JE, Park I, Ahern D, et al. Immune cell census in murine atherosclerosis: cytometry by time of flight illuminates vascular myeloid cell diversity. Cardiovasc Res 2018; doi: 10.1093/cvr/cvy109. [Epub ahead of print]■ An important study examining aortic myeloid cell diversity by mass cytometry.
- 32.Trogan E, Choudhury RP, Dansky HM, et al. Laser capture microdissection analysis of gene expression in macrophages from atherosclerotic lesions of apolipoprotein E-deficient mice. Proc Natl Acad Sci U S A 2002; 99:2234–2239. [DOI] [PMC free article] [PubMed] [Google Scholar]
- 33.Tuomisto TT, Korkeela A, Rutanen J, et al. Gene expression in macrophage-rich inflammatory cell infiltrates in human atherosclerotic lesions as studied by laser microdissection and DNA array: overexpression of HMG-CoA reductase, colony stimulating factor receptors, CD11A/CD18 integrins, and interleukin receptors. Arterioscler Thromb Vasc Biol 2003; 23:2235–2240. [DOI] [PubMed] [Google Scholar]
- 34.Grabner R, Lotzer K, Dopping S, et al. Lymphotoxin beta receptor signaling promotes tertiary lymphoid organogenesis in the aorta adventitia of aged ApoE–/– mice. J Exp Med 2009; 206:233–248.■ This is a valuable resource providing bulk transcriptomes of different layers of the murine aorta at different stages of atherosclerosis.
- 35.Beer M, Doepping S, Hildner M, et al. Laser-capture microdissection of hyperlipidemic/ApoE(‒)/(‒) mouse aorta atherosclerosis. Methods Mol Biol 2011; 755:417–428.■ This is a valuable resource providing bulk transcriptomes of different layers of the murine aorta at different stages of atherosclerosis.
- 36.Yin C, Mohanta S, Ma Z, et al. Generation of aorta transcript atlases of wild-type and apolipoprotein E-null mice by laser capture microdissection-based mRNA expression microarrays. Methods Mol Biol 2015; 1339: 297–308. [DOI] [PubMed] [Google Scholar]
- 37.Folkersen L, Persson J, Ekstrand J, et al. Prediction of ischemic events on the basis of transcriptomic and genomic profiling in patients undergoing carotid endarterectomy. Mol Med 2012; 18:669–675.■ The study encompasses bulk transcriptomes of 126 human plaques and patient follow-up information.
- 38.Li J, McArdle S, Gholami A, et al. CCR5+ T-bet+ FoxP3+ effector CD4 T cells drive atherosclerosis. Circ Res 2016; 118:1540–1552. [DOI] [PMC free article] [PubMed] [Google Scholar]
- 39.Butcher MJ, Filipowicz AR, Waseem TC, et al. Atherosclerosis-driven Treg plasticity results in formation of a dysfunctional subset of plastic IFNgamma+ Th1/Tregs. Circ Res 2016; 119:1190–1203.■■ The first study using single-cell transcriptomics in atheroslerosis research.
- 40.Zheng GX, Terry JM, Belgrader P, et al. Massively parallel digital transcriptional profiling of single cells. Nat Commun 2017; 8:14049. [DOI] [PMC free article] [PubMed] [Google Scholar]
- 41.Ziegenhain C, Vieth B, Parekh S, et al. Comparative analysis of single-cell RNA sequencing methods. Mol Cell 2017; 65:631–643.e34. [DOI] [PubMed] [Google Scholar]
- 42.Ramskold D, Luo S, Wang YC, et al. Full-length mRNA-Seq from single-cell levels of RNA and individual circulating tumor cells. Nat Biotechnol 2012; 30:777–782. [DOI] [PMC free article] [PubMed] [Google Scholar]
- 43.Picelli S, Bjorklund AK, Faridani OR, et al. Smart-seq2 for sensitive full-length transcriptome profiling in single cells. Nat Methods 2013; 10:1096–1098. [DOI] [PubMed] [Google Scholar]
- 44.Macosko EZ, Basu A, Satija R, et al. Highly parallel genome-wide expression profiling of individual cells using nanoliter droplets. Cell 2015; 161:1202–1214. [DOI] [PMC free article] [PubMed] [Google Scholar]
- 45.Satija R, Farrell JA, Gennert D, et al. Spatial reconstruction of single-cell gene expression data. Nat Biotechnol 2015; 33:495–502. [DOI] [PMC free article] [PubMed] [Google Scholar]
- 46.Amit I, Winter DR, Jung S. The role of the local environment and epigenetics in shaping macrophage identity and their effect on tissue homeostasis. Nat Immunol 2016; 17:18–25. [DOI] [PubMed] [Google Scholar]
- 47.Cortese R, Gileles-Hillel A, Khalyfa A, et al. Aorta macrophage inflammatory and epigenetic changes in a murine model of obstructive sleep apnea: potential role of CD36. Sci Rep 2017; 7:43648. [DOI] [PMC free article] [PubMed] [Google Scholar]
- 48.Rahman K, Vengrenyuk Y, Ramsey SA, et al. Inflammatory Ly6Chi monocytes and their conversion to M2 macrophages drive atherosclerosis regression. J Clin Invest 2017; 127:2904–2915. [DOI] [PMC free article] [PubMed] [Google Scholar]
- 49.Gautier EL, Shay T, Miller J, et al. Gene-expression profiles and transcriptional regulatory pathways that underlie the identity and diversity of mouse tissue macrophages. Nat Immunol 2012; 13:1118–1128. [DOI] [PMC free article] [PubMed] [Google Scholar]
- 50.Spitzer MH, Carmi Y, Reticker-Flynn NE, et al. Systemic immunity is required for effective cancer immunotherapy. Cell 2017; 168:487–502.e15. [DOI] [PMC free article] [PubMed] [Google Scholar]
- 51.Gaudilliere B, Fragiadakis GK, Bruggner RV, et al. Clinical recovery from surgery correlates with single-cell immune signatures. Sci Transl Med 2014; 6:255ra131. [DOI] [PMC free article] [PubMed] [Google Scholar]
- 52.Good Z, Sarno J, Jager A, et al. Single-cell developmental classification of B cell precursor acute lymphoblastic leukemia at diagnosis reveals predictors of relapse. Nat Med 2018; 24:474–483. [DOI] [PMC free article] [PubMed] [Google Scholar]
- 53.Buscher K, Ehinger E, Gupta P, et al. Natural variation of macrophage activation as disease-relevant phenotype predictive of inflammation and cancer survival. Nat Commun 2017; 8:16041. [DOI] [PMC free article] [PubMed] [Google Scholar]
- 54.Burel JG, Peters B. Discovering transcriptional signatures of disease for diagnosis versus mechanism. Nat Rev Immunol 2018; 18:289–290. [DOI] [PMC free article] [PubMed] [Google Scholar]
- 55.Ng SW, Mitchell A, Kennedy JA, et al. A 17-gene stemness score for rapid determination of risk in acute leukaemia. Nature 2016; 540:433–437. [DOI] [PubMed] [Google Scholar]
- 56.Newman AM, Liu CL, Green MR, et al. Robust enumeration of cell subsets from tissue expression profiles. Nat Methods 2015; 12:453–457. [DOI] [PMC free article] [PubMed] [Google Scholar]
- 57.Gentles AJ, Newman AM, Liu CL, et al. The prognostic landscape of genes and infiltrating immune cells across human cancers. Nat Med 2015; 21:938–945. [DOI] [PMC free article] [PubMed] [Google Scholar]
- 58.McArdle S, Mikulski Z, Ley K. Live cell imaging to understand monocyte, macrophage, and dendritic cell function in atherosclerosis. J Exp Med 2016; 213:1117–1131. [DOI] [PMC free article] [PubMed] [Google Scholar]
- 59.Medaglia C, Giladi A, Stoler-Barak L, et al. Spatial reconstruction of immune niches by combining photoactivatable reporters and scRNA-seq. Science 2017; 358:1622–1626. [DOI] [PMC free article] [PubMed] [Google Scholar]
- 60.Buettner F, Natarajan KN, Casale FP, et al. Computational analysis of cell-to-cell heterogeneity in single-cell RNA-sequencing data reveals hidden sub-populations of cells. Nat Biotechnol 2015; 33:155–160. [DOI] [PubMed] [Google Scholar]
- 61.Suter DM, Molina N, Gatfield D, et al. Mammalian genes are transcribed with widely different bursting kinetics. Science 2011; 332:472–474. [DOI] [PubMed] [Google Scholar]