Abstract
Purpose:
To design a non–patient-specific system to detect the electrical onset of seizures in patients with temporal lobe epilepsy.
Methods:
We used EEG data from 29 seizures of 18 temporal lobe epilepsy patients who underwent multiday video-scalp EEG monitoring as part of their presurgical evaluations. We segmented each data set into preictal and ictal phases, and identified spectral entropy, spectral energy, and signal energy as useful features for discriminating normal and seizure conditions. The performance of five different classifiers was analyzed using these features to design an automated detection system.
Results:
Among the five classifiers, decision tree, k-nearest neighbor, and support vector machine performed with sensitivity (specificity) of 79% (81%), 75% (85%), and 80% (86%), respectively. The other two, linear discriminant algorithm and Naive Bayes classifiers, performed with sensitivity (specificity) of 54% (94%), 47% (96%), respectively.
Conclusions:
The support vector machine–based seizure detection system showed better detection capability in terms of sensitivity and specificity measures as compared to linear discriminant algorithm, Naive Bayes, decision tree, and k-nearest neighbor classifiers.
Conclusions:
Our study shows that a generalized system to detect the electrical onset of seizures in temporal lobe epilepsy using scalp-recorded EEG is possible. If confirmed on a larger data set, our findings may have significant implications for the management of seizures, especially in patients with drug-resistant epilepsy.
Key Words: Epilepsy, EEG, Signal energy, Spectral energy, Spectral entropy, Classifier
Epilepsy comprises a heterogeneous group of disorders characterized by recurrent and unprovoked epileptic seizures because of sudden surges of synchronized electrical discharges in a population of neurons. The recurrent seizures that constitute epilepsy may be localized in origin (focal epilepsy) or may be generalized over the whole brain (generalized epilepsy).1 Worldwide, nearly 65 million people are affected by epilepsy, of whom one-third are resistant to antiepileptic drugs.2 A subset of patients with drug-resistant focal epilepsy are candidates for epilepsy surgery.3,4 The success of resective epilepsy surgery depends on accurate localization of the origin of the seizures by long-term video-EEG monitoring (VEM) and correlating the findings with structural abnormalities observable in magnetic resonance imaging.
A major concern of patients with epilepsy, especially those with drug-resistant epilepsy, is the random and unexpected occurrence of epileptic seizures. The anticipatory anxiety, feelings of helplessness, and restrictions in activities of daily living markedly impair the quality of life of individuals with poorly controlled epileptic seizures. An ability to detect the electrical onset of seizures could have a great impact on the management of epilepsy. Seizure detection could help in designing strategies to avoid injuries during seizures and could increase confidence in driving. During VEM, it facilitates the injection of radioisotopes for use in an ictal single photon emission tomography study. Warnings of impending seizures might also provide an opportunity to control the seizures by delivering fast-acting antiepileptic drugs or electric stimulation such as vagus nerve or direct brain stimulation.5–7 A seizure detection algorithm consists of two major parts: feature extraction and classification. Selection of optimal features discriminating normal and epileptic seizure activity is an essential task for any detection algorithm. The choice of features varies based on synchronous neuronal activity and may include autocorrelation, phase synchronization, pattern-match regularity statistic,8–10 and morphological characteristics of interictal spike discharges on the recorded EEG.11,12 The continuous discharges of polymorphic waveforms of different amplitude and frequency can be captured using spectral and wavelet features.13–18 Apart from these, statistical measures17–19 and entropy measures20–23 have been proposed to characterize EEG time series. The brain symmetry index of spatial and temporal measures has been proposed to localize the hemisphere of seizure onset,9,16 and an algorithm using autoregressive spectra has been designed for the detection of temporal lobe seizures.24 The best discriminating features are used to train the classifiers for automated categorization of a given pattern as normal or seizure-related. Several classifiers using decision rules from simple thresholds to complex decision boundaries have been proposed to define the classification as a two-class or multiclass problem.13,14,25,26 The support vector machine (SVM), a statistical machine learning algorithm, has been used in a wide range of biomedical applications, including automated seizure detection.15,17,27–29
During the last four decades, several studies have attempted to detect seizure occurrence based on changes in the EEG.30 However, reliably detecting an epileptic seizure remains an unsolved problem even today, for the following reasons. First, because electrical and clinical features of epileptic seizures differ from patient to patient and even between seizures in the same patient, it is difficult to develop a generic algorithm to forecast clinical seizures reliably. Most studies that have investigated patient-specific detection paradigms have used extensive machine training strategies for application to individual patients.13,15,31–33 Second, the methods used to detect seizures have differed widely and included a number of univariate and bivariate measures comprising both linear and nonlinear approaches with different classification algorithms, thereby making interstudy comparisons difficult.32,34,35 Third, most studies have used intracranially recorded EEG data because they are less prone to artifacts than scalp EEG signals.15,36,37 As intracranial EEG is invasive and can be undertaken only in a minority of patients, it would not be appropriate to generalize the findings to the majority of patients who undergo only scalp-recorded EEG.38 Finally, the influence that antiepileptic drug withdrawal can have on the electrical characteristics of the seizures in an individual patient is largely unknown.
Against this background, we designed this study to explore the utility of scalp-recorded EEG in detecting the electrical onset of seizures in a uniform cohort of well-characterized patients with drug-resistant temporal lobe epilepsy (TLE), who underwent multiday VEM as part of their presurgical evaluations. To achieve this objective, we applied a set of time and frequency measures—signal energy, spectral energy, and spectral entropy—to identify changes in the EEG before the clinical onset of seizures. We chose the essential feature space to discriminate the normal and seizure patterns for development of an automated system for the detection of the electrical onset of seizure. The performances of five different classifiers, namely the linear discriminant algorithm (LDA), Naive Bayes (NB), decision tree (DT), SVM, and k-nearest neighbors (KNN), are examined for the clinical utility of the system. We envisaged that the proposed algorithm would identify the electrical onset of seizures and would allow for the short-term prediction of clinical seizure onset, which might provide a window for diagnostic and therapeutic opportunities in the management of people with epileptic seizures.
MATERIALS AND METHODS
Patient Database
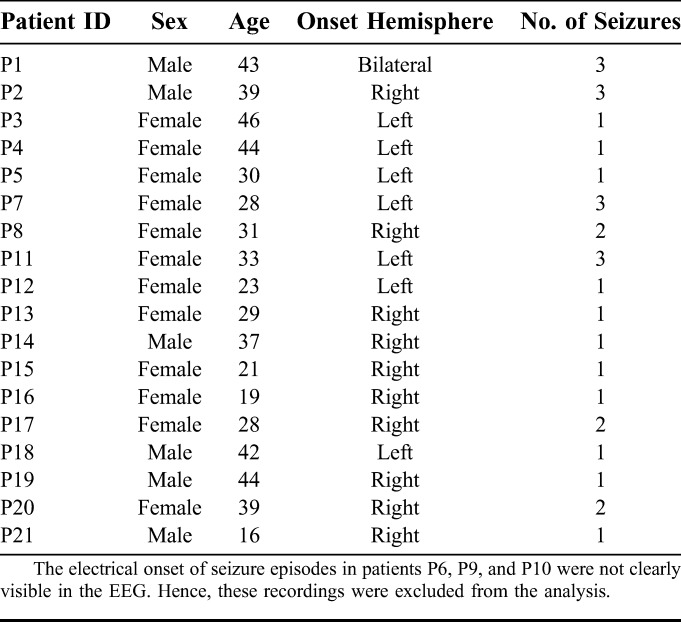
Data provided by two hospitals were used for this study: data set_1, with data from 11 patients (3 male and 8 female) collected at Sree Chitra Tirunal Institute of Medical Sciences and Technology, Trivandrum, Kerala, India, and data set_2 with data from 7 patients (3 male and 4 female) collected at Fortis Malar Hospital, Chennai, India. The ages of the 18 patients (6 male and 12 female) ranged from 16 to 46 years. There were 29 seizures recorded from the 18 patients. The clinical, EEG, and magnetic resonance imaging findings of these patients were consistent with the diagnosis of TLE. The VEM was undertaken per standard protocol, using 21 scalp electrodes placed according to the standard 10 to 20 system, which has been described in detail elsewhere.39 Permission was obtained from the Institute Ethical Committee to use the scalp-recorded VEM data for this study. A summary of the clinical characteristics is provided in Table 1. The recordings in data set_1 included two sphenoidal electrodes (Sph1 and Sph2) along with 21 scalp electrodes. The recorded EEG data were time samples as recorded using 32 channels digital video-EEG system. In data set_1, each channel was sampled at the rate of 400 Hz. In data set_2, each channel was recorded at the rate of 256 Hz and upsampled to 400 Hz to ensure uniform window length for data set_1 and data set_2.
TABLE 1.
Summary of Clinical Data
Preprocessing
Previous studies used different preictal durations of 5, 10, 20, 30, 40, 120, and 240 minutes to predict the electrical onset of seizure and the mean prediction time varied from a few seconds to minutes.6,7,40,41 Using the algorithm named Advanced Seizure Prediction via Pre-Ictal Relabeling (ASPPR), the best intervention time proposed for the prediction of the electrographic onset of seizures was 1 minute.42 A seizure usually lasts for 30 seconds to 2 minutes and is followed by a postictal phase lasting several minutes.3,41 According to the length of available EEG, the data were split into preictal and ictal phases. In this work, we defined the preictal phase as a 3-minute-long EEG sample immediately before the clinical onset, whereas the ictal phase was defined as a 2-minute EEG recording clipped immediately after the clinical onset (Fig. 1). Because our study considered only TLE, we restricted the analysis of the EEG to the four channels T1 and T3 from the left, and T2 and T4 from right sides of the scalp. Samples of 5 minutes of EEG from these four channels in 29 seizure recordings were used for the design of the automated detection system. The EEG was passed through a second-order high-pass filter to obtain 1 to 200 Hz signals. A notch filter was used to remove 50 Hz supply-line frequency and its 100, 150, and 200 Hz harmonics. Because the amplitude of each patient EEG varied, the signals were normalized to make the amplitudes relatively comparable across patients. The maximum and minimum values of each channel in the 29 seizure recordings were computed. The average of the 29 maximum values and average of the 29 minimum values were used to normalize the 5 minute EEG samples in all 29 seizure recordings, as specified in the following equation:
 |
where xnorm is the normalized value of x, xi is the instantaneous value of x, and Avg minimum and Avg maximum are the average minimum and maximum value computed from all 29 seizure recordings. This makes the EEG data suitable for the design of a patient-independent seizure detection system. After preprocessing, the sliding window technique was used to divide the 5 minute EEG signal into segments of 4-second duration. The 4 second predefined window was moved by 1 second, keeping 3 seconds of data overlapping with the previous window. For each 4 second window, five features—signal energy, spectral energy in 1 to 25 Hz, 25 to 100 Hz, and 100 to 200 Hz frequency bands, and spectral entropy (4 channels × 5 features = 20 features for each seizure recording)—were extracted to use in the automated system (Fig. 2).
FIG. 1.
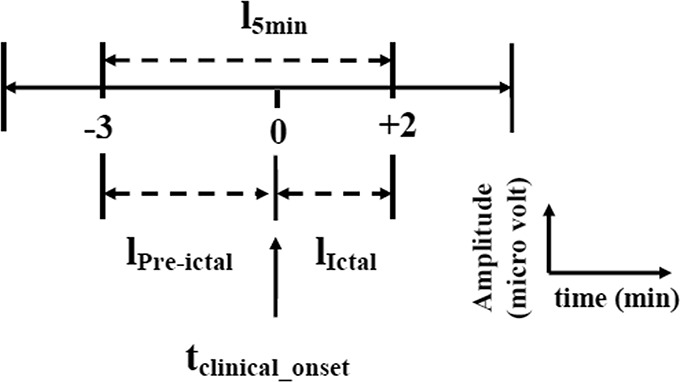
General schema of 5-minute EEG data selection of four selected channels with respect to clinical onset of seizure. A period of 3 minutes of EEG immediately before the clinical onset is referred to as lPre-ictal, and 2 minutes of EEG after the clinical onset is referred to as lIctal.
FIG. 2.
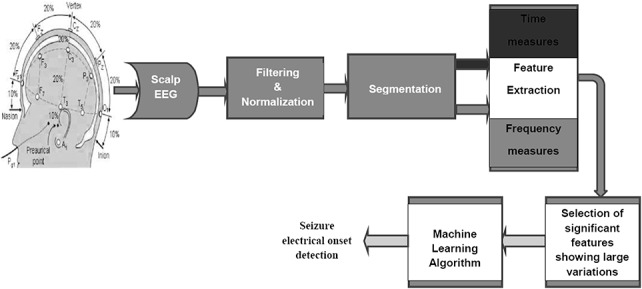
Steps in EEG data collection and processing for the automated seizure detection system. The image of the 10 to 20 electrode placement system used in this figure is adapted from Bioelectromagnetism, Principles and Applications of Bioelectric and Biomagnetic Fields (page no. 368) by J. Malmivuo and R. Plonsey, 1995, Oxford University Press, New York, adapted with permission.52
Feature Extraction
For each 5 minute recording with 4 second window moving at 1 second intervals, five features, namely signal energy, spectral energies—Elowband, Emidband, and Ehighband—and spectral entropy, were extracted to obtain the profile of amplitude and frequency variations to identify the seizure precursors.
Signal Energy
In the time domain, the signals were analyzed to track the changes in amplitude of brain potentials. The signal energy was measured as the sum of the squared instantaneous voltage of EEG samples. The energy of the signal was calculated by the following equation:
 |
where Ek is the signal energy in the k'th segment, k is the segment index, i is the sample index, D is the sampling rate, and xi is the instantaneous sample value.
Spectral Energy
The brain produces different rhythmic activity patterns depending on mental state and task performance. The power of the EEG signal is most concentrated in low frequencies. During the evolution of a seizure, changes in rhythmic activity occur. The seizure evolves with different morphologies in different frequency bands, including delta (δ): 0.5 to 4 Hz, theta (θ):4 to 8 Hz, alpha (α):8 to 12 Hz, and beta (β):13 to 30 Hz, showing amplitude depression and polyspike patterns along with large amplitude waves.43 Hence the energy variations before seizure onset are not always predictive, and the frequency signature during the transition from normal to ictal phases must be captured using frequency transformation tools to detect the seizure precursors. To identify the variations in frequency components, the spectral energy of the windowed EEG signal was calculated using the Fast Fourier Transform technique under the assumption that the EEG signal was statistically stationary within the segment. The spectral energy was calculated using the following equation:
 |
where Es is the spectral energy in the f1 to f2 band and X(ωi) is the Fourier coefficient of the signal at angular frequency ωi. The spectral energy was calculated in the Elowband (1–25 Hz), Emidband (25–100 Hz), and Ehighband (100–200 Hz) frequency bands.
Spectral Entropy
The entropy is a parameter that describes the irregularity, complexity, and unpredictable characteristics of a stochastic signal. During the normal state, the EEG signal is random in nature, but during the approach to a seizure, the brain produces deterministic oscillations with high neural synchrony. The spectral entropy is a suitable measure for capturing the synchronous activity of the brain. The major advantage of using spectral entropy is that the frequency band contributing the entropy is known and user-defined. The previous use of spectral entropy for detection20 and prediction44 motivated us to use this as one of the measures to detect the electrical onset of seizure. In the study of Blanco et al., the invasively measured spectral entropy showed variations in the high-frequency bands from 32 to 128 Hz. Because the scalp EEG was used in this study, we searched for oscillations with lower frequencies. The spectral entropy S was calculated using the following equation:
 |
where S is the spectral entropy in the frequency range f1 to f2, and p(fi) is the power spectral density of fi. The spectral entropy was calculated in the 3 to 12 Hz frequency band.
RESULTS
In this section, we will demonstrate the suitability of time and frequency measures—signal energy; spectral energies Elowband, Emidband, and Ehighband; and spectral entropy—to identify EEG changes at the electrical onset of seizures. We will also compare the performance of five classifiers using reduced feature spaces that accurately distinguish the normal and seizure patterns for use in automated detection.
Electrical Versus Clinical Onset of Seizures
For 29 scalp video-EEG recordings, the electrical onset (the first alteration in the scalp-recorded EEG) and clinical onset (the time at which the patient manifested the first observed alteration in behavior or motor activity in the synchronized video) of seizures were visually identified by the three neurologists involved with the study (K.R., C.R., and S.D.N.). Based on the electrical and clinical onset, the seizure recordings were divided into five groups. In the first group of nine seizures, the electrical onset preceded the clinical onset with mean latency of 54 seconds (median: 55 seconds; range: 42 seconds to 69 seconds). Figure 3 shows an example from the first group of the onset of seizure P1_s1 in the right temporal lobe, for four channels of the scalp EEG. The seizure started at 138 seconds at T2 in the right temporal region with 4 Hz oscillation and slowly spread to the contralateral hemisphere and the clinical seizure started at 180 seconds. In the second group of 5 seizures, the electrical onset preceded the clinical onset with a mean latency of 37 seconds (median: 38 seconds; range: 35 to 39 seconds). In the third group of four seizures, the electrical onset preceded the clinical onset with a mean latency of 23 seconds (median: 22 seconds; range: 21 to 28 seconds). In the fourth group of seven seizures, the electrical onset preceded the clinical onset with a mean latency of 16 seconds (median: 17 seconds; range: 13 to 19 seconds). In the fifth group of 5 seizures, the electrical onset preceded the clinical onset with a mean latency of 5 seconds (median: 5 seconds; range: 3 to 6 seconds). When all 29 seizures were considered, the mean time lapse between electrical onset and clinical onset was 29 seconds. The measured profile of each seizure recorded at 1 second interval was investigated with respect to the visually identified electrical and clinical onset to select the most useful measures for the automated system. The automated identification of electrical onset by classifiers trained using these significant features was compared with the results of manual identification.
FIG. 3.
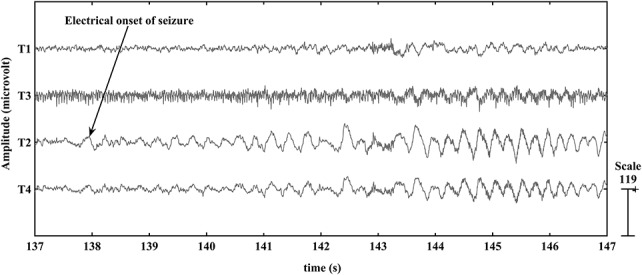
Scalp-recorded EEG of the selected electrodes in the P1_s1 seizure. The electrical onset of seizure P1_s1 was visually identified in the temporal region, and rhythmic theta activity commenced at the T2 electrode (arrow) at 138 seconds.
Feature Space Reduction
The five measures signal energy; spectral energies Elowband, Emidband, and Ehighband; and spectral entropy were investigated to select the best discriminating features for discrimination of the normal and seizure conditions. From the 29 seizure recordings, we found that the spectral energy in the low-frequency band changed the most at the electrical seizure onset, whereas Emidband and Ehighband changes developed slowly a few seconds later, followed by the Elowband changes. The spectral energy in the 25 to 100 Hz and 100 to 200 Hz bands showed large variations in the T3 and T4 electrode recordings. In all 29 seizure recordings, the energy level of the mid- and high-frequency bands was substantially lower than that of the low-frequency band. The spectral entropy in the 3 to 12 Hz band varied significantly over time and decreased at electrical onset in 26 recorded seizures. Among the 29 seizures, in 27, the electrical onset was correlated with a different set of time and frequency measures. The two seizures P2_s1 and P7_s3 showed distinctive changes in all measures only at the clinical onset of the seizure. The measures showing large changes from the background activity—signal energy, Elowband spectral energy, and spectral entropy—were selected as candidates for the automated detection system. The most prominent measures in the P1_s1 seizure recording are shown in Fig. 4. The spectral entropy varied most at electrical onset and contributed most to the detection of the electrical onset. The Elowband and signal energy measures variations remained the same until the electrical onset. The energy in high-frequency bands became large only after the clinical onset of the seizure. In TLE, spread of electrical activity from temporal lobe to neighboring areas results in loss of consciousness and tonic–clonic activity. The spectral entropy in 3 to 12 Hz was selected to capture the rhythmic spiking or oscillations of large synchronized neuronal populations at the electrical onset of a seizure. The spectral energy in the 1 to 25 Hz frequency band was selected to characterize the EEG dynamics at the initial stage of a seizure episode with loss of consciousness. The signal energy measure was selected to capture large energy changes at different stages of a seizure episode.
FIG. 4.
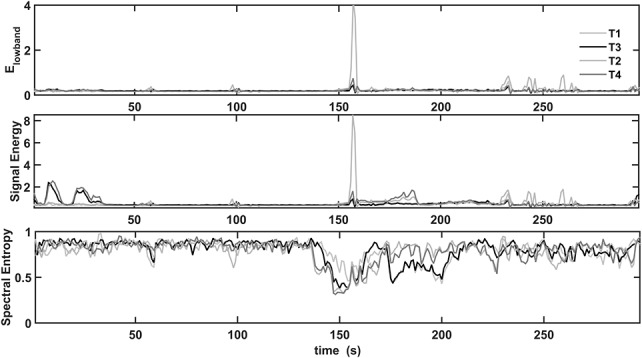
Prominent features extracted from the P1_s1 seizure recording. Elowband, signal energy, and spectral entropy changes appear at the electrical and clinical onset of seizure, 138 and 180 seconds, respectively. The profiles of Elowband and signal energy measures are alike until the electrical onset. Emidband and Ehighband contribute to the total energy only after the clinical onset of the seizure. The spectral entropy changed most at the electrical onset and contributed most to the detection of the electrical onset.
Automated Seizure Detection
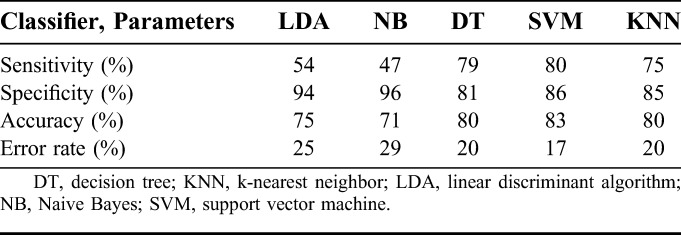
We designed the automated seizure detection system to test five supervised learning algorithms: LDA, NB, DT, SVM and KNN with k = 2. The classifiers are designed to solve the binary problem of distinguishing the normal and seizure classes. The classifiers distinguished the seizure and normal patterns using three features: Elowband, signal energy, and spectral entropy of the 4 channels T1, T2, T3, and T4. Each 5 minute recording was split into normal and seizure data with respect to the electrical onset of the seizure. For testing, the normal and seizure data for N − 1 patients' recordings were grouped, and the outliers beyond the ±3σ limit were removed to model the classifier. Each classifier was trained using these N − 1 patients' recordings, and the remaining one patient data sample, which was unknown to the classifier, was used to validate the performance of the classifier. Thus the classifier performance is validated using an unknown patient data, which ensures the patient-independent system approach.33,39 The entire 5 minute recording of each seizure was tested with the set of 5 classifiers. The performance of the classifiers was compared to test their suitability for real-time implementation. The performance was evaluated using the measures shown in the following equation:
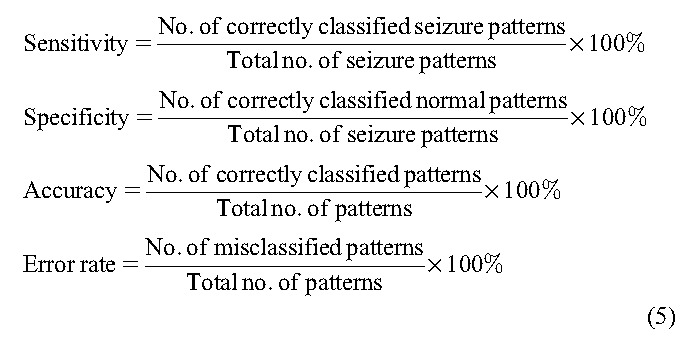 |
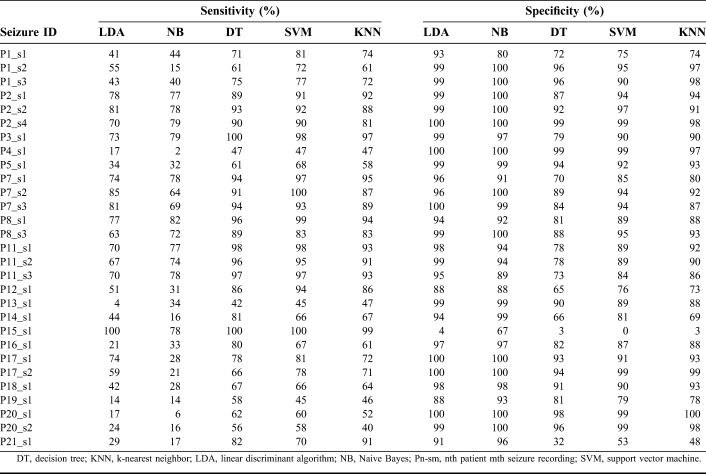
The sensitivity was defined as the ability of the classifier to correctly identify the seizure samples, whereas the specificity was the ability of the classifier to correctly identify the normal samples. The accuracy and error rate were the percentage of correctly classified and misclassified patterns, respectively. For each classifier, there was a trade-off between sensitivity and specificity. The performance of each classifier on patient-independent data set is shown in Table 2. The sensitivity and specificity of five classifiers in distinguishing the normal and seizure samples of each seizure recording are tabulated. The LDA and NB classifiers scored very low sensitivity and high specificity. The other three classifiers DT, SVM, and KNN showed good sensitivity and specificity values. Among the 29 seizures, four seizures (P4_s1, P13_s1, P19_s1, and P20_s2) yielded very low sensitivity in identifying the electrical onset of seizure. Apart from these four seizures, the normal samples of two seizures P15_s1 and P21_s1 were identified with low specificity. In particular, the spectral entropy pattern of the normal region of P15_s1 overlapped with the seizure region, all the normal patterns were classified as seizure patterns, and it was unable to determine the electrical onset.
TABLE 2.
Performance of Classifiers on Independent Seizure Recording
Good performance of an automated system is ensured by high sensitivity and specificity of the classifier. The average performance for each classifier design across all seizure recordings is given in Table 3. The LDA and NB classifiers performed with sensitivity (specificity) of 54% (94%) and 47% (96%), respectively. The performance of the other three (DT, SVM, and KNN) classifiers was very similar. The DT and KNN algorithms had a slightly lower accuracy of 80%, with sensitivity (specificity) of 79% (81%) and 75% (85%), respectively. Hence the SVM, with overall sensitivity of 80%, specificity of 86% and accuracy of 83%, seemed to be suitable for real-time implementation of a seizure detection system.
TABLE 3.
Average Performance of Classifiers on Independent Patient Data
The automated detection of electrical onset is compared with visual identification in Table 4. The latency is defined as the time difference between detection of the electrical onset by the manual and automated systems. The LDA classifier identified 16 seizures with an average latency of 6 seconds (median: 4 seconds; range: 1 to 29 seconds), and the electrical onset of seizure P8_s1 was identified 4 seconds before the manual detection. The NB classifier identified seizure (P8_s1) 4 seconds before visual detection and 11 seizures with an average latency of 11 seconds (median: 11 seconds; range: 2 to 29 seconds). The DT classifier identified 7 seizures before manual detection with an average time of 4 seconds, 14 seizures with an average latency of 9 seconds (median: 5 seconds; range: 1 to 32 seconds), and in four seizures, machine detection coincided with manual detection. The SVM classifier identified the three seizures P2_s2, P5_s1, and P8_s1 1 s, 1 and 4 seconds before the manual detection of electrical onset, 12 seizures with an average latency of 8 seconds (median: 4 seconds; range: 1 to 32 seconds), and in four seizures, machine detection coincided with manual detection. The KNN classifier identified the three seizures P2_s4, P7_s2, and P8_s1, 1, 1 and 5 seconds before manual detection, 17 seizures with an average latency of 8 seconds (median: 4 seconds; range: 1 to 32 seconds), and in four seizures, machine detection coincided with manual detection. The seizures P2_s1 and P7_s3 were identified only after clinical onset by all the classifiers, and seizure P15_s1 is not identified by any of the five classifiers. The seizure patterns of P13_s1 recording were identified as normal patterns by the LDA classifier. The LDA classifier was unable to identify P4_s1, P12_s1, P16_s1, P19_s1, P20_s1, and P21_s1 seizures with better accuracy. The seizure patterns of P4_s1 and P20_s1 were identified as normal patterns, and P12_s1, P14_s1, P15_s1, P19_s1, P20_20, and P21_s1 were not detected by the NB classifier. In seizure recording P15_s1, all the normal patterns were classified as seizure patterns by the LDA, DT, SVM, and KNN classifiers. The visual and SVM-based identification of the electrical onset of seizure P1_s1 is shown in Fig. 5. The identification of electrical onset of the seizure by the machine learning algorithm coincides with manual detection by the neurologists. Comparing the profile of prominent features of P1_s1 in Fig. 4 and the classifier output for seizure P1_s1 in Fig. 5, it seems that the spectral entropy measure had the greatest impact on the classification of unknown samples at the initial stage of a seizure.
TABLE 4.
Manual and Automatic Detection of Electrical Onset of Seizures
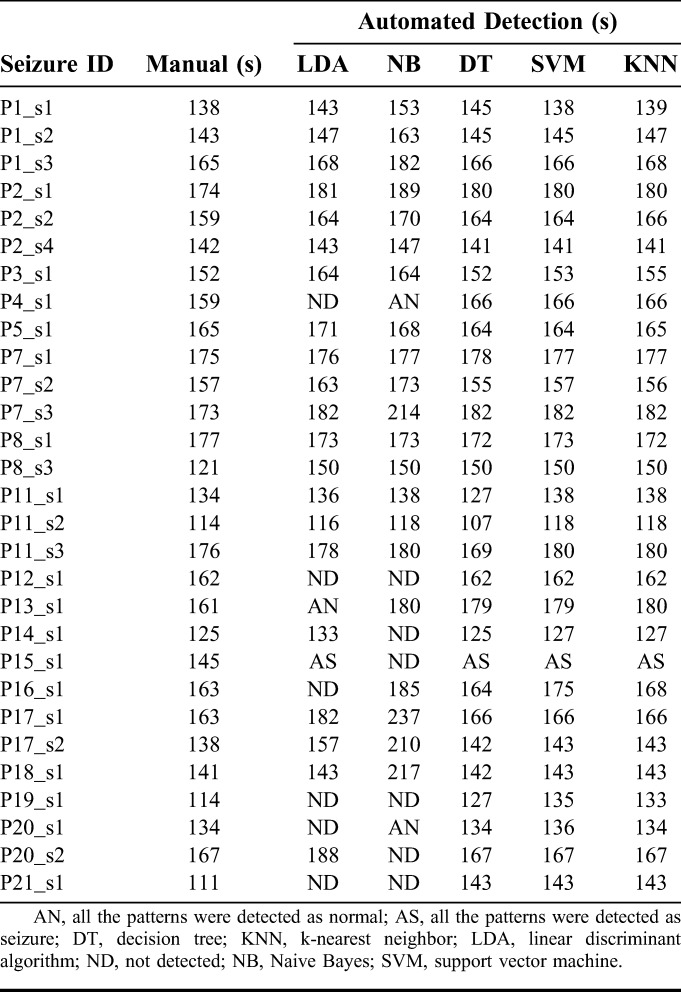
FIG. 5.
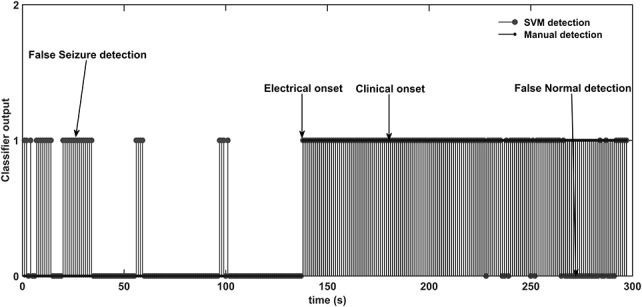
Electrical onset of seizure P1_s1 by manual and SVM identification. The normal pattern is represented as “0,” and the seizure pattern is represented as “1.” Misclassifications of the normal and seizure patterns are marked as “false seizure” and “false normal,” respectively.
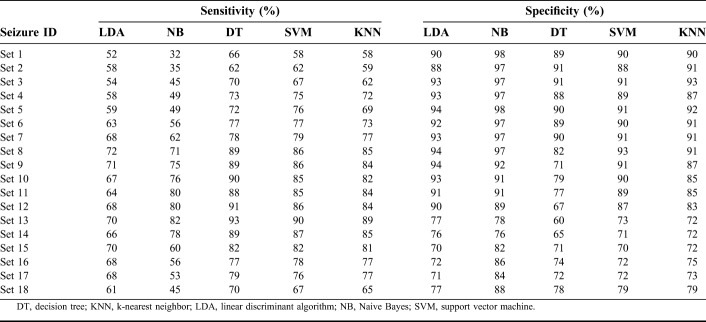
The performance of the classifiers was evaluated by another test that used 2/3 (12 patients) of the data for training, and the remaining data (6 patients) were dedicated for testing the classifiers. Thus, this method evaluated the performance of the classifiers on a cohort containing more than one individual patient. The performance of the classifiers on different set of patient cohorts is tabulated in Table 5. The average performance of the classifiers on the cohort data is tabulated in Table 6. The performance of the LDA and NB classifiers on the cohort data averaged 75% in accuracy. The accuracy of the DT classifier was reduced by 1% on cohort data from the value for the individual patient approach as given in Table 3. The KNN classifier scored the same 80% accuracy by adjusting the sensitivity by 1%. The sensitivity and specificity of the SVM classifier declined by 2% on the cohort data, with 81% accuracy.
TABLE 5.
Performance of Classifiers on Cohort Patient Recordings
TABLE 6.
Average Performance of Classifiers on Cohort Patients Data
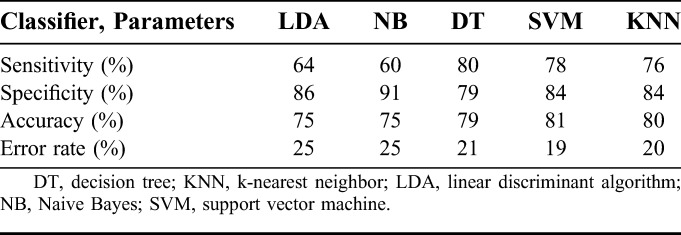
The SVM classifier trained using signal energy, spectral energy in the 1 to 25 Hz band, and spectral entropy in the 3 to 12 Hz band had sensitivity and specificity of 78% and 84%, respectively, on the cohort data. Further improving the performance of the SVM classifier, three LDA classifiers each using different set of features (Elowband × 4, signal energy × 4, and spectral entropy × 4) transformed the 4-dimensional feature space to a 1-dimensional space to provide good separability of the normal and seizure classes. With these LDA classifiers, each using a different set of features, the feature space was reduced from 12 to 3 features (1 × Elowband, 1 × signal energy, and 1 × spectral entropy). The transformed 3-dimensional feature set was used to train the SVM classifier on the cohort data. The LDA-SVM classifier accuracy increased by 1%, with a 2% rise in the sensitivity and unchanged specificity.
DISCUSSION
We designed this study to investigate the usability of time and frequency measures—signal energy, spectral energy, spectral entropy—and to compare the performances of five different classifiers with the goal of developing a patient-independent seizure detection system. To achieve this objective, we gathered relatively uniform scalp-recorded EEG data from patients with well-characterized TLE and applied time- and frequency-domain measures to detect the electrical onset of seizures. Although most studies have included temporal and extratemporal focal seizures to achieve generality, we restricted our investigation to temporal lobe seizures.7,17,43,45–47 Compared with scalp-recorded EEG, intracranial EEG recordings are largely free of artifacts. However, as intracranial EEG is invasive and expensive, it is undertaken on only in a minority of selected patients with antiepileptic drug-resistant epilepsy, in whom scalp-recorded EEG data have failed to provide localization of the seizure onset. Because of these reasons, studies that have used intracranial EEG are likely to give different results from ours.36,40,44,48
An SVM-based algorithm applied to pediatric patients with a variety of seizure types detected the seizures within 8 ± 3.2 seconds of electrical onset with 94% sensitivity and a false alarm rate of 0.25 hours.31 In another study, recurrent neural network–based system trained using spectral, wavelet, statistical, and complexity measures identified seizures with mean preonset and onset detection latency of −51 seconds (range: −1,140 to −61 seconds) and +4 second (−12 to +51 seconds), respectively.32 A clinical seizure onset detection and warning system with tunable threshold mechanism showed a sensitivity of 76% with median detection latency of 10 seconds.13 An SVM-based detection system using intracranial EEG identified the electrical onset of seizures with median/mean latency (5 seconds/6.9 seconds) and with 97% sensitivity.15 A patient-specific seizure detection algorithm using Combined Seizure Index of wavelet coefficients extracted from multichannel scalp EEG identified 90.5% of the 63 seizures with median detection latency of 7 seconds.46 However, most of the systems proposed in previous studies were patient-dependent and required expert input for channel selection and training data to reconfigure the system for another patient. A generic SVM system using 6 ictal morphologies identified 91 seizures of 57 patients with a median delay of +1.6 seconds (range: −4 to +10 seconds) detection latency and >96% sensitivity. In the system proposed by Meyer et al.,43 each sample of the feature vector was mapped to a probability by comparing the 5 second history with a 25 second baseline history to obtain generalizability across patients.
We aimed to develop a self-sustaining system and therefore normalized each segment using the maximum and minimum values computed from all 29 seizure recordings. The proposed algorithm makes the EEG comparable across patients and does not need any change to use the system for another patient. The features computed for each windowed signal on N − 1 patient recordings were used to train the classifier, and the remaining recording was used to validate the classifier. Each classifier identified the electrical onset of seizure at a different latency compared with manual detection. Comparing the detection latency and performance of the classifiers, the SVM algorithm performed better by detecting the electrical onset well before the clinical onset, with sensitivity and specificity of 80% and 86%, respectively. In 25/29 seizures, the electrical onset was detected by the SVM classifier with median/mean latency of 2 seconds/5.8 seconds (range: −4 to +32 seconds), whereas two seizures are identified at the clinical onset, and one seizure was identified 2 seconds after the clinical onset. The LDA and NB classifiers performed with very low false-positive rates but a high missed seizure rate. The DT and KNN algorithms had good sensitivity but a comparatively low specificity.
Although comparing our results with previous studies, we found that the signal energy increased a short time before the clinical onset of seizure, which is in agreement with a study of the cumulative energy profile of multiday intracranial EEG.49 By contrast, another study in which the energy of the signal decreased 30 minutes before the seizure onset.40 Most of the previous studies using frequency measures used standard spectral bands (0.5–4, 4–8, 8–13, 13–30, and 30–48 Hz) to compute the spectral and wavelet energy measures to capture the brain dynamics.32,37,47,50 Sitt et al.27 attempted to correlate the state of consciousness with spectral measures of ongoing EEG activity. They found that the spectral power in low frequencies (delta, theta, and alpha bands) constituted the most reliable signature of the state of consciousness, distinguishing between vegetative state (VS), minimally conscious state, and conscious state (CS). The spectral entropy in the 1 to 45 Hz frequency band showed higher values in minimally conscious and CS than in VS. Logesparan et al.18 analyzed the performance of 65 measures including 17 time domain, 12 Fourier transform, 4 continuous wavelet transform, and 32 discrete wavelet transform based measures, for online data selection and seizure occurrence detection. They concluded that discrete wavelet transform–based power in the 0 to 3.125, 3.125 to 6.25, 6.25 to 12.5, and 12.5 to 25 Hz frequency bands yielded a 0.97 value of the area under the curve in a receiver–operating characteristic analysis and were selected as the best discriminating features for seizure occurrence detection. In another study, a non–patient-specific system for pediatric patients was designed using stationary wavelet transform with 1.91 to 4.16, 3.84 to 8.28, 7.69 to 16.56, and 15.41 to 33.09 Hz frequency bands.39
We found that for all the 29 seizure recordings, the profile of wavelet energy correlated with spectral energy in 1 to 3, 3 to 6, 6 to 12, 12 to 25, 25 to 50, 50 to 100, and 100 to 200 Hz bands. In a previous study, we observed that the spectral energy in 1 to 3, 3 to 6, 6 to 12, and 12 to 25 Hz increased at the electrical onset of seizure.51 Hence, we combined the lower frequency bands, and the entire signal was divided into 1 to 25, 25 to 100, and 100 to 200 Hz bands for the measurement of spectral energy. The selection of these frequency bands made the analysis and comparisons simple and efficient due to the resulting reduced feature set, yielding better distinguishability of normal and seizure patterns. The spectral entropy in the 3 to 12 Hz band used for seizure electrical onset detection was not analyzed in previous studies with scalp EEG recordings. The spectral entropy in the 1 to 200 Hz frequency band has not shown large changes at the electrical onset of seizures. The largest decrease in entropy was obtained in the 3 to 12 Hz frequency band, and therefore, this was chosen to measure the spectral entropy.
We acknowledge the following limitations of our study. Among our 29 seizure recordings, we could identify the electrical onset in 26 seizures by the classifiers. Among the rest, for two seizures, the clinical onset was detected by all the five classifiers and one seizure was identified by none of the classifiers. Because the algorithm was trained with 29 EEG samples recorded in a routine clinical environment with the presence of movement and myogenic artifacts, the classifiers produced relatively low specificity. Among the 29 seizures, 4 seizures (P4_s1, P13_s1, P19_s1, and P20_s2) were identified with low sensitivity. In all the four seizures, the spectral entropy showed significant variations at the electrical onset of seizure. The significant changes in the profile of signal energy were observed at the clinical onset of P13_s1 and P20_s2 seizures. The seizures P4_s1, P13_s1, and P19_s1 showed no significant variations in the spectral energy in 1 to 25 Hz bands. Because of the lack of significant variations in Elowband and signal energy measures during the seizure activity, the detection of these four seizures resulted in more false normal. Two seizures P15_s1 and P21_s1 were identified with low specificity. Having a good profile of Elowband and signal energy measures, the decrease in the spectral entropy values of normal EEG leads to the misclassification of normal as seizure condition. In particular, the spectral entropy pattern of the normal EEG of P15_s1 overlapped with the seizure region, the seizure detection was resulted in false alarm. However, we admit that the performance of classification was poor in the above-stated scenarios, which emphasizes the need for further research focused to address these issues.
Among the five classifiers, the SVM was found most suitable for the design of an automated system for clinical study. Also, we observed that the performance of the system mainly depended on three factors: (1) normalization scheme, (2) feature extraction, and (3) machine learning algorithm. If the above three parameters are properly selected, the design of a patient-independent system is feasible, and it can be used in a clinical environment. An automated seizure detection system would be helpful for timing ictal SPECT studies as well as for warning patients about upcoming clinical seizures. Such an automated seizure detection system would assist neurologists in visual analysis of long-term EEG recordings and considerably reduce the time spend for reviewing the data.
CONCLUSIONS
We investigated the usability of time and frequency measures to improve the performance of a patient-independent system for detection of the electrical onset of seizures in patients with TLE. We selected signal energy, spectral energy in the 1 to 25 Hz band, and spectral entropy in the 3 to 12 Hz band as useful features and trained five classifiers using them. An SVM-based system distinguished normal and seizure patterns with sensitivity and specificity of 80% and 86%, respectively. If the system is trained with data from a larger number of patients, the resulting patient-independent system might be of value in the presurgical evaluation of patients with drug-resistant TLE.
Footnotes
The authors have no funding or conflicts of interest to disclose.
REFERENCES
- 1.Blair RDG. Temporal lobe epilepsy semiology. Epilepsy Res Treat 2012;2012:1–10. [DOI] [PMC free article] [PubMed] [Google Scholar]
- 2.Radhakrishnan K. Challenges in the management of epilepsy in resource-poor countries. Nat Rev Neurol 2009;5:323–330. [DOI] [PubMed] [Google Scholar]
- 3.Engel J., Jr Mesial temporal lobe epilepsy: what have we learned? Neuroscientist 2001;7:340–352. [DOI] [PubMed] [Google Scholar]
- 4.Carney PR, Myers S, Geyer JD. Seizure prediction: methods. Epilepsy Behav 2011;22:S94–S101. [DOI] [PMC free article] [PubMed] [Google Scholar]
- 5.Winterhalder M, Maiwald T, Voss HU, Aschenbrenner-Scheibe R, Timmer J, Schulze-Bonhage A. The seizure prediction characteristic: a general framework to assess and compare seizure prediction methods. Epilepsy Behav 2003;4:318–325. [DOI] [PubMed] [Google Scholar]
- 6.Maiwald T, Winterhalder M, Aschenbrenner-Scheibe R, Voss HU, Schulze-Bonhage A, Timmer J. Comparison of three nonlinear seizure prediction methods by means of the seizure prediction characteristic. Physica D 2004;194:357–368. [Google Scholar]
- 7.Bandarabadi M, Teixeira CA, Rasekhi J, Dourado A. Epileptic seizure prediction using relative spectral power features. Clin Neurophysiol 2015;126:237–248. [DOI] [PubMed] [Google Scholar]
- 8.Liu HS, Zhang T, Yang FS. A multistage, multimethod approach for automatic detection and classification of epileptiform EEG. IEEE Trans Biomed Eng 2002;49:1557–1566. [DOI] [PubMed] [Google Scholar]
- 9.Putten MJ, Kind T, Visser F, Lagerburg V. Detecting temporal lobe seizures from scalp EEG recordings: a comparison of various features. Clin Neurophysiol 2005;116:2480–2489. [DOI] [PubMed] [Google Scholar]
- 10.Shiau D-S, Halford JJ, Kelly KM. Singularity-based automated seizure detection system for scalp EEG monitoring. Cybern Syst Anal 2010;46:922–935. [DOI] [PMC free article] [PubMed] [Google Scholar]
- 11.Gotman J. Automatic detection of seizures and spikes. J Clin Neurophysiol 1999;16:130–140. [DOI] [PubMed] [Google Scholar]
- 12.Indiradevi KP, Elias E, Sathidevi PS, Dinesh Nayak S, Radhakrishnan K. A multilevel wavelet approach for automatic detection of epileptic spikes in the electroencephalogram. Comput Biol Med 2008;38:805–816. [DOI] [PubMed] [Google Scholar]
- 13.Saab ME, Gotman J. A system to detect the onset of epileptic seizures in scalp EEG. Clin Neurophysiol 2005;116:427–442. [DOI] [PubMed] [Google Scholar]
- 14.Quintero-Rinc Pereyra M, D'Giano C, Batatia H, Risk M. A new algorithm for epilepsy seizure onset detection and spread estimation from EEG signals. J Phys Conf Ser 2016;705:012032. [Google Scholar]
- 15.Kharbouch A, Shoeb A, Guttag J, Cash SS. An algorithm for seizure onset detection using intracranial EEG. Epilepsy Behav 2011;22:S29–S35. [DOI] [PMC free article] [PubMed] [Google Scholar]
- 16.Putten MJ. The revised brain symmetry index. Clin Neurophysiol 2007;118:2362–2367. [DOI] [PubMed] [Google Scholar]
- 17.Temko A, Thomas E, Marnane W, Lightbody G, Boylan G. EEG-based neonatal seizure detection with support vector machines. Clin Neurophysiol 2011;122:464–473. [DOI] [PMC free article] [PubMed] [Google Scholar]
- 18.Logesparan L, Casson AJ, Imtiaz SA, Rodriguez-Villegas E. Discriminating between best performing features for seizure detection and data selection. The 35th IEEE Annual International Conference on Engineering in Medicine and Biology Society. Osaka, Japan, July 2013;1692–1695. [DOI] [PubMed]
- 19.Logesparan L, Casson AJ, Rodriguez-Villegas E. Optimal features for online seizure detection. Med Biol Eng Comput 2012;50:659–669. [DOI] [PubMed] [Google Scholar]
- 20.Kannathal N, Choo ML, Acharya UR, Sadasivan PK. Entropies for detection of epilepsy in EEG. Comput Methods Prog Biomed 2005;80:187–194. [DOI] [PubMed] [Google Scholar]
- 21.Song Y, Crowcroft J, Zhang J. Automatic epileptic seizure detection in EEGs based on optimized sample entropy and extreme learning machine. J Neurosci Methods 2012;210:132–146. [DOI] [PubMed] [Google Scholar]
- 22.Wang L, Xue W, Li Y, et al. Automatic epileptic seizure detection in EEG signals using multi-domain feature extraction and nonlinear analysis. Entropy 2017;19:1–17. [Google Scholar]
- 23.Acharya UR, Molinari F, Vinitha SS, Chattopadhyay S, Kwan-Hoong N, Suri JS. Automated diagnosis of epileptic EEG using entropies. Biomed Signal Process Control 2012;7:401–408. [Google Scholar]
- 24.Khamis H, Mohamed A, Simpson S. Seizure state detection of temporal lobe seizures by autoregressive spectral analysis of scalp EEG. Clin Neurophysiol 2009;120:1479–1488. [DOI] [PubMed] [Google Scholar]
- 25.Iscan Z, Zmray D, Tamer D. Classification of electroencephalogram signals with combined time and frequency features. Expert Syst Appl 2011;38:10499–10505. [Google Scholar]
- 26.Kumar SP, Sriram N, Benakop PG, Jinaga BC. Entropies based detection of epileptic seizures with artificial neural network classifiers. Expert Syst Appl 2010;37:3284–3291. [Google Scholar]
- 27.Sitt JD, King JR, El Karoui I, et al. Large scale screening of neural signatures of consciousness in patients in a vegetative or minimally conscious state. Brain 2014;137:2258–2270. [DOI] [PMC free article] [PubMed] [Google Scholar]
- 28.Shoeb A, Guttag J. Application of machine learning to epileptic seizure detection. Proceedings of the 27th International Conference on Machine Learning. Haifa, Israel, June 2010;975–982.
- 29.Kafashan M, Ryu S, Hargis MJ, et al. EEG dynamical correlates of focal and diffuse causes of coma. BMC Neurol 2017;17:197. [DOI] [PMC free article] [PubMed] [Google Scholar]
- 30.Ramgopal S, Thome-Souza S, Jackson M, et al. Seizure detection, seizure prediction, and closed-loop warning systems in epilepsy. Epilepsy Behav 2014;37:291–307. [DOI] [PubMed] [Google Scholar]
- 31.Shoeb A, Edwards H, Connolly J, Bourgeois B, Treves ST, Guttag J. Patient-specific seizure onset detection. Epilepsy Behav 2004;5:483–498. [DOI] [PubMed] [Google Scholar]
- 32.Minasyan GR, Chatten JB, Chatten MJ, Harner RN. Patient-specific early seizure detection from scalp EEG. J Clin Neurophysiol 2010;27:163–178. [DOI] [PMC free article] [PubMed] [Google Scholar]
- 33.Chua EC, Patel K, Fitzsimons M, Bleakley CJ. Improved patient specific seizure detection during the pre- surgical evaluation. Clin Neurophysiol 2011;122:672–679. [DOI] [PubMed] [Google Scholar]
- 34.McSharry PE, Smith LA, Tarassenko L. Comparison of predictability of epileptic seizures by a linear and a nonlinear method. IEEE Trans Biomed Eng 2003;50:628–633. [DOI] [PubMed] [Google Scholar]
- 35.Mormann F, Andrzejak RG, Elger CE, Lehnertz K. Seizure prediction: the long and winding road. Brain 2007;130:314–333. [DOI] [PubMed] [Google Scholar]
- 36.Aarabi A, Fazel-Rezai R, Aghakhani Y. A fuzzy rule-based system for epileptic seizure detection in intracranial EEG. Clin Neurophysiol 2009;120:1648–1657. [DOI] [PubMed] [Google Scholar]
- 37.Geng D, Zhou W, Zhang Y, Geng S. Epileptic seizure detection based on improved wavelet neural networks in long-term intracranial EEG. Biocyber Biomed Eng 2016;36:375–384. [Google Scholar]
- 38.Le Van Quyen M, Martinerie J, Navarro V, et al. Anticipation of epileptic seizures from standard EEG record-ings. Lancet 2001;357:183–188. [DOI] [PubMed] [Google Scholar]
- 39.Orosco L, Correa AG, Diez P, Laciar E. Patient non-specific algorithm for seizures detection in scalp EEG. Comput Biol Med 2016;71:128–134. [DOI] [PubMed] [Google Scholar]
- 40.Mormann F, Kreuz T, Rieke C, et al. On the predictability of epileptic seizures. Clin Neurophysiol 2005;116:569–587. [DOI] [PubMed] [Google Scholar]
- 41.Rasekhi J, Mollaei MR, Bandarabadi M, Teixeira CA, Dourado A. Epileptic seizure prediction based on ratio and differential linear univariate features. J Med Signals Sens 2015;5:1–11. [PMC free article] [PubMed] [Google Scholar]
- 42.Moghim N, Corne DW. Predicting epileptic seizures in advance. PLoS One 2014;9:e99334. [DOI] [PMC free article] [PubMed] [Google Scholar]
- 43.Meier R, Dittrich H, Schulze-Bonhage A, Aertsen A. Detecting epileptic seizures in long-term human EEG : a new approach to automatic online and real-time detection and classification of polymorphic seizure patterns. Clin Neurophysiol 2008;25:119–131. [DOI] [PubMed] [Google Scholar]
- 44.Blanco S, Garay A, Coulombie D. Comparison of frequency bands using spectral entropy for epileptic seizure prediction. ISRN Neurol 2013;2013:1–5. [DOI] [PMC free article] [PubMed] [Google Scholar]
- 45.Aschenbrenner-Scheibe R, Maiwald T, Winterhalder M, Voss HU, Timmer J, Schulze-Bonhage A. How well can epileptic seizures be predicted? An evaluation of nonlinear method. Brain 2003;126:2616–2626. [DOI] [PubMed] [Google Scholar]
- 46.Zandi AS, Javidan M, Dumont GA, Tafreshi R. Automated real-time epileptic seizure detection in scalp EEG recordings using an algorithm based on wavelet packet transform. IEEE Trans Biomed Eng 2010;57:1639–1651. [DOI] [PubMed] [Google Scholar]
- 47.Rasekhi J, Mollaei MR, Bandarabadi M, Teixeira CA, Dourado A. Preprocessing effects of 22 linear univariate features on the performance of seizure prediction methods. J Neurosci Methods 2013;217:9–16. [DOI] [PubMed] [Google Scholar]
- 48.Esteller R, Echauz J, D'Alessandro M, Worrell G. Continuous energy variation during the seizure cycle: towards an on-line accumulated energy. Clin Neurophysiol 2005;3:517–526. [DOI] [PMC free article] [PubMed] [Google Scholar]
- 49.Litt B, Esteller R, Echauz J, et al. Epileptic seizures may begin hours in advance of clinical onset: a report of five patients. Neuron 2001;30:51–64. [DOI] [PubMed] [Google Scholar]
- 50.Park Y, Luo L, Parhi KK, Netoff T. Seizure prediction with spectral power of EEG using cost-sensitive support vector machines. Epilepsia 2011;52:1761–1770. [DOI] [PubMed] [Google Scholar]
- 51.Sridevi V, RamasubbaReddy M, Srinivasan K, Radhakrishnan K, Rathore C, Dinesh Nayak S. Study of significance of spectral and wavelet energy measures to detect the electrical onset of seizures. Proceedings of the IEEE International Conference on Inventive Computing and Informatics, India, November 2017;660–663.
- 52.Malmivuo J, Plonsey R. Bioelectromagnetism. New York: Oxford University Press, 1995. [Google Scholar]


