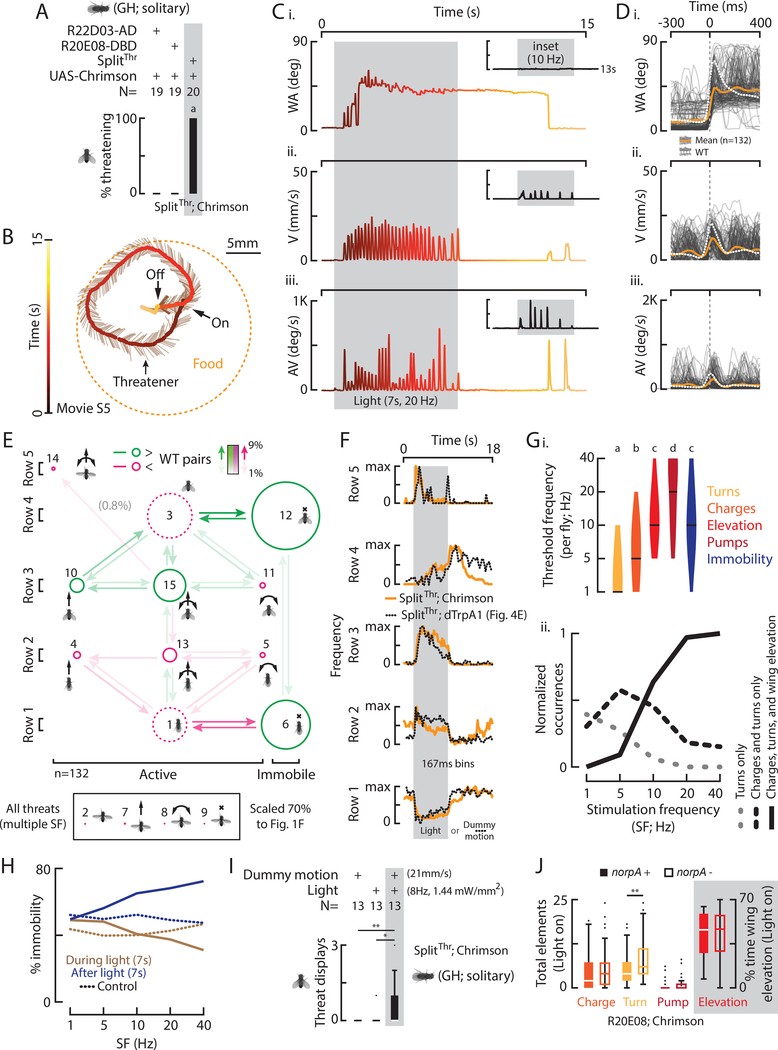
Figure 5: Optogenetic activation of SplitThr neurons substitutes for sensory cues and induces different threat motor elements in a threshold-dependent manner.
A) Percent of flies with indicated genotypes that expressed at least one light induced threat. B) A trajectory shows an induced threatener in relation to food and time. C) WA (i), V (ii), and AV (iii) for B, color coded to time with other data inset (Fig. S6B). D) WA (i), V (ii), and AV (iii) for 132 threats (light gray) and the mean of induced (orange) and WT threats (dashed white). E) A transition diagram for induced threats. F) The frequency of row specific elements in time with data from Fig. 4E overlaid (dashed line, different time scale). G) Violin plots (with median) of the per fly threshold stimulation frequency (I, SF) required to elicit the indicated motor elements and (ii) the normalized occurrences of trials with the most prevalent elements and combinations (Fig. S6Iii) according to SF. H) Percent immobility during or after light vs. SF. I) Total threats induced by dummy motion, low frequency light, and both in combination with stimulus intensities indicated. J) Total elements expressed by R20E08 activated flies with norpA+ (solid bars) or norpA- (open bars).

