Abstract
Carbon dioxide is produced by many organic processes, and is a convenient volatile cue for insects1 searching for blood hosts2, flowers3, communal nests4, fruit5, and wildfires6. Curiously, although Drosophila melanogaster feed on yeast that produce CO2 and ethanol during fermentation, laboratory experiments suggest that walking flies avoid CO27–12. Here, we resolve this paradox by showing that both flying and walking Drosophila find CO2 attractive, but only when in an active state associated with foraging. Aversion at low activity levels may be an adaptation to avoid CO2-seeking-parasites, or succumbing to respiratory acidosis in the presence of high concentrations of CO2 that exist in nature13,14. In contrast to CO2, flies are attracted to ethanol in all behavioral states, and invest twice the time searching near ethanol compared to CO2. These behavioral differences reflect the fact that whereas CO2 is generated by many natural processes, ethanol is a unique signature of yeast fermentation. Using genetic tools, we determined that the evolutionarily ancient ionotropic co-receptor IR25a is required for CO2 attraction, and that the receptors necessary for CO2 avoidance are not involved. Our study lays the foundation for future research to determine the neural circuits underlying both state- and odorant- dependent decision making in Drosophila.
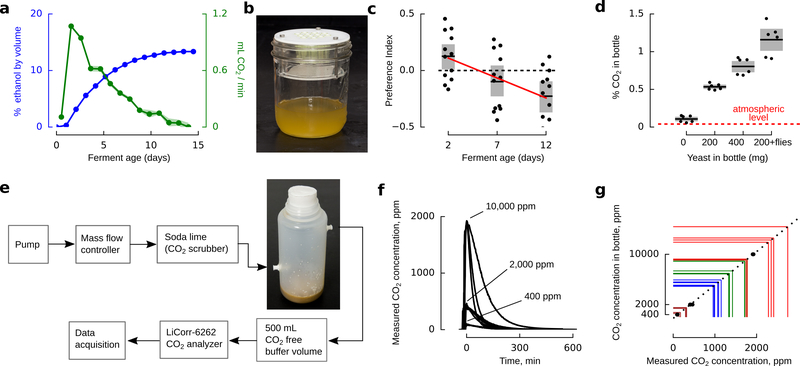
Drosophila melanogaster feed, mate, and deposit eggs on rotting fruit. 10–14 days later, the next generation of flies must locate a fresh ferment. Because of its high volatility, CO2 emission is greatest near the start of fermentation8, whereas ethanol emission increases more slowly (Extended Data Fig. 1a). Other odors associated with fermentation (e.g. acetic acid and ethyl acetate), form later when bacteria break down ethanol. In trap assays, Drosophila show a preference for 2-day-old apple juice ferments compared to older solutions (Extended Data Fig. 1b-c), suggesting that they might be attracted to CO2. Although it is difficult to estimate concentrations of CO2 in wild ferments, we measured the CO2 concentration in bottles commonly used to rear flies to be 0.5–1% (Extended Data Fig. 1d-g).
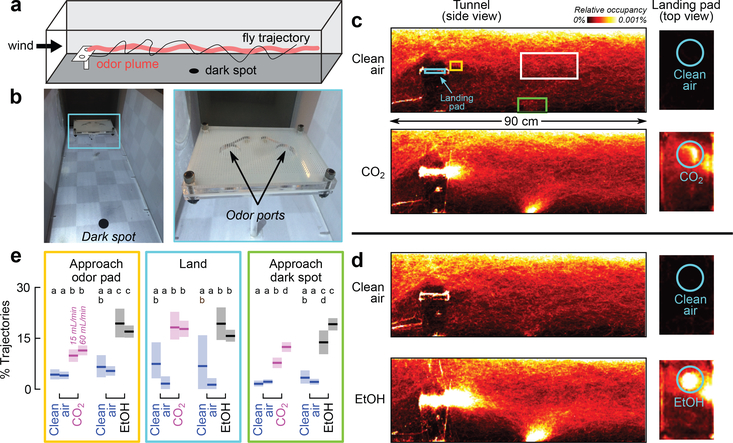
This evidence that CO2 might attract Drosophila contradicts prior studies conducted using small chambers7–12. To study how flies respond to odors under more ethological conditions, we recorded flight trajectories of flies in a wind tunnel containing a landing platform, programmed to periodically release plumes of CO2 or ethanol (Fig. 1a-b). Both odors elicited approaches, landings, and explorations of a conspicuous visual feature (Fig. 1c-d), consistent with prior experiments with flies and mosquitoes15,16. Flies were more likely to approach the platform or dark spot in the presence of ethanol compared to CO2, but were equally likely to land in response to either odor (Fig. 1e).
Figure 1 |. Drosophila are attracted to ethanol and CO2 in flight.
a, Diagram of wind tunnel. b, Photograph of the wind tunnel and odor-emitting landing platform. c, d Heat-maps indicating relative occupancy of flies in the presence of either CO2 or ethanol. Cohorts of 12 flies were introduced into the wind tunnel and their behavior recorded over 16 hrs. Throughout the experiment, 100 mL min−1 of clean air emerged from both odor ports. For 30 min every hour, 60 mL min−1 of either CO2 or clean air bubbled through 100% ethanol, was added to one odor port. Control data come from segments with clean air. Number of cohorts: 9 (CO2), 6 (ethanol). Number of trajectories: 59,970 – 101,539 per panel. e, Percent of trajectories that passed through one of the colored volumes shown in c (gold, cyan, green) after also passing through a control volume (white or gold). Approaches to landing pad: gold-from-white; landings: cyan-from-gold; approaches to dark spot: green-from-white. Number of trajectories per condition: 44–1288 (control), 228–1815 (odor). Experiments were performed at two concentrations: 15 mL min−1 (left data) and 60 mL min−1 (right data). Letters above data indicate statistically significant groups (2-tailed Mann-Whitney U test at p<0.05 with 8-way Bonferoni corrections). In all panels, shading indicates bootstrapped 95% CI around the mean.
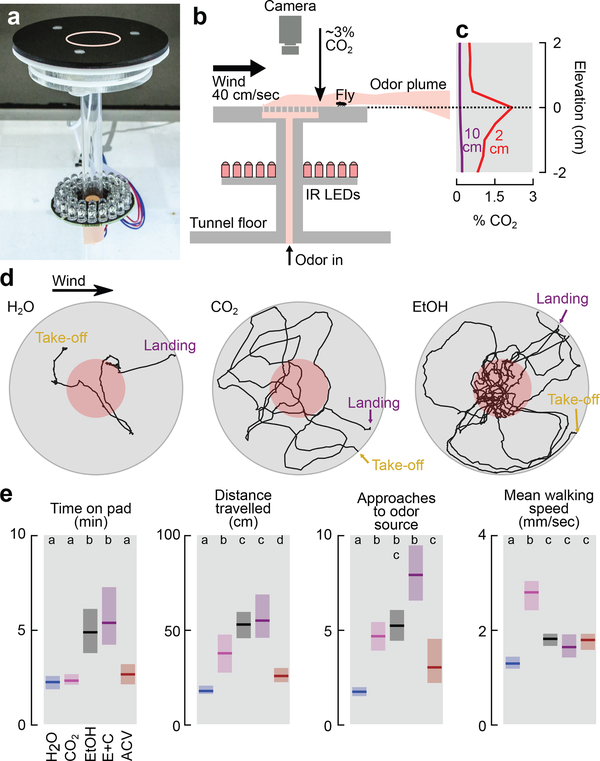
To quantify the behavior of flies after they land, we designed a platform suitable for automated tracking (Fig. 2a-b). For a flow rate of 60 mL min−1 CO2, the CO2 concentration near the surface of the platform was approximately 3% (Fig. 2b-c). After landing near a source of CO2, ethanol, or apple cider vinegar, flies exhibited local search behavior similar to so-called dances17 (Fig. 2d-e, Extended Data Fig. 2a-c). Flies spent twice the time exploring platforms emitting ethanol compared to CO2 or vinegar. Flies approached a source emitting both ethanol and CO2 more frequently than either odor alone or vinegar. Vinegar elicited smaller local searches and slightly fewer approaches compared to CO2, consistent with the hypothesis that it might indicate a less favorable, late-stage ferment. Flies spent significantly less time standing still on the platform in the presence of CO2 compared to any other odor, with a mean walking speed >2mm s−1.
Figure 2 |. Walking Drosophila are attracted to CO2.
a, Photograph of landing platform. b, Cross-sectional diagram of the landing platform. c, CO2 concentration for two altitude transects 2 cm and 10 cm downwind from the platform at a 60 mL min−1 flow rate added to 100 mL min−1 of clean air (Extended Data Fig. 2a-b). d, Stereotypical trajectories. e, Four descriptive statistics summarizing flies’ behavior in response to different odors. Flow rate was 60 mL min−1 for each odor added to 100 mL min−1 of clean air. ACV = Apple Cider Vinegar. E+C = 60 mL min−1 clean air bubbled through ethanol with 15 mL min−1 of CO2 added. See Extended Data Fig. 2c for additional flow rates. Shading indicates bootstrapped 95% CI around the median. N trajectories = 125–193 per odor. Approaches to odor = number of times trajectories entered the red region in d. Letters above data indicate statistically significant groups (2-tailed Mann-Whitney U test at p<0.05 with 5-way Bonferoni corrections).
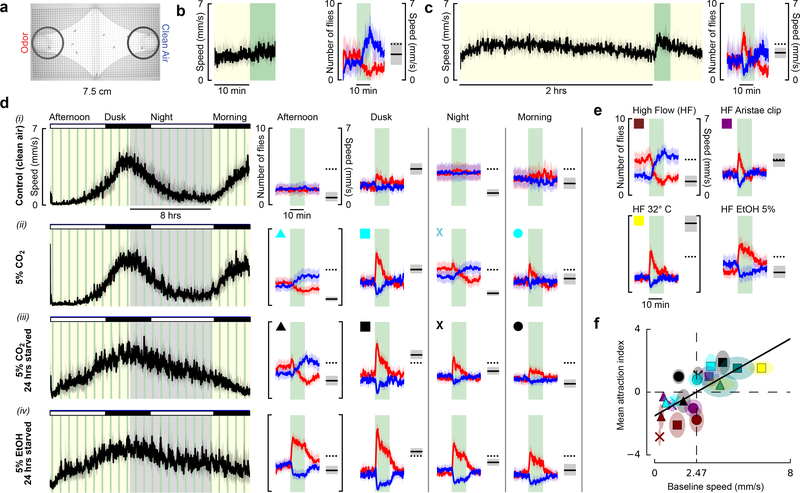
One prior study showed that Drosophila are attracted to CO2 while flying on a tether18. Our results confirm this observation in freely-flying flies; however, we also found that flies remain attracted to CO2 after they land, contradicting prior studies7–10,12. One potential explanation is that animals in constrained walking chambers might behave differently from those that arrived on our open wind tunnel platform after tracking the odor plume and landing. To test this hypothesis, we built an enclosed arena in which flies were unable to fly (Fig. 3a, Extended Data Fig. 3), and presented them with pulses of 5% CO2. Groups of 10 starved flies presented with CO2 after acclimating to the arena for 10 min exhibited aversion (Fig. 3b), as previously reported. However, if allowed to acclimate in the chamber for two hours, the animals exhibited attraction to CO2 (Fig. 3c).
Figure 3 |. Attraction to CO2, but not ethanol, depends on activity.
a, Image of walking arena, with regions of interest (ROI) near clean air (blue) and odor (red). b, (left) Mean speed of 10 starved flies. Green: time when 1 mL min−1 of odor was added to 20 mL min−1 bulk flow (alternating sides). (right) Number of flies in ROI near the CO2 (red) and clean air (blue). Black bar and shading shows the flies’ mean speeds 5 min prior to odor presentation, a proxy for activity level. N=8 cohorts. c, Same as b, with 2-hour acclimatization period. N=10 cohorts. d, (left) Flies’ mean speed for a 20 hr experiment. Yellow/gray indicate entrained day/night cycle. (right) Data plotted as in b, for four time frames. For the control, we added clean air to the flow. Flies’ are significantly less attracted to this mechanical stimulus than the olfactory ones. Dashed line: speed at dusk during clean air control (row i) e, Manipulating flies’ activity changes their attraction to CO2. Data are shown for experiments similar to those in d (dusk) but under 100 mL min−1 bulk flow conditions. In these experiments, 5 mL min−1 odor was added (same concentration as in d). Experiments were performed with intact flies (maroon), flies with aristae surgically removed (purple), and intact flies at 32° under a heat lamp (yellow). We also tested intact flies using an ethanol stimulus. f, Summary of CO2 responses presented in d and e, showing relationship between activity and CO2 attraction. Color and shape encodes experiment and time of day. Green data are from experiments at 20 mL min−1 bulk flow and 32° C. Mean attraction index = mean number of flies in ROI near CO2 during stimulus, minus number of flies in ROI 5 min prior to stimulus. Baseline speed = mean speed of all flies 5 min prior to CO2 stimulus. Throughout the figure, shading indicates 95% CI around the mean. All experimental combinations were performed with N = 6 cohorts of 10 flies each, and 24–48 trials per condition. Additional statistical analyses are provided in the Supplemental Materials.
To study their response in more detail, we recorded the behavior of flies for 20 hours, while providing 10 min presentations of CO2 from alternating sides of the arena every 40 minutes (Fig. 3d, Supplementary Videos V1, V2). To control for humidity, we continuously pumped 20 mL min−1 of H2O-saturated air through the odor ports on both sides of the chamber. The flies exhibited a clear circadian rhythm within the chamber, as indicated by their mean walking speed. At times of peak activity — near dusk and dawn — flies showed a strong initial attraction to CO2, which decayed stereotypically during the 10 min presentation. At times of low activity — at mid-day and during the night — flies exhibited a mild aversion to CO2. Starving flies for 24 hours prior to the experiment changed their activity profile, resulting in a slightly elevated attraction during the night. Ethanol, in contrast, elicited sustained attraction regardless of baseline activity (Fig. 3d, Supplementary Video, V3).
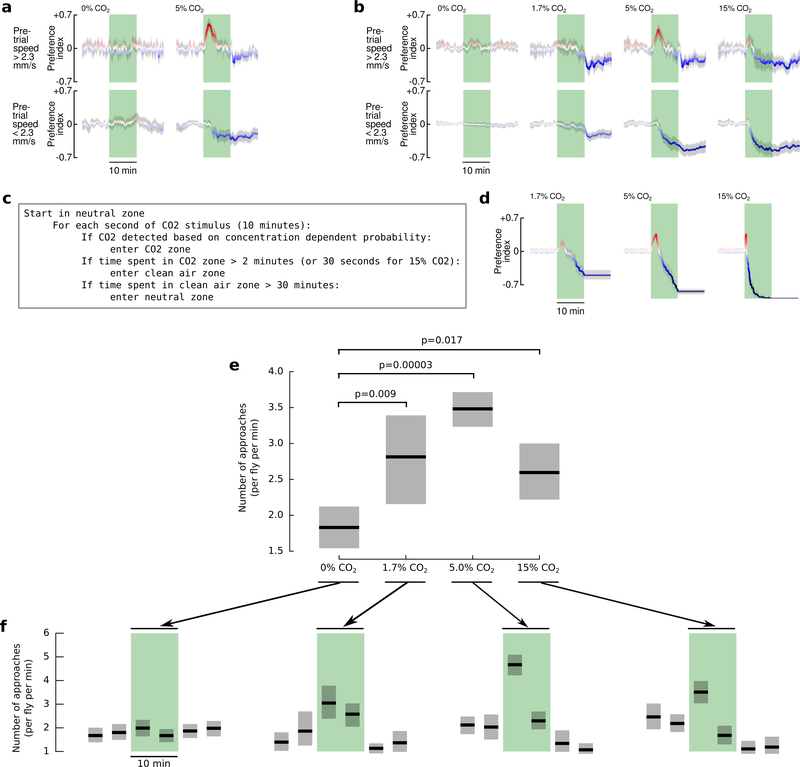
To probe this relationship between activity and CO2 attraction further, we increased temperature and elevated wind speed — two manipulations known to elevate and depress19 activity, respectively (Fig. 3e). When we increased the bulk flow rate to 100 mL min−1, flies exhibited a peak walking speed of ~1.5 mm s−1 at dusk, nearly half the speed we measured at a flow rate of 20 mL min−1. Instead of showing attraction, these flies exhibited aversion to 5% CO2; although they were still attracted to ethanol (Fig. 3e). This result helps to explain why previous studies using higher flows of 100–1000 mL min−1 to present CO2 observed aversion8. To further explore the effect of wind, we clipped the flies’ aristae, which destroys their primary means of detecting airflow but does not interfere with the detection of odors20. The aristae-less flies exhibited the same walking speed and attraction to CO2 at the high flow rate as exhibited by normal flies at the low flow rate. Warming flies with intact aristae to 32° C also increased their baseline activity and recovered their attraction to CO2 at the higher flow rate. Pooling data across all our experimental conditions, we found that flies were attracted to CO2 when they had a baseline walking speed above ~2.4 mm s−1 (Fig. 3f). This value is similar to the walking speed we observed in our wind tunnel assay, which was higher for CO2 than the other odors. To confirm that activity-dependent attraction to CO2 is not a function of social interactions, we tested 29 single flies, which behaved like the cohorts of 10 (Extended Data Fig. 4a). We also tested three concentrations of CO2 (1.7%, 5%, 15%) and found that 5% elicited the strongest response, consistent with our wind tunnel experiments (Extended Data Fig. 4b-f, Supplemental Materials).
Although flies’ responses to ethanol and CO2 were similar at stimulus onset, attraction to ethanol was more sustained. The time course of behavior was remarkably similar in the walking arena and wind tunnel (Extended Data Fig. 2d-g), suggesting that the behavioral dynamics of olfactory attraction are robust to the stimulus environment, and may represent an adaptation for utilizing information that broad (CO2) and more specific (ethanol) odorants provide.
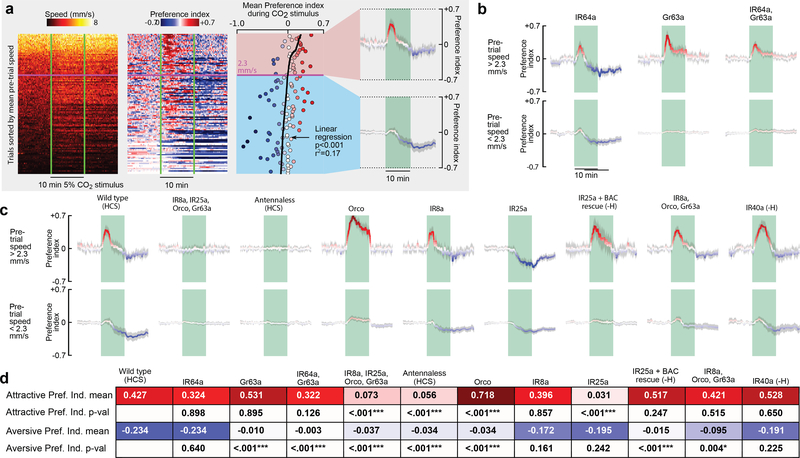
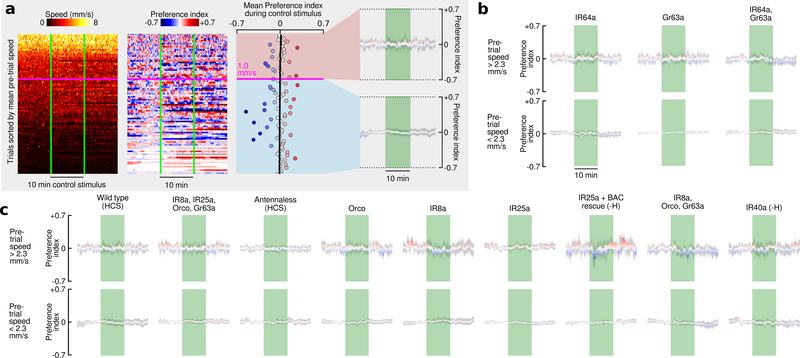
Prior research shows that CO2 aversion is mediated by Gr63a and Gr21a receptors7,9,21, with high concentrations of CO2 also being detected by an acid-sensitive ionotropic receptor IR64a10. In our assay, mutant flies lacking the IR64a receptor showed no significant change in their behavior compared to wild types (Fig. 4a-b). Consistent with prior work, mutants lacking the Gr63a receptor exhibited no aversion to CO2; however, they were still attracted to CO2 when active. Mutant flies homozygous for both Gr63a and IR64a behaved similarly to the Gr63a mutants. It is noteworthy that the characteristic decaying time course of attraction was unaffected in Gr63a mutants, even though these flies showed no aversion. Thus, the decay in attraction to CO2 is not caused by an increase in aversion over time.
Figure 4 |. Attraction and aversion to CO2 are mediated by separate chemosensory pathways.
a, Data from 10 cohorts of flies with a 5% CO2 stimulus sorted by the mean speed (S) during a reference period 5 min prior to stimulus presentation (). To achieve a range of baseline activities, 4 cohorts were starved for 24 hrs, 3 starved for 3 hrs, and 3 starved for 3 hrs and heated to 32° C, N = 112 trials. Preference index (PI) was calculated in two steps: (1) PI0 = (Nodor − Ncontrol)/Ntotal; (2) . Where N = number of flies, and Ntotal=10. We determined the linear regression for the mean PI during the stimulus with respect to and used the intercept to cluster the data into high and low activity groups. For these groups, we calculated the mean PI over time. b-c, Data plotted as in last panel of a, for different manipulations and mutants, using the intercept of 2.3 mm s−1 found in a to cluster the data. All flies were presented with randomly interleaved stimuli of 0% or 5% (5% responses are shown here, see Extended Data Fig. 5 for 0% responses). N = 16 – 110 trials per condition. Shading indicates bootstrapped 95% CI around the mean for a-c. d, Summary of statistics for each mutant. Top row shows the mean largest PI for the active group during the stimulus. Third row shows the mean smallest PI for the inactive group during the stimulus. Second and fourth rows show the p-values for a 2-tailed Kolmogorov-Smirnov test between the mutant and wild type. Bonferoni-corrected statistically significant differences are indicated with asterisks (***: p<0.005; **: p<0.01; *: p<0.05). For mutants followed by (-H) we omitted the data collected at 32°, because our analysis found these flies did not respond to CO2, despite responding under more natural 24 hr-starved conditions (see Extended Data Fig. 6).
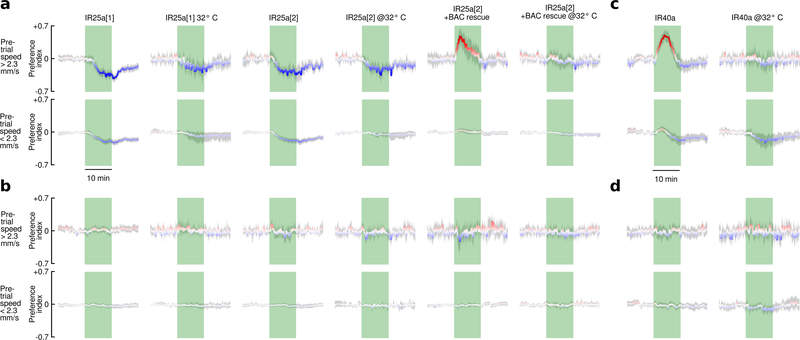
Given that CO2 attraction is not mediated by Gr63a/Gr21a or IR64a, we wanted to confirm that the attraction is indeed a chemosensory response. To determine if CO2 attraction is mediated by either an olfactory (OR) or ionotropic (IR) receptor, we tested a mutant which lacks the OR and IR co-receptors (Orco, IR25a, IR8a) as well as Gr63a (Fig. 4c). These near-anosmic mutants exhibited no detectable behavioral response to CO2. Flies in which we surgically removed the 3rd antennal segment also showed no response to CO2, despite normal levels of activity. Together with our arista ablations (Fig. 3e), these experiments show that CO2 attraction is mediated by receptors on the 3rd antennal segment. To further confirm this, we tested each co-receptor mutant individually and found that mutants lacking IR25a did not exhibit wildtype CO2 attraction, whereas Orco and IR8a mutants did (Fig. 4c). Mutant flies lacking Orco, IR8a, and Gr63a also exhibit wild type attraction to CO2, confirming that the only required co-receptor is IR25a. IR25a has been implicated in a wide range of behaviors including temperature22,23 and humidity23 sensation. We measured the temperature in our arena near the CO2 port, and found no change in temperature as a result of the stimulus (Extended Data Fig. 7). To eliminate the possibility of a humidity artifact, we tested an IR40a mutant, which still exhibited attraction to CO2 (Fig. 4c). In summary, our experiments show that CO2 attraction is mediated by a separate chemosensory pathway from aversion, and it requires the IR25a co-receptor (Fig. 4d). IR25a is the most highly conserved olfactory receptor among insects24,25. Perhaps other insect species that lack Gr63a26 but still respond to CO2 use the same IR25a dependent pathway. Unfortunately, the GAL4 driver for the IR25a promoter is only expressed in about half of the endogenous IR25a-expressing neurons27, making imaging experiments aimed at identifying which glomerulus is involved difficult at this time.
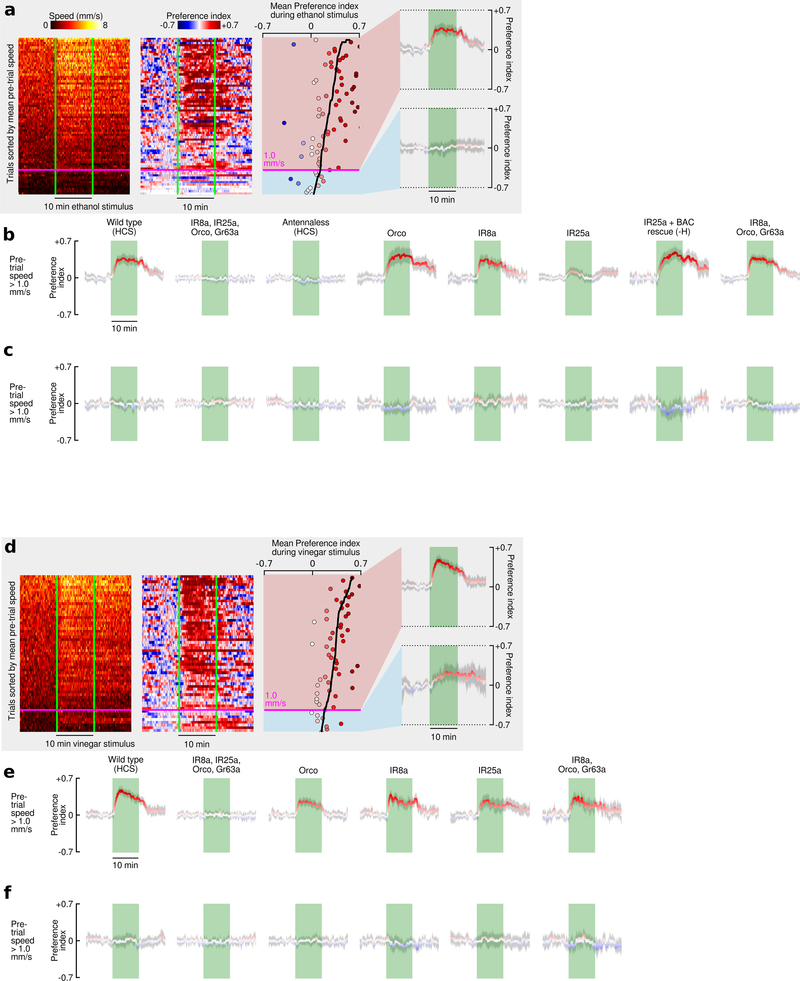
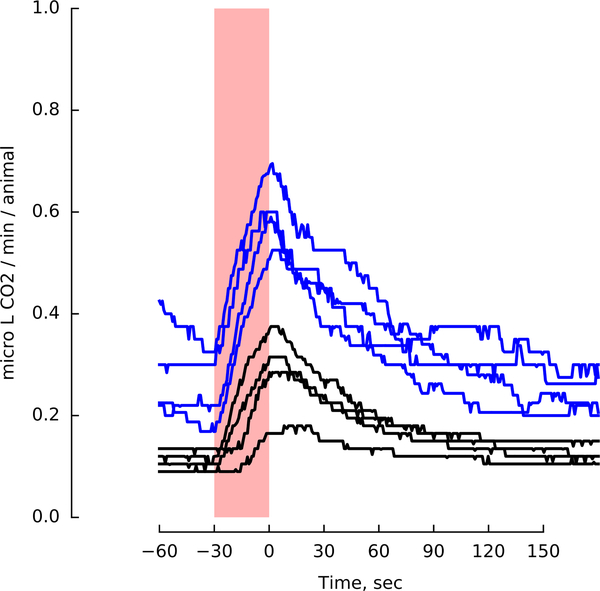
Our finding that active flies are attracted to CO2 makes ethologic sense given that CO2 is generated by yeast, flies’ preferred food. Why do Drosophila avoid CO2 when in a low activity state? Flies do not exhibit this state-dependent reaction to ethanol and vinegar (Extended Data Fig. 8). Perhaps the aversion to CO2 at low activity is an adaptation that minimizes encounters with CO2 seeking parasites. Alternatively, the behavior may help flies avoid respiratory acidosis when near high concentrations of CO2 within the environment14 (Extended Data Fig. 9). Prior studies suggested that CO2 serves as an aversive pheromone by which stressed flies signal others to flee a local environment7. However, an alternative explanation is that agitated flies release CO2 not as a social signal but simply because it is present in their tracheal system due to their process of discontinuous respiration28,29 (Extended Data Fig. 10). Further work on this intriguing state-dependent reaction to CO2 will require experiments that carefully consider the natural ethology of the animals.
Online Methods
Statistics and Reproducibility
Here we provide the exact number of trials, trajectories, individuals, and cohorts for each experiment. For our wind tunnel experiments, each trajectory was treated as an independent sample because it is impossible to keep track of individual flies’ identity in these experiments. In the walking assays, each trial was considered independent, as the inter-trial variability within a cohort of flies over the course of the 20 hour experiments was similar to the inter-cohort variability. This is in part due to the changes in activity over the course of the experiments. In all of our figures, we show the trial by trial variance with shaded 95% confidence intervals around the mean or median. These confidence intervals were determined by 1000 iterations of bootstrapped sampling with replacement. In each experiment, we attempted to collect the largest sample sizes we could, given the time constraints required for behavioral data in which an experiment with one cohort lasts for 24 hours. In situations in which we were comparing behavior under different conditions, we attempted to randomize the temporal sequence with which we collected data to minimize any artifacts due to long term influences such as season changes in humidity, temperature, etc. We did not employ blinding in our data collection design.
Additional statistics for Figure 3
To statistically compare the flies’ attraction to CO2 under the different conditions presented in Fig. 3, we used resampling (Fisher’s exact test) to test the significance of the difference in the preference indices exhibited by flies in key experiments. The preference index represents the strength of flies’ attraction to the odor (e.g. CO2), relative to the clean air control. The raw preference index, PI0, was first calculated for each point in time:
where Nodor and Ncontrol are the number of flies within the circular regions of interest around the odor and control ports, respectively, and Ntotal is the total number of flies. To remove baseline biases, we then subtracted the mean preference index for the 5-minute period prior to the odor stimulus to yield the relative preference index, PI:
To make statistical comparisons, we then calculated the average preference index for the first half of the odor presentation period (i.e. the first 5 minutes). We chose this range because it captures the majority of CO2 attraction, and thus focuses the statistical test on the most relevant time period.
These calculations provide a single preference index value for each trial of each cohort. For our resampling algorithm, we used 1000 iterations to determine the p-value, and repeated this calculation 1000 times to calculate a 95% confidence interval around these p-values. The confidence intervals are shown below for key comparisons.
Fig. 3b compared to Fig. 3c: 0.0249 < p-value < 0.0276
Fig. 3d(i) dusk compared to Fig. 3d(i) afternoon: 0.002 < p-value < 0.002
Fig. 3d(i) dusk compared to Fig. 3d(ii) dusk: 0 < p-value < 0.001
To compare the flies’ response to CO2 and ethanol, we used the full 10-minute odor presentation time frame because the differences in behavior primarily appear in the second half of the odor presentation.
Fig. 3d(iii) dusk compared to Fig. 3d(iv) dusk: 0 < p-value < 0.001 (24-hr starved flies)
Fig. 3i compared to Fig. 3j (red traces): 0 < p-value < 0.001 (12-hr starved flies)
To eliminate the possibility of pseudo-replication, we repeated our statistics after calculating the average PI(t) for each cohort before calculating . Thus, for the following statistics the input to our resampling test was a single preference index value for each cohort of flies. This is a very conservative measure, because there is similar intra-cohort variability compared to inter-cohort variability, in part due to the flies’ changes in circadian activity.
Fig. 3b compared to Fig. 3c: 0.0249 < p-value < 0.0276 (note: these experiments were 1 trial/cohort)
Fig. 3d(i) dusk compared to Fig. 3d(i) afternoon: 0.0124 < p-value < 0.0141
Fig. 3d(i) dusk compared to Fig. 3d(ii) dusk: 0.0129 < p-value < 0.0149
Fig. 3d(iii) dusk compared to Fig. 3d(iv) dusk: 0.0100 < p-value < 0.0120 (24-hr starved flies)
Fig. 3i compared to Fig. 3j (red traces): 0.0035 < p-value < 0.0045 (12-hr starved flies)
This definition of preference index was also used for the data presented in Fig. 4.
Animals
Wild type – Wild-type flies were descendants of a Heisenberg Canton-S stock (HCS). For the arista-clipped and antennaless flies, we cold-anesthetized flies and carefully removed the arista or 3rd antennal segment with sharpened forceps.
Each mutant used in our study is described in detail below. All experiments were done with mutants in which balancers and markers had been crossed out.
Gr63a, IR64a: +; +; Gr63a−/−, IR64a−/− double mutant – This line was generated using recombination by crossing TI{w[+m*]=TI}Gr63a[1] (Bloomington 9941) to Mi{ET1}Ir64a[MB05283] (Bloomington 24610). The double mutants were verified using PCR.
IR8a, IR25a, Orco, Gr63a (near anosmic): IR8a−/−; IR25a−/−; Orco−/−, Gr63a−/− quadruple mutant – Gift from Richard Benton and Ana Silbering30
IR8a, Orco, Gr63a: IR8a−/−; +; Orco−/−, Gr63a−/− triple mutant – This line generated by crossing IR8a; IR25a; Orco, Gr63a to wild type HCS.
Orco: +; +; Orco−/− – This line was created by backcrossing an Orco[2] (Bloomington 23130) line to the wild-type HCS for 5 generations, and verified through PCR.
IR64a: +; +; IR64a−/− – This line was created by backcrossing the Mi{ET1}Ir64a[MB05283] (Bloom 24610) line to the wild-type HCS for 7 generations, and verified through PCR.
IR8a: IR8a−/−; +; + – This mutant was a gift from Greg Suh31,32.
IR25a: +; IR25a−/−; + – We used two variants of this mutant ([1] and [2]), along with the bacterial artificial chromosome, all of which were gifts from Ralf Stanewsky. Fig. 4 uses the [2] variant.
Gr63a: +; +; Gr63a−/− – Bloomington 9941.
IR40a: +; IR40a−/−; + – This mutant was a gift from Marcus Stensmyr and Marco Galio33.
All of the flies were raised on a 16/8 light/dark light cycle at 25° C in standard 300 mL bottles on fly food consisting of: water (17.8 L), agar (136 g), cornmeal (1335.4 g), yeast (540 g), sucrose (320 g), molasses (1.64 L), CaCl2 (12.5 g), sodium tartrate (150 g), tegosept (18.45 g), 95% ethanol (153.3 mL), propionic acid (91.5 mL). For all of our experiments, we used 2- to 3- day-old female flies. To sort and starve flies, they were briefly anesthetized on a cold plate, and placed in a test-tube with a wet kimwipe.
Fermentation and Trap Assays
We prepared the wort from 130 mL of apple juice (Treetop brand) and 20 g of cane sugar, warmed to 35 degrees C. Next, we added 130 mg of Cellar Science EC-1118 wine yeast, which produces a neutral flavor and aroma. The fermentation was carried out at room temperature (23° C), under an airlock. All glassware was first sanitized with StarSan. We measured the specific gravity daily with a standard hydrometer, and calculated the alcohol content according to the following equation34,
where ABV is Alcohol by Volume, OG is the starting specific gravity, and FG is the final specific gravity. After 14 days, the fermentation had finished, and the yeast flocculated. At this point we sealed the containers and stored them in the fridge for 6–14 days while waiting for the next active batch of ferments to reach the desired age.
For the trap assays we let fermentations run for 2, 7, or 12 days. One day before these ferments were ready, we pulled a flocculated ferment from the fridge, and wet starved groups of flies, 50–150 flies each. The following day we ran three trap assay trials. For each trial we poured the active ferment into one jar, and the flocculated ferment into another jar, and inserted the traps into the jars. The two traps were placed side by side in our wind tunnel (~6cm apart), and a group of flies was released. Two hours later we removed the traps, CO2 anesthetized the flies, and counted the number of individuals in each trap. A preference index was calculated as: (Na – Nf) / (Na + Nf), where Na is the number of flies in the active ferment, and Nf is the number of flies in the flocculated ferment. For each condition we used four separate ferments, each used for three separate trials, for a total of 12 trials per condition.
CO2 Measurements of Fly Bottles
We first modified 500 mL Nalgene bottles by drilling two holes and fitting them with Luer Lock valves (with lock plugs attached). These Nalgene bottles are slightly larger than standard 8oz (300 mL) food bottles used by many Drosophila laboratories, and can be fitted with the same standard sized cotton plugs. For each Nalgene bottle, we melted the food from 1 fly food bottle (50 mL) in the microwave, and poured it inside. Once cooled, we added a measured amount of baker’s yeast, depending on the experiment, and fitted the bottle with a cotton plug and placed it in a 25° C incubator for 2 days. For experiments with flies, we added 10 females and 15 males to each bottle and allowed them to lay eggs in the bottles for two days. Fourteen days later (when the majority of the flies had eclosed, and were ~2 days old), we made our measurements.
To measure the CO2 content, we first pressed the cotton plug into the bottle far enough to twist on the original Nalgene cap, sealing the contents of the bottle inside. Meanwhile we prepared our CO2 analyzer, the LiCorr-6262, by running CO2 free air through the system at 20 L min−1.
We attached one of the Luer valves on the Nalgene to the input of the CO2 analyzer. Next we quickly attached the CO2 free air stream to the other Luer valve, slowly replacing the air inside the bottle with CO2 free air. Before connecting the air stream, we started our data acquisition. Data were collected from the LiCorr-6262 using the analog to digital converters on a Phidgets InterfaceKit, connected to an Ubuntu laptop running custom python code for data acquisition.
Preliminary measurements showed that the CO2 content of the bottles was beyond the dynamic range of the LiCorr-6262. To resolve this, we added a 500 mL container filled with CO2 free air as a buffer between the Nalgene bottle and the LiCorr. This buffer had the effect of spreading the CO2 content over a longer time frame, reducing the concentration, allowing us to accurately measure it. This approach, however, does not provide a direct measure of the CO2 concentration. For this, we performed a calibration by filling the 500 mL Nalgene bottles with air of a known CO2 concentration, and performing the experiment with these calibration bottles. After calibrating with three separate concentrations of 400 ppm, 2000 ppm, and 10,000 ppm, we found a linear relationship between our measured peak CO2 concentration, and the actual concentration of the bottles. Using this calibration curve, we were able to calculate the actual CO2 concentration of the Nalgene bottles filled with fly food based on their measured peak CO2 concentrations.
Wind Tunnel Assays – Free Flight
To record the free flight behavior of flying flies, we used the same wind tunnel and 3D tracking system described at length in previous papers35–37. To observe the animals’ behavior in response to odors we added an acrylic platform with two sites for odor release. Air flow was controlled using computer controlled Alicat mass flow controllers (0–200 mL min−1 range). For these and all other experiments, we used Teflon tubing. Cohorts of 12 female flies were starved for 6 hours prior to starting the experiments at 5 pm, 6 hours before the flies’ sunset. Starting at 8 pm (3 hours before the flies’ sunset), either CO2 or ethanol was released from the landing platform for 30 minutes, followed by an hour of clean air. This stimulus pattern was repeated 7 times.
Regions of interest
We chose regions of interest to quantify the behavior of the trajectories shown in the heatmaps of Fig. 1c-d. The boundaries of the regions for approaching the dark spot, approaching the platform, and landing on the platform, were chosen based on the behavior of the animals in the presence of the odors. The objective was to compare the behavior with the different odors and controls, rather than determine absolute numbers. Thus, the exact size and position of the regions is not critical.
The white region of interest was chosen to be roughly in the region where the odor plume passes, above and behind the dark spot. By comparing how many flies approach the pad or spot to how many pass through this white region, we control for the overall change in behavior of the animals in the presence of the odor. For example, it possible that the odor causes the flies to spend less time near the top of the tunnel, bringing them closer to the spot or platform, and thus more likely to approach these objects. By always selecting trajectories that passed through the same volume, we control for this overall change in behavior.
Wind Tunnel Assays – Free Walking
The 3D tracking system used for the free flight experiments did not have sufficient spatial and temporal resolution to accurately record the walking behavior of flies once they had landed on the pad. To examine this behavior more closely, we developed a new 2D real-time tracking system designed for general-purpose applications. Our python-based software and documentation is freely available on GitHub: http://florisvb.github.io/multi_tracker/. The software runs on Ubuntu, and is built on the ROS (Robot Operating System) framework, and takes advantage of open-source packages including OpenCV, scipy, numpy, pandas, h5py, and pyQTgraph. A brief overview of the software flow is as follows:
Image background subtraction
Thresholding and contour identification
Contours larger than a specified size are broken up into smaller contours (this corrects for cases when two flies come close to one another)
Data association using a posteriori estimates from a Kalman filter estimator
Kalman filtering of trajectories to (a) smooth position information, (b) estimate velocity, and (c) calculate a posteriori estimates for the next data association step
Trajectory data is recorded as an hdf5 file, and the changes from the background in the raw image are recorded as a ROS bag file.
Data can then be efficiently analyzed using the pandas data structure, and trajectories can be viewed and corrected using a custom pyQTgraph GUI.
CO2 plume measurements in the wind tunnel
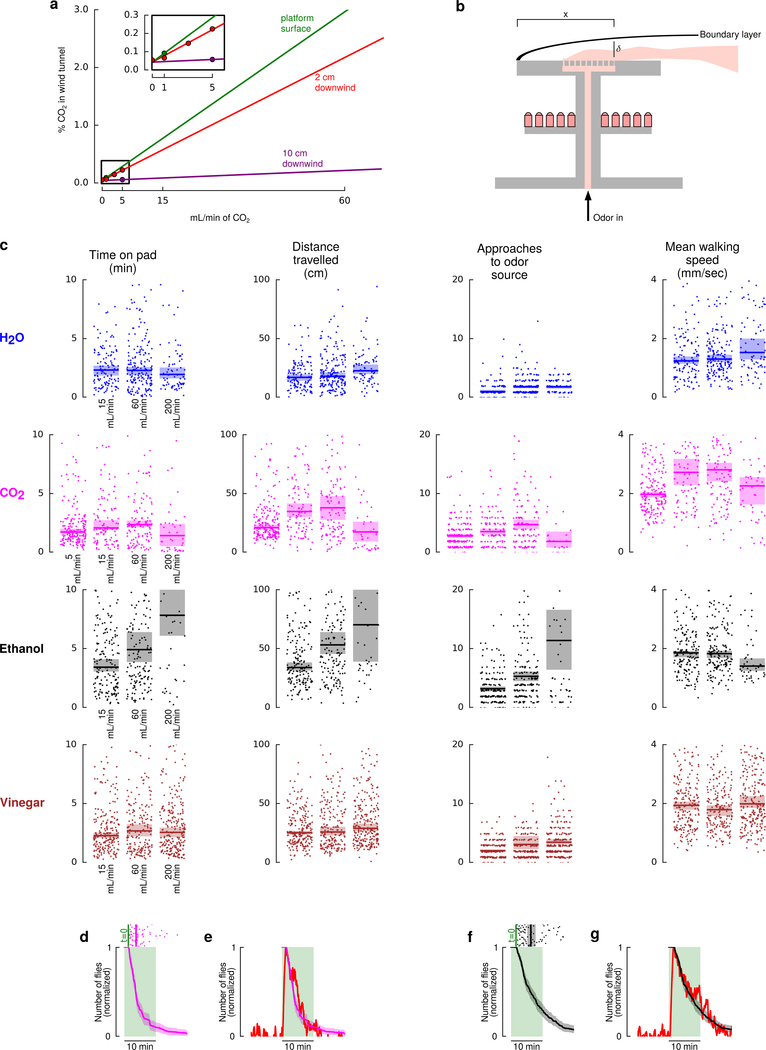
We measured the CO2 concentration downwind from the landing platform shown in Fig. 2a using a LiCorr-6262. To make accurate point measurements within the plume we used a 15 cm long tube with a 1 mm inner radius to minimize disturbances to the airflow. With a bulk air speed of 40 cm sec−1, the volume flow rate across the cross section of the tube was approximately 75 cm3 min−1 (mL min−1). We used a mass flow controller to regulate the suction being passed through the LiCorr-6262 to match this volume flow. After positioning the tube, we let the system equilibrate for several minutes before making a 2 min-long recording of the CO2 concentration.
Because the LiCorr-6262 has a measurement limit of approximately 3000 ppm (0.3%), we made our measurements at low CO2 flow rates (1–5 mL min−1), and used a linear model to calculate the CO2 concentration at larger flow rates (Extended Data Fig. 2a).
To further confirm our extrapolated measurements, we estimated the CO2 concentration on the platform from first principles, as follows. First, we assume that all of the CO2 that enters the wind tunnel is whisked away inside of the boundary layer (Extended Data Fig. 2b). The thickness of the boundary layer can therefore be used to estimate the average CO2 concentration within that layer. The thickness of the boundary layer can be approximated for laminar and turbulent flows as:
where δ is the thickness of the boundary layer, x is the distance downwind from the start of the platform, and Re is the Reynolds number. With a characteristic length of 9 cm, a kinematic viscosity of 15×10−6 m2 s−1 for air at 20° C, and a free stream velocity of 0.4 m s−1, the Reynolds number is 2400. For a value of x = 6 cm, the boundary layers for laminar and turbulent flows are 6.1 mm and 4.6 mm, respectively. For simplicity, we will continue our calculations with a boundary layer of 5 mm.
The total volume flowrate over the platform can now be calculated as follows. The mean velocity in the boundary layer is 0.2 m s−1 (half the free stream velocity), the CO2 is released from a 3×3 cm2 patch, and the boundary layer is 5 mm thick, thus, the total volume flowrate of clean air over the platform that is mixed with the introduced CO2 is approximately 0.2*0.03*0.005 = 0.00003 m3 s−1, or 1800 mL min−1. With 60 mL min−1 of CO2 added, the concentration comes to 3.2%, which agrees quite closely with our measurement model.
Walking Assays
We designed custom walking arenas from sheets of laser-cut acrylic (Extended Data Fig. 3). Prior to experiments, the cut acrylic was washed with soap (Liquinox) and warm water, and wiped down with ethanol. Between each experiment, the floor and ceiling of the arenas were wiped down with ethanol. All walking experiments were done in darkness. Experiments for Fig. 3b-c were done during flies’ peak activity (within 2 hours of their subjective dusk).
Odor Control in Walking Assays
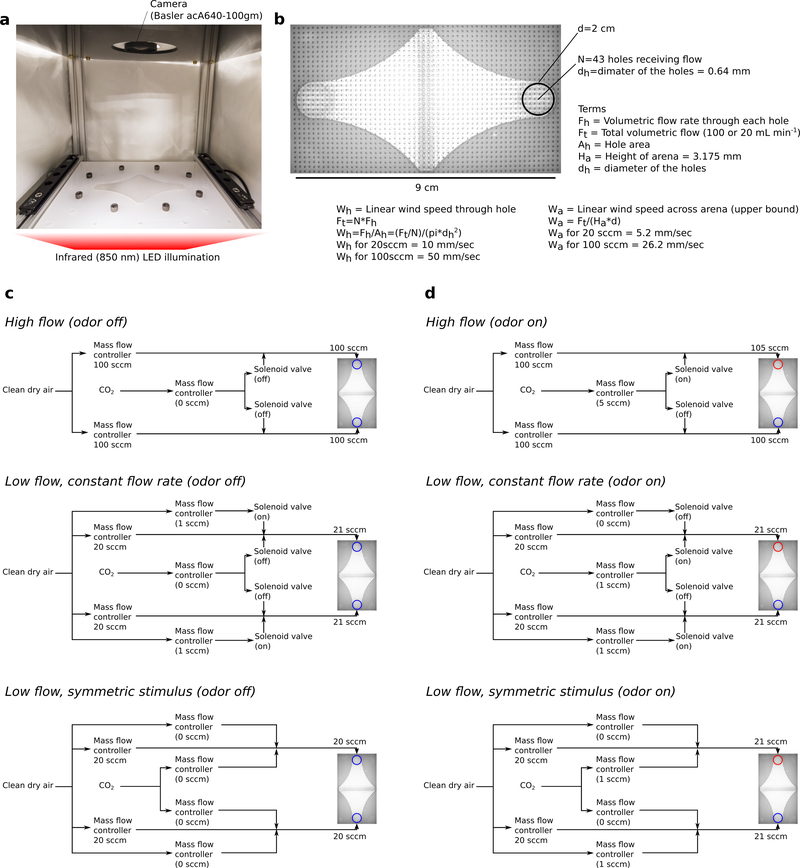
While conducting experiments at low bulk flow rates, we found that flies are exquisitely sensitive to minute changes in air flow, pressure, and humidity. In an attempt to minimize the effect of these factors, we utilized three different stimulus architectures (Extended Data Fig. 3), all of which provided consistent results. The odors were controlled using a combination of computer controlled Alicat mass flow controllers and solenoid valves. Our ROS-based python control software is available on GitHub: https://github.com/florisvb/multi_alicat_control. We employed three different odor delivery architectures for our experiments, as detailed below, and in Figures S5–6.
High flow
For our high flow (100 mL min−1 bulk flow rate) experiments, we bubbled the 100 mL min−1 flow through MilliQ water, and added 5 mL min−1 clean dry air, CO2, or clean dry air passed over a liquid ethanol reservoir, to the bulk flow. As a result of this architecture, during the odor presentation the flow rate of one side was slightly increased. However, experiments with clean dry air indicated that the flies did not respond to this change in flow rate. This arrangement was used for Fig. 4e.
Low flow, constant flow rate and humidity
At low flow rates (20 mL min−1 bulk flow rate), the architecture used for the high flow experiments did not work properly, as flies were attracted to the change in the overall flow rate. To overcome this, we re-designed the flow architecture. In this new system, we used additional mass flow controllers that added 1 mL min−1 of clean dry air to the bulk flow rate. During odor presentations, we used a solenoid to switch from 1 mL min−1 of clean dry air to CO2, or clean dry air passed over liquid ethanol. This architecture ensured that the flow rate and the humidity on the two sides remained equal and constant. Control experiments in which we added clean dry air instead of CO2 or ethanol confirmed that wild type flies had minimal responses to the changes in flow. This arrangement was used for Fig. 3d.
Low flow, symmetric stimulus
Curiously, the same architecture used above (low flow, constant flow rate and humidity), did elicit small responses in certain olfactory mutants. In order to achieve a complete null response in these flies, we re-designed the experimental architecture once more. In this third architecture, we removed the solenoids from the system as the flow transients they created appeared to be responsible for the responses of mutant flies. Instead, we connected two flow controllers to 20 mL min−1 bulk flow lines. One of these flow controllers provided clean dry air, and the other CO2. Both flow controllers were set to zero as a baseline. For each odor presentation we added 3 mL min−1 of flow to both sides of the arena. One side received 3 mL min−1 of clean dry air, whereas the other received 2 mL min−1 of clean dry air and 1 mL min−1 of CO2. In this arrangement, the flies experienced a change in the flow rate during odor presentations, however, the changes were symmetric. Furthermore, this arrangement made it possible to test different CO2 concentrations ranging from 0% to ~15% on the same cohort of flies, providing continuous internal controls for our experiments. For these experiments, we reduced gain of the PID control settings on the solenoids to provide smooth, slow change in flow rates. This is likely the cause for the slightly delayed behavioral responses we observed. This arrangement was used for Fig. 3b-c, 4a-d, and Extended Data Figures 4–8.
The qualitative, and even to a large extent quantitative, results across all three paradigms were consistent: at low activity the flies found CO2 aversive, whereas at high levels of activity the flies found CO2 attractive. Finding the same results while working with three different olfactory presentation architectures provides support for the robustness of our results.
Our experience with flies’ sensitivity to changes in flow conditions, in particular at low bulk flow rates, underscores how sensitive these animals are to odors and flow. Even our low flow rates of 20 mL min−1 are quite high relative to the natural flow rates a fly might experience on the surface, or in the cracks of, rotten fruit in the wild. The substantial changes in behavior we observed by reducing the flow rates to those better approximating field conditions highlights how important it is to consider the natural environments when studying sensory processing.
Temperature measurements
To eliminate any potential temperature-related confounds in our walking experiments, we measured the temperature in the arena near the odor ports using a thermistor rated to +/− 0.1° C (Omega brand model number 44031), connected to a Phidgets RTD sensor. Although we detected very small fluctuations in temperature throughout the day, we did not measure any changes in temperature that correlated with the presentation of our CO2 stimulus (Extended Data Fig. 5).
Flies’ fatal attraction to CO2
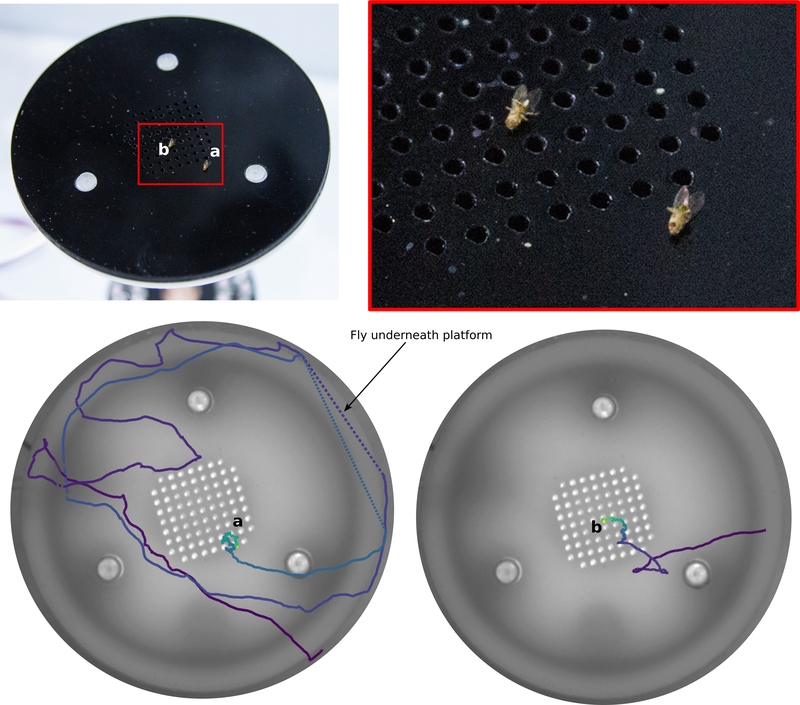
During experiments with a 200 mL min−1 CO2 stimulus in the wind tunnel, some flies that approached the CO2 were knocked out as they would be on a typical CO2 pad commonly used for sorting flies (Extended Data Fig. 9). Note that while the average concentration of CO2 just downwind from the odor stimulus would not have been lethal (10%, following the calculations associated with Extended Data Fig. 2a), the concentration right at the holes in the platform was 66% (200 mL min−1 CO2 added to 100 mL min−1 of clean air).
CO2 measurements of shaken insects
To measure the CO2 produced by flies and mosquitoes when shaken in a vial, we placed 10–20 animals in a vial and pumped 100 mL min−1 of CO2 free air through the container. After 1 min, we forcefully tapped the vial against the table for 30 seconds, and measured the concentration of CO2 in the air leaving the container using a LiCorr-6262. See Extended Data Fig. 10.
Extended Data
Extended Data Figure 1 |. Drosophila prefer early fermentations, at peak CO2 production.
a, Alcohol by volume for apple juice and sugar fermented with champagne yeast over the course of 2 weeks, measured with a hydrometer. CO2 production was calculated from the stoichiometry of fermentation (1 sugar molecule yields 2 ethanol + 2 CO2), corresponding to the derivative of alcohol by volume. N=4 independent ferments (the results were very consistent). b, Trap assay. c, Preference index exhibited by flies in three 2-choice assays, using traps shown in b. Flies were presented with two traps: one was a completed 14 day old ferment which had been stored in the refrigerator, the second was a fresh ferment aged 2, 7, or 12 days old. Positive preference index indicates a preference for the fresh ferment. Red line shows the linear regression (p<0.001, r2=0.28). N=12 trials per condition. The mean and standard deviation of the total captured flies for each trial was 105±59. d, CO2 concentration in 500 mL fly rearing bottles under common laboratory conditions. N=6 trials per condition. e, Measurement setup for the data shown in d. f, Time course of CO2 concentration measurement for three bottles filled with different concentrations of CO2. N=3 per calibration gas. g, Peak measured CO2 concentration vs. actual CO2 concentration for the calibration gases (black). Colored lines show the measured peak concentrations for the actual fly food bottles, and the resulting CO2 concentrations shown in d. In all panels, shading indicates bootstrapped 95% confidence intervals around the mean.
Extended Data Figure 2 |. Flies’ responses to odors at different concentrations.
a, CO2 concentration on the landing platform (green), and at two distances downwind from the downwind edge of the platform (red, purple). Measurements (shown with points) were made for low flow rates (see inset), and values at larger flowrates were extrapolated based on a linear model for measurements made at the 2 cm distance. This was necessary because the CO2 sensor could not accurately report concentrations higher than 0.5% CO2. b, Diagram illustrating the theoretical boundary layer used to confirm our measurements (see Methods). c, Flies’ responses to odors is consistent across a wide range of concentrations. Data plotted as in Fig. 3e, for additional flow rates. Points indicate individual data points (each trajectory contributes a single point). For each odor we recorded the following N = number of trajectories for each of the concentrations (listed left to right). H2O: 128, 183, 79; CO2: 195, 106, 125, 48; Ethanol: 173, 171, 47; Vinegar: 219, 193, 248. In all panels, shading indicates bootstrapped 95% confidence intervals around the median. d, Walking flies in this constrained arena show a similar CO2 attraction time course compared to flies in our wind tunnel. Scattergram shows the amount of time each fly spent searching the odor platform in the wind tunnel from Fig. 2a in the presence of 60 mL min−1 CO2 (data is repeated from Fig. 2e). Time trace is the bootstrapped mean and 95% confidence intervals for the normalized number of flies that would have been on the platform had all the flies landed simultaneously. The green shading is only provided for reference – the odor was never turned off in these wind tunnel experiments. e, Time trace from d overlaid on the normalized number of un-starved flies near the 5% CO2 source during the dusk time period in the walking arena, copied from Fig. 4d. f, Same as d, but for ethanol. g, Time trace from f overlaid on the normalized number of un-starved flies near the 5% ethanol source during the dusk time period in the walking arena, (data are not shown, but very similar to Fig. 3d ethanol case with starved flies). We chose un-starved flies for the comparisons because wind tunnel experiments were done with un-starved flies. We chose the 60 mL min−1 case because the CO2 concentration in the wind tunnel matches the 5% CO2 stimulus in the walking experiments.
Extended Data Figure 3 |. Walking arena geometry and odor stimulus.
a, Photograph of walking arena, with the lid removed. b, Annotated photograph of the walking arena as seen from above, taken with the machine vision camera that is used for tracking. c, Odor control for the three delivery architectures, odor off. d, Odor control for the three delivery architectures, odor on. In our experiments the port through which odor is delivered was alternated.
Extended Data Figure 4 |. Responses to CO2 are strongest at 5% concentration, and are unaffected by social dynamics.
a, Control and 5% CO2 responses for individual flies. For these experiments, we starved a single 2-day old wildtype (HCS) female fly for either 24 hrs or 3 hrs prior to starting the experiment. In every other way, the data is plotted as in Fig. 4. The data shown were collected from N = 29 individual flies, where each fly was subject to a 20-hour long experiment with N= 14 5% CO2 stimuli and N = 10 control stimuli. b, CO2 responses exhibited by flies to three concentrations of CO2. For these experiments, we starved groups of 10 flies for 24 hrs prior to starting the experiment. Flies were presented with 0%, 1.7%, or 5% CO2 in one set of experiments, and 0% or 15% in another set. Data are plotted as in Fig. 4. N = 20–170 trials per condition. To explain the complex dynamics of the approach behavior under the different CO2 concentrations, we made a very simple agent-based model with the pseudocode shown in c, see Supplemental Materials for additional discussion. d, Dynamics of flies’ CO2 attraction can be explained with by the simple agent-based model described in c. Preference indices are shown for the results of N = 100 iterations of the model under three different CO2 concentrations. The data are plotted in the same manner as b. The key insight offered by this model is that although our agents were programmed to exhibit the same behavior towards 1.7% and 5% CO2, the decreased likelihood of them detecting the lower concentration CO2 in conjunction with the long-term aversion results in an apparent indifference towards low concentrations of CO2. e, To show that flies are indeed attracted to the low (1.7%) concentration of CO2, we used a different analysis, which calculated the number of times that flies approached the CO2 source during the course of each 10 min stimulus. Pairwise statistics were determined with the 2-sample Kolmogorov-Smirnov test (test statistics were 0.57, 0.83, 0.41 for comparisons between 0% and 1.7%, 5%, and 15%). f, Time course of the number of times that flies approach the CO2 source, in 5-minute intervals. In each panel, shading shows bootstrapped 95% confidence intervals around the mean.
Extended Data Figure 5 |. Flies do not respond to a stimulus of clean air (without CO2).
Data plotted as in Fig. 4, but for a 0% CO2 stimulus. N = 17–81 trials per condition. Shading indicates bootstrapped 95% CI around the mean.
Extended Data Figure 6 |. IR25a is required for CO2 attraction, and IR40a is not.
As in Fig. 4, the data from each experimental group are sorted according to the mean speed during the reference period of 5 min prior to the odor stimulus. In addition, for each mutant we show two sets of panels corresponding to: (1) flies that were starved for 24 hrs or 3 hrs prior to experiments conducted at 23°, and (2) flies that were starved for 3 hours prior to experiments done at 32° C. This arrangement is in contrast to Fig. 4, in which data from the two temperature groups are combined. a, Responses of two IR25a mutants and a bacterial artificial chromosome rescue to a 5% CO2 stimulus (top two rows) and a 0% CO2 stimulus (bottom two rows). b, Responses of an IR40a mutant to a 5% CO2 stimulus (top two rows) and a 0% CO2 stimulus (bottom two rows). N = 4–78 trials per condition. Shading indicates bootstrapped 95% CI around the mean.
Extended Data Figure 7 |. Temperature measurements in the walking arena show no correlation with CO2 or clean air stimuli.
a, Temperature over the course of 16 hours (see Methods). As in our experiments, every 40 minutes a ten-minute CO2 stimulus identical to that used in Fig. 4 was applied either to the side of the arena with the temperature probe (green shading) or the opposite side of the arena (blue shading). b-c, Data from a time-aligned and baseline-subtracted for CO2 and control trials, respectively.
Extended Data Figure 8 |. IR25a is required for ethanol attraction, but not vinegar attraction.
Data plotted as in Fig. 4. Experiments were done with 24-hr starved flies only. a-b, responses to 3 mL min−1 air passed through a bottle of pure ethanol added to a 20 mL min−1 clean air. c, control responses with 3 mL/min of clean air added to 20 mL min−1 of clean air. d-e, responses to 3 mL min−1 air passed through a bottle of pure vinegar added to a 20 mL min−1 clean air. f, control responses with 3 mL min−1 of clean air added to 20 mL min−1 of clean air. N = 14–70 trials per condition. Shading indicates bootstrapped 95% CI around the mean.
Extended Data Figure 9 |. Drosophila are attracted to fatal levels CO2.
Above: Photograph of two flies that were fatally attracted to a 200 mL min−1 CO2 stimulus. Below: trajectories for those two flies prior to when they became anesthetized and died. Color encodes time (starting at purple, ending at green / yellow).
Extended Data Figure 10 |. Flies and mosquitoes both increase CO2 production when shaken.
Red shading indicates time during which vial was shaken. We tested four groups of 10–20 animals for flies (black) and mosquitoes (blue). CO2 was measured with a LiCorr-6262. See Methods for details.
Supplementary Material
Acknowledgements
We thank Andrew Straw for the 3D tracking software. Several colleagues provided mutants: Richard Benton (quadruple mutant), Ralf Stanewsky (IR25a and rescue); Greg Suh (IR8a), Marco Gallio and Marcus Stensmyr (IR40a). Richard Benton, Elizabeth Hong, and Jeff Riffell contributed helpful comments. This work was funded by grants from NIH (NIH1RO1DCO13693–01, U01NS090514) and the Simons Foundation.
Footnotes
The authors declare no competing interests.
Data Availability
Processed data are available in a Dryad repository at: doi:10.5061/dryad.2s8422f
Raw data are available from the authors upon request.
Code Availability
Custom Code is available online at: https://github.com/florisvb/drosophila_co2_attraction
References
- 1.Guerenstein PG & Hildebrand JG Roles and Effects of Environmental Carbon Dioxide in Insect Life. Annu. Rev. Entomol 161–178 (2008). doi: 10.1146/annurev.ento.53.103106.093402 [DOI] [PubMed] [Google Scholar]
- 2.Dekker T & Cardé RT Moment-to-moment flight manoeuvres of the female yellow fever mosquito (Aedes aegypti L.) in response to plumes of carbon dioxide and human skin odour. J. Exp. Biol 214, 3480–94 (2011). [DOI] [PubMed] [Google Scholar]
- 3.Thom C, Guerenstein PG, Mechaber WL & Hildebrand JG Floral CO2 Reveals Flower Profitability to Moths. J. Chem. Ecol 30, 1285–1288 (2004). [DOI] [PubMed] [Google Scholar]
- 4.Buehlmann C, Hansson BS & Knaden M Path Integration Controls Nest-Plume Following in Desert Ants. Curr. Biol 22, 645–649 (2012). [DOI] [PubMed] [Google Scholar]
- 5.Stange G Carbon Dioxide Is a Close-Range Oviposition Attractant in the Queensland Fruit Fly Bactrocera tryoni. Naturwissenschaften 86, 190–192 (1999). [Google Scholar]
- 6.Klocke D, Schmitz A & Schmitz H Native flies attracted to bushfires. (2009).
- 7.Suh GSB et al. A single population of olfactory sensory neurons mediates an innate avoidance behaviour in Drosophila. Nature 431, 854–859 (2004). [DOI] [PubMed] [Google Scholar]
- 8.Faucher C, Forstreuter M, Hilker M & de Bruyne M Behavioral responses of Drosophila to biogenic levels of carbon dioxide depend on life-stage, sex and olfactory context. J. Exp. Biol 209, 2739–2748 (2006). [DOI] [PubMed] [Google Scholar]
- 9.Jones WD, Cayirlioglu P, Grunwald Kadow I & Vosshall LB Two chemosensory receptors together mediate carbon dioxide detection in Drosophila. Nature 445, 86–90 (2007). [DOI] [PubMed] [Google Scholar]
- 10.Ai M et al. Acid sensing by the Drosophila olfactory system. Nature 468, 691–695 (2010). [DOI] [PMC free article] [PubMed] [Google Scholar]
- 11.Faucher P, Hilker M & de Bruyne M Interactions of Carbon Dioxide and Food Odours in Drosophila : Olfactory Hedonics and Sensory Neuron Properties. PLoS One 8, 1–13 (2013). [DOI] [PMC free article] [PubMed] [Google Scholar]
- 12.Lin H, Chu L, Fu T, Dickson BJ & Chiang A Parallel Neural Pathways Mediate CO2 Avoidance Responses in Drosophila. Science (80-. ). 340, 1338–1341 (2013). [DOI] [PubMed] [Google Scholar]
- 13.Sorey Michael L. et al. Invisible CO2 Gas Killing Trees at Mammoth Mountain, California. (2001).
- 14.Hubbard HG Insect Life in the Hot Springs of Yellowstone National Park. Can. Entomol 23, (1891). [Google Scholar]
- 15.van Breugel F, Riffell J, Fairhall A & Dickinson MH Mosquitoes Use Vision to Associate Odor Plumes with Thermal Targets. Curr. Biol 25, 2123–2129 (2015). [DOI] [PMC free article] [PubMed] [Google Scholar]
- 16.van Breugel F & Dickinson MH Plume-tracking behavior of flying Drosophila emerges from a set of distinct sensory-motor reflexes. Curr. Biol 24, 274–86 (2014). [DOI] [PubMed] [Google Scholar]
- 17.Kim IS & Dickinson MH Idiothetic Path Integration in the Fruit Fly Drosophila melanogaster. Curr. Biol 27, 2227–2238 (2017). [DOI] [PubMed] [Google Scholar]
- 18.Wasserman S, Salomon A & Frye M. a. Drosophila tracks carbon dioxide in flight. Curr. Biol 23, 301–6 (2013). [DOI] [PMC free article] [PubMed] [Google Scholar]
- 19.Yorozu S et al. Distinct sensory representations of wind and near-field sound in the Drosophila brain. Nature 457, 201–205 (2009). [DOI] [PMC free article] [PubMed] [Google Scholar]
- 20.Gaudry Q, Nagel KI & Wilson RI Smelling on the fly: sensory cues and strategies for olfactory navigation in Drosophila. Curr. Opin. Neurobiol 22, 216–22 (2012). [DOI] [PMC free article] [PubMed] [Google Scholar]
- 21.Kwon JY, Dahanukar A, Weiss L. a & Carlson JR The molecular basis of CO2 reception in Drosophila. Proc. Natl. Acad. Sci. U. S. A 104, 3574–8 (2007). [DOI] [PMC free article] [PubMed] [Google Scholar]
- 22.Ni L et al. The ionotropic receptors IR21a and IR25a mediate cool sensing in Drosophila. Elife 5, 1–12 (2016). [DOI] [PMC free article] [PubMed] [Google Scholar]
- 23.Enjin A et al. Humidity Sensing in Drosophila. Curr. Biol 26, 1352–1358 (2016). [DOI] [PMC free article] [PubMed] [Google Scholar]
- 24.Silbering AF et al. Complementary Function and Integrated Wiring of the Evolutionarily Distinct Drosophila Olfactory Subsystems. J. Neurosci 31, 13357–13375 (2011). [DOI] [PMC free article] [PubMed] [Google Scholar]
- 25.Croset V et al. Ancient protostome origin of chemosensory ionotropic glutamate receptors and the evolution of insect taste and olfaction. PLoS Genet 6, 1–20 (2010). [DOI] [PMC free article] [PubMed] [Google Scholar]
- 26.Robertson HM & Kent LB Evolution of the gene lineage encoding the carbon dioxide receptor in insects. J. insect Sci 9, 19 (2009). [DOI] [PMC free article] [PubMed] [Google Scholar]
- 27.Abuin L et al. Functional Architecture of Olfactory Ionotropic Glutamate Receptors. Neuron 69, 44–60 (2011). [DOI] [PMC free article] [PubMed] [Google Scholar]
- 28.Lighton JRB Discontinuous Gas Exchange in Insects. Annu. Rev. Entomol 41, 309–324 (1996). [DOI] [PubMed] [Google Scholar]
- 29.Hetz SK & Bradley TJ Insects breathe discontinuously to avoid oxygen toxicity. Nature 433, 516–519 (2005). [DOI] [PubMed] [Google Scholar]
- 30.Ramdya P et al. Mechanosensory interactions drive collective behaviour in Drosophila. Nature 519, 233–236 (2015). [DOI] [PMC free article] [PubMed] [Google Scholar]
- 31.Ai M et al. Ionotropic Glutamate Receptors IR64a and IR8a Form a Functional Odorant Receptor Complex In Vivo in Drosophila. J. Neurosci 33, 10741–10749 (2013). [DOI] [PMC free article] [PubMed] [Google Scholar]
- 32.Abuin L et al. Functional Architecture of Olfactory Ionotropic Glutamate Receptors. Neuron 69, 44–60 (2011). [DOI] [PMC free article] [PubMed] [Google Scholar]
- 33.Enjin A et al. Humidity Sensing in Drosophila. Curr. Biol 26, 1352–1358 (2016). [DOI] [PMC free article] [PubMed] [Google Scholar]
- 34.Hall ML Brew by the Numbers: Add Up What’s in Your Beer. Zymurgy 18, [Google Scholar]
- 35.van Breugel F & Dickinson MH Plume-tracking behavior of flying Drosophila emerges from a set of distinct sensory-motor reflexes. Curr. Biol 24, 274–86 (2014). [DOI] [PubMed] [Google Scholar]
- 36.Straw AD, Branson K, Neumann TR & Dickinson MH Multi-camera real-time three-dimensional tracking of multiple flying animals. J. R. Soc. Interface 8, 395–409 (2011). [DOI] [PMC free article] [PubMed] [Google Scholar]
- 37.Stowers JR et al. Virtual reality for freely moving animals. Nat. Methods 14, 995–1002 (2017). [DOI] [PMC free article] [PubMed] [Google Scholar]
Associated Data
This section collects any data citations, data availability statements, or supplementary materials included in this article.


