

Abstract
Background:
The rise in opioid use and overdose has increased the importance of improving data collection methods for the purpose of targeting resources to high-need populations and responding rapidly to emerging trends
Objective:
To determine whether Twitter data could be used to identify geographic differences in opioid-related discussion and whether opioid topics were significantly correlated with opioid overdose death rate
Methods:
We filtered approximately 10 billion tweets for keywords related to opioids between July 2009 and October 2015. The content of the messages was summarized into 50 topics generated using Latent Dirchlet Allocation, a machine learning analytic tool. The correlation between topic distribution and census region, census division, and opioid overdose death rate were quantified.
Results:
We evaluated a tweet cohort of 84,023 tweets from 72,211 unique users across the US. Unique opioid-related topics were significantly correlated with different Census Bureau divisions and with opioid overdose death rates at the state and county level. Drug-related crime, language of use, and online drug purchasing emerged as themes in various Census Bureau divisions. Drug-related crime, opioid-related news, and pop culture themes were significantly correlated with county-level opioid overdose death rates, and online drug purchasing was significantly correlated with state-level opioid overdoses.
Conclusions:
Regional differences in opioid-related topics reflect geographic variation in the content of Twitter discussion about opioids. Analysis of Twitter data also produced topics significantly correlated with opioid overdose death rates. Ongoing analysis of Twitter data could provide a means of identifying emerging trends related to opioids.
Introduction
The epidemic of morbidity and mortality related to the overprescription and misuse of opioids has garnered national attention and motivated significant policy change in recent years. Opioid overdoses have quadrupled since 1999 and were associated with 33,091 deaths in 2015 (Centers for Disease Control and Prevention, 2016a). Prescription opioids are the main driver of drug overdoses and deaths (Paulozzi, 2006; Paulozzi et al., 2006; Paulozzi & Ryan, 2006). Sales of prescription opioids in the US nearly quadrupled from 1999 to 2014. Other studies have demonstrated increased rates of opioid use for non-cancer pain (Centers for Disease Control and Prevention, 2016b; Blanco, et al., 2007; Zacny, et al., 2003) and during emergency department visits (Gilson, et al., 2004; Joranson, et al., 2000).
There is significant geographic variation in opioid-related outcomes with some cities, counties, states, and regions demonstrating significantly higher rates of opioid-related deaths, opioid overdoses, and rates of opioid prescriptions. For example, regional analysis of opioid overdose death rates shows that opioid overdose death rates in the New England Census Bureau division and South East Central division (which includes Kentucky, Tennessee, Mississippi, and Alabama) are nearly double the rates in places like the Pacific division, which includes all the west coast states (Centers for Disease Control and Prevention, 2017). In 2012, the rate of opioid prescriptions in Hawaii was 52 per 100 people, while it was 275% higher at 143 per 100 people in Alabama and Kentucky, the highest prescribing states that year (Centers for Disease Control and Prevention, 2014).
These differences in outcomes are undoubtedly related to the heterogeneity of states’ policies and changes implemented recently in response to the opioid epidemic. For example, in 2013, rules passed in New York and Tennessee requiring prescribers to check their states’ prescription drug monitoring programs (PDMPs) before prescribing opioids resulted in 75% and 36% decreases, respectively, in the number of patients who were seeing multiple prescribers to obtain the same drugs (Centers for Disease Control and Prevention, 2014). States also demonstrate significant variation in laws related to opioid prescription, including limits on the quantity and duration of opioid prescriptions, requirements for documenting pain management plans, and mandatory continuing education on risks and benefits of the use of opioids, among many others (National Alliance for Model State Drug Laws, 2016a and 2016b).
The existent diversity among opioid-related policy, health-related outcomes, and the rate at which new policies are being adopted increase the importance of accurate, timely data collection. Areas with high rates of opioid overdoses would especially benefit from highly-responsive data collection mechanisms that might allow early identification of potential causes and trends and implement targeted interventions. Given the amount of controversy that remains concerning best responses to opioid misuse, nuanced data that reflects multi-level geographic differences and trends not identified by typical survey measures could be of value.
Previous studies have demonstrated that analysis of large data sets collected from social media platforms such as Twitter can be used to identify significant correlations between language and a variety of other measures, including geographic region, demographic characteristics like gender, and health-related outcomes (Schwartz, et al., 2013a; Wong, et al., 2015; Smith, et al., 2017; Guntuju, et al., 2017; Sinnenberg, et al., 2016).
Similarly, linguistic themes related to opioid discussion on Twitter may provide context for the characteristics of opioid misuse patterns in different geographic areas, including how different areas have chosen to respond to the opioid epidemic, how opioids are perceived by the public, and what causal factors influence opioid misuse. Linguistic analysis may also provide useful insight into the unique challenges involved in developing responses to a dynamic opioid market and help identify opportunities for targeted intervention in different populations or geographic areas. Emerging linguistic trends related to opioids in Twitter data may have potential to act as a surveillance tool for identification of counties at imminent risk for increase in opioid overdose deaths due, for example, to an influx of powerful synthetic opioids into the drug market. The goal of the current study was to determine whether Twitter data could be used to identify geographic differences in opioid-related discussion and to determine whether opioid topics were significantly correlated with opioid overdose death rate.
Methods
We collected tweets related to opioids in the United States (n = 84,023). The content of the messages was summarized into 50 topics generated using Latent Dirchlet Allocation (Blei, et al., 2006). The correlations between topic distribution and census region, census division, and opioid overdose death rate were quantified.
Twitter Data
Twitter is a social media platform which allows users to send and receive 140-character messages called tweets (Twitter Inc., 2017). Tweets about opioids were collected via the Twitter Application Programming Interface (API), a program that allows researchers to query historic tweets. A random 1% sample of Tweets was collected from January 1 to April 2, 2012 and from April 18, 2013 to October 1, 2015. A random 10% sample of tweets was collected from July 23, 2009 to February 9, 2011 and from April 3, 2012 to April 17, 2013.
Pre-processing of Twitter Data
The dataset analyzed was filtered for messages containing opioid references using opioid terms (supplement 1) resulting in 767,749 tweets. All tweets including one or more opioid terms were included regardless of source (individual, organization, etc.). These were then filtered for English language that could be mapped to a county in the US (n = 573,254). English tweets were identified using the language identification tool developed by Liu, Marco, and Baldwin (Association for Computational Linguistics, 2012). Tweets were mapped to a county using a combination of coordinates and the user-provided location field per the method described by Schwartz et al (Schwartz, et al., 2013a). The general process for mapping involves first checking for tweet latitude and longitude coordinates within the US. If these are not provided due to user settings, location information from the user profile—county and state or city and state—was used to geolocate the tweet. If only the city or county name was provided without the state, the tweet was geolocated only if the city name was unambiguous (i.e. if there is one city with a particular name that has over 90% of the total population of all cities with that name. For example, “Chicago” would be tagged but “Springfield” would not.) The English, county-mapped tweets were then filtered for duplicates.
Topic Modeling
Utilizing all the English messages from the opioid-related dataset (n = 573,254), 50 topics were generated using the Mallet implementation of Latent Dirichlet Allocation (LDA). LDA is a computer automated process used to group words into topics based on their cooccurring patterns. Prior to LDA, we identified the 1-grams most relevant to opioid-related content. To do this, we randomly sampled 816,787 tweets that did not contain any of the opioid-related search terms and were generated during the same time frame as the opioid-related tweets. The weighted log-odds ratio of each word’s use in a group, opioid or non-opioid, was calculated using an informed Dirichlet prior as described in Monroe, Colaresi, and Quinn (Monroe, et al., 2008).
The 5,000 1-grams with the highest log-odds ratio associated with opioid messages were used as a whitelist for the input to LDA. A whitelist in this context consists of terms that are most associated with tweets containing one of the words on the list of opioid terms (see supplement 1). Only messages from the opioid dataset containing those top 1-grams were selected as input to LDA, and only the whitelist features from those messages were used.
The topic distribution of each individual message was calculated as previously described (Schwartz, et al., 2013a). The census region of each tweet was identified using the county label. The Pearson correlation between topic distribution and census region of the tweets was calculated. All correlations were corrected for false discovery rate using Bonferroni correction.
Outcome measures
Average crude rate of opioid-related deaths from 2009–2014, county level
We utilized differential language analysis (Schwartz, et al., 2013b), and an open-vocabulary approach, to identify the correlation between the county-level tweet topic content and the crude rate of death due to opioid overdose in that county. Messages were grouped at the county level and topic features, the distribution of topics in each message, were assigned using the topics previously generated via LDA. We performed Pearson correlation to correlate the 50 topics of the deduplicated county-mapped dataset with the average crude rate of county-level opioid-related deaths from 2009 to 2014. (For example, counties with more tweets including topic A and a higher opioid overdose death rate would exhibit positive correlation between topic A and opioid overdose death rate.) The average crude rate of county-level opioid-related deaths was obtained from the CDC WONDER (Centers for Disease Control and Prevention, 2017), an online database containing a wide array of public health information, based on ICD-9 and ICD-10 codes, a diagnosis classification system developed by the CDC for use in healthcare settings. This includes cases where opioids are cited as the cause of death and/or a contributing cause of death for instances in which multiple causes were present. Counties had to have a minimum of two years of unsuppressed data to be considered. This analysis includes counties considered by the CDC as ‘unreliable.’ The label ‘unreliable’ means that the county had fewer than 20 deaths related to opioids.
Average crude rate of opioid-related deaths from 2009 to 2014, state level
The state code was derived from the FIPS code and messages were grouped by state. FIPS state codes are numeric and two-letter alphabet codes defined in the U.S. Federal Information Processing Standard Publication 5–2 to identify U.S. states (National Institute of Standards and Technology, 1987). The average crude rate of opioid-related deaths from 2009 to 2014 was obtained from the CDC WONDER database based on ICD-9 codes. The state death counts are higher than the sum of the county level death counts, indicating that the suppressed data in counties where opioid-related death occurs infrequently were present in the state data.
Results
We identified 84,023 tweets from 72,211 unique users which included opioid terms.
Topics Correlated with Census Bureau Divisions
A descriptive summary of the tweet cohort including number of unique users, number of messages, and opioid overdose death rate for each of the nine Census Bureau divisions is shown in Table 1.
Table 1|. Descriptive summary of tweet cohort and crude opioid overdose death rate by Census Bureau division.
The unique user count, message count, and opioid overdose death rate for each Census Bureau division is shown.
| Census bureau divisiona | Unique User Count | Message Count | Crude Opioid Overdose Death Rate per 100k Populationb |
|---|---|---|---|
| East North Central | 11229 | 13124 | 25.6 |
| East South Central | 3295 | 3807 | 26.5 |
| Middle Atlantic | 8116 | 9358 | 22.7 |
| Mountain | 4511 | 5320 | 25.7 |
| New England | 3748 | 4336 | 30.3 |
| Pacific | 15343 | 18503 | 17.5 |
| South Atlantic | 13680 | 158 73 | 20.8 |
| West North Central | 3769 | 4271 | 16.6 |
| West South Central | 8520 | 9431 | 16.8 |
. East North Central: Indiana, Illinois, Michigan, Ohio, Wisconsin. East South Central: Alabama, Kentucky, Mississippi, Tennessee. Middle Atlantic: New Jersey, New York, Pennsylvania. Mountain: Arizona, Colorado, Idaho, New Mexico, Montana, Utah, Nevada, Wyoming. New England: Connecticut, Maine, Massachusetts, New Hampshire, Rhode Island, Vermont. Pacific: Alaska, California, Hawaii, Oregon, Washington. South Atlantic: Delaware, District of Columbia, Florida, Georgia, Maryland, North Carolina, South Carolina, Virginia, West Virginia. West North Central: Iowa, Kansas, Minnesota, Missouri, Nebraska, North Dakota, South Dakota. West South Central: Arkansas, Louisiana, Oklahoma, Texas.
. Centers for Disease Control and Prevention. (2017). Wide-ranging online data for epidemiologic research (WONDER). Retrieved from https://wonder.cdc.gov
Analysis of opioid topics that were significantly correlated with different Census Bureau divisions revealed geographic differences in opioid themes. Drug-related crime emerged as a theme in the northeastern divisions (New England, Middle Atlantic, and East North Central), while language of use emerged as a theme in the southeastern divisions (West South Central, East South Central, and South Atlantic). Online drug purchasing was a significant theme for tweets from divisions in the center of the country, including the West North Central and Mountain divisions.
Figure 1 shows the most common opioid-related themes discussed in each division. The complete set of themes discussed in each division is shown in supplement 1. Examples of topics representing different opioid-related themes are shown in Figure 2. Topic differences among Census Bureau regions yielded similar results but with less geographic specificity.
Figure 1|. Most common Twitter themes correlated with Census Bureau divisions.
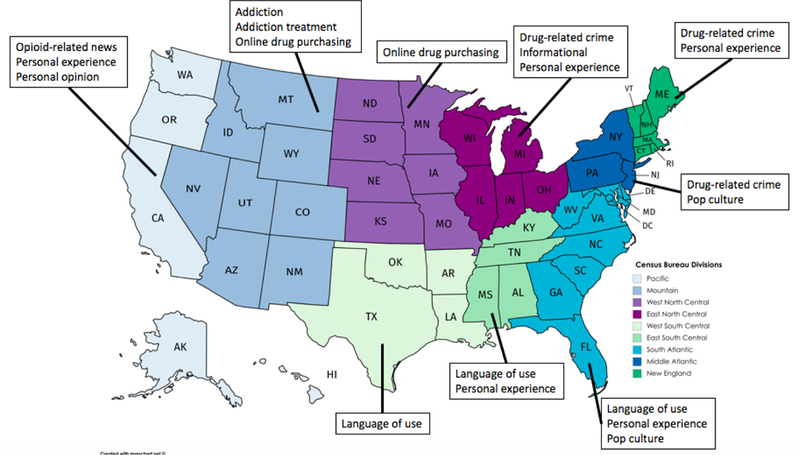
The variable number of themes shown for each division is the result of topic redundancy. For example, in the New England division, only two themes are described in the figure, because all five of the most common topics reflected one of those two themes.
Figure 2|. Theme and example of opioid-related topics significantly correlated with Census Bureau divisions.
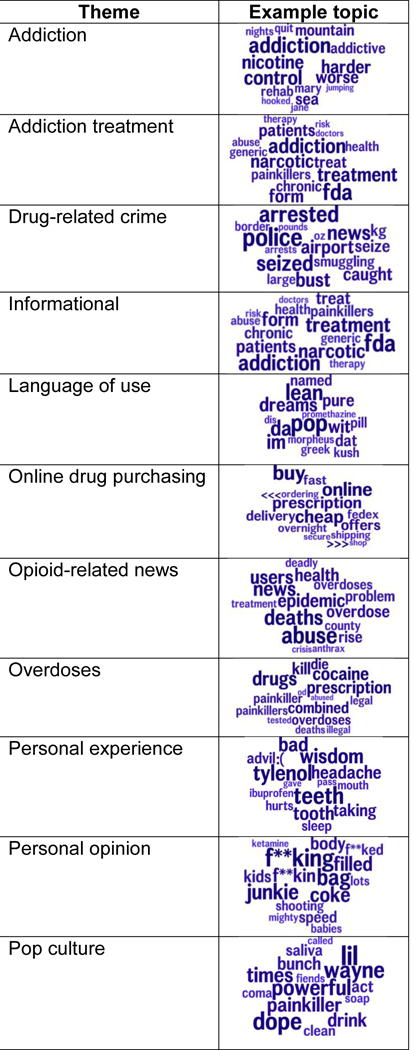
The size of the words in the word cloud represent the relative frequency of occurrence within a given topic.
Topics Correlated with County- and State-Level Opioid Overdose Death Rates
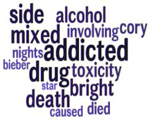
Analysis of opioid Tweet content at the county and state levels revealed topics that were significantly correlated with opioid overdose death rates. Table 2 shows the language topics most highly correlated with opioid overdose death rates at the county and state levels. The language topic most correlated with opioid overdose death rate (r = 0.331) contained the words “police,” “arrested,” “trafficking,” “bust,” and “dealer,” and was assigned the theme of “drug-related crime.” The second-most correlated topic (r = 0.282) contained the words “Bieber,” “star,” “died,” “addicted,” and “drug,” and was assigned the theme “pop culture.” The third most correlated topic (r = 0.278) contained the words “news,” epidemic,” “overdoses,” and “deadly,” and was assigned the theme “opioid-related news.” The topic correlated with state overdose death rates (r = 0.449) included the words “prescription,” “online,” “delivery,” “cheap,” and “buy,” and was assigned the theme “online drug purchasing.”
Table 2|. Opioid themes and example topics significantly correlated with opioid overdose death rate at the county and state levels.
Themes significantly correlated with the opioid overdose death rate at the county and state levels are shown below. An example topic for each theme is included.
| Geographic division | Theme (r value) |
Example topic |
|---|---|---|
| County | Drug-related crime (r = 0.331) |
 |
| Opioid-related news (r = 0.278) |
 |
|
| Pop culture (r = 0.282) |
 |
|
| State | Online drug purchasing (r = 0.449) |
 |
Discussion
Our study had three major findings: 1) Unique opioid-related topics emerge from natural language processing of tweets containing opioid terms; 2) Distinct linguistic themes related to opioids are significantly correlated with different Census Bureau regions and divisions; and 3) Unique opioid-related linguistic themes are correlated with opioid overdose at the state and county levels.
Topics Correlated with Census Bureau Divisions
Our analysis of opioid-related tweets revealed linguistic differences in opioid topics discussed in different geographic areas. Opioid topic themes from Twitter may provide context for the unique characteristics of opioid misuse patterns in different areas, including how different areas have chosen to respond to the opioid epidemic, how opioids are perceived by the public, and what causal factors influence opioid misuse. For example, topics with the theme of “drug-related crime” were correlated only with the three most northeastern Census Bureau divisions (New England, Middle Atlantic, and East North Central), while topics with the theme “language of use” (containing words like “pop,” “pill,” “lean,” and “dreams”) were primarily in the three southeastern divisions. These differences in linguistic themes parallel other regional differences related to opioid misuse identified in previous studies (Unick & Ciccarone, 2017; Keyes, et al., 2014). For example, analysis of data from the National Inpatient Sample from 2000 to 2014 showed that hospitalizations for heroin overdose were highest in the Northeastern Census Bureau region while hospitalizations from prescription opioid overdose were highest in the South (Unick & Ciccarone, 2017). Linguistic analysis may provide useful insight into the unique challenges involved in developing responses to an opioid market heavily influenced by illicit drug traffic versus one driven by trade in prescription medications. Similarly, the emergence of online drug purchasing as a unique characteristic of the western Census Bureau divisions may provide key insight into opioid source control and strategies employed by illicit opioid manufacturers and distributors (Popper, 2017; Gabler & Harris, 2017).
Topics Correlated with County- and State-Level Opioid Overdose Death Rates
Our study also demonstrated that linguistic topics related to opioids are significantly correlated with opioid overdose death rates at the county- and state-level. This finding adds to the body of evidence showing that linguistic themes from social media data, including Twitter, can be significantly correlated with healthcare outcomes in specific populations. Other studies have demonstrated the utility of Twitter data for disease prediction and surveillance (Woo, et al., 2017; Gruebner, et al., 2017; Marques-Toledo, et al., 2017; Gabler & Harris, 2017) and characterization of discussion about specific health conditions and interventions (Glowacki, et al., 2017; Dredze, et al., 2017).
In the case of the opioid epidemic, linguistic topics from Twitter could potentially be used to identify opportunities for targeted intervention in different populations or geographic areas. Twitter data may also have potential as a surveillance tool for identification of counties at imminent risk for increase in opioid overdose deaths, for example, in the case of an influx of potent synthetic opioids like fentanyl or carfentanyl. Recently, rapid changes in the opioid market due to the influx of synthetic opioids have led to large spikes in opioid overdose death rates in specific geographic areas (Deutsch, 2016; Katz, 2017; Seelye, 2016). The potential for Twitter to be used as a surveillance tool for the identification of at-risk areas prior to a resultant increase in overdose deaths merits further study (Slavova, et al., 2017; Geletsky & Davis, 2017).
Limitations
The use of Twitter data has some inherent limitations. Surveillance potential of Twitter data depends on a sufficient tweet volume to generate signal and compensate for noise. Of the 39,370,929,538 tweets in the random sample, 37,591,877,163 could not be geolocated, resulting in geographic areas without sufficient data to generate opioid-related topics, especially at the county-level. Only the geocoded sample was searched for opioid-related language. Twitter users do not comprise a representative sample of the US. Tweets about opioids may not be made by the individuals using them, so analysis of Twitter content may reflect public perspective rather than the language of individuals who use opioids. Non-geocoded tweets excluded from analysis may also have differed from those that were geocoded. Further examination of methods that can be used to assess, predict, and survey opioid-related outcomes with greater geographic specificity are needed.
Conclusions
Our study shows that linguistic themes from Twitter are significantly correlated with Census Bureau divisions and with county- and state-level opioid overdose death rates. Content of opioid-related topics from Twitter may offer important insight into the drivers and consequences of opioid misuse in different areas. This information could contribute valuable context for policy decisions and be used to identify areas at higher risk for opioid overdose. Additional studies assessing how linguistic themes on Twitter and other social media platforms are related to opioid outcome measures and geographic differences in patterns of opioid misuse could enhance the potential of social media platforms as a surveillance and assessment tool.
Supplementary Material
Acknowledgments
National Institute on Drug Abuse (P30DA040500)
Funding
This project is funded, in part, under a grant with the Pennsylvania Department of Health. The Department specifically disclaims responsibility for anyanalyses, interpretations or conclusions.
Footnotes
Disclosures
None
References
- Association for Computational Linguistics. (2012, July 10). Proceeding of the system demonstrations. Retrieved from http://www.anthology.aclweb.org/P/P12/P12-3.pdf#page=37
- Beletsky L, Davis CS (2017). Today’s fentanyl crisis: Prohibition’s Iron Law, revisited. Int J Drug Policy, 46:156–159. [DOI] [PubMed] [Google Scholar]
- Blanco C, Alderson D, Ogburn E, et al. (2007). Changes in the prevalence of non-medical prescription drug use and drug use disorders in the United States: 1991–1992 and 2001–2002. Drug Alcohol Depend, 90(2–3):252–260. [DOI] [PubMed] [Google Scholar]
- Blei DM, Franks K, Jordan MI, Mian IS (2006). Statistical modeling of biomedical corpora: mining the Caenorhabditis Genetic Center Bibliography for genes related to life span. BMC Bioinformatics, 7:250. [DOI] [PMC free article] [PubMed] [Google Scholar]
- Centers for Disease Control and Prevention. (2014). Opioid painkiller prescribing infographic . Retrieved from https://www.cdc.gov/vitalsigns/opioid-prescribing/infographic.html
- Centers for Disease Control and Prevention. (2016a, December 16). Drug overdose death data . Retrieved from https://www.cdc.gov/drugoverdose/data/statedeaths.html
- Centers for Disease Control and Prevention (2016b, December 20). Prescribing data. Retrieved from https://www.cdc.gov/drugoverdose/data/prescribing.html
- Centers for Disease Control and Prevention. (2017). Wide-ranging online data for epidemiologic research (WONDER). Retrieved from https://wonder.cdc.gov
- Deutsch K (2016, December 28). Fentanyl outpaces heroin as deadliest drug on Long Island. New York Times. Retrieved from https://www.nytimes.com/2016/12/28/nyregion/fentanyl-epidemic-long-island.html [Google Scholar]
- Dredze M, Wood-Doughty Z, Quinn SC, Broniatowski DA (2017). Vaccine opponents’ use of Twitter during the 2016 US presidential election: implications for practice and policy . Vaccine. [DOI] [PubMed] [Google Scholar]
- Gabler E, Harris R (2017, July 20). On Reddit, intimate glimpses of addicts in thrall to opioids. New York Times. Retrieved from https://www.nytimes.com/2017/07/20/us/opioid-reddit.html [Google Scholar]
- Gilson AM, Ryan KM, Joranson DE, Dahl JL (2004). A reassessment of trends in the medical use and abuse of opioid analgesics and implications for diversion control: 1997–2002. J Pain Symptom Manage, 28(2):176–188. [DOI] [PubMed] [Google Scholar]
- Glowacki EM, Glowacki JB, Wilcox GB (2017). A text-mining analysis of the public’s reactions to the opioid crisis. Subt Abus, 19:0. [DOI] [PubMed] [Google Scholar]
- Gruebner O, Lowe SR, Sykora M, Shankardass K, Subramanian SV, Galea S (2017). A novel surveillance approach for disaster mental health. PLoS One, 12(7):e0181233. [DOI] [PMC free article] [PubMed] [Google Scholar]
- Guntuju SC, Yaden DB, Kern ML, Ungar LH, Eichstaedt JC (2017). Detecting depression and mental illness on social media: an integrative review. Current Opinion in Behavioral Sciences, 18:43–49. [Google Scholar]
- Joranson DE, Ryan KM, Gilson AM, Dahl JL (2000). Trends of medical use and abuse of opioid analgesics. JAMA, 283(13):1710–1714. [DOI] [PubMed] [Google Scholar]
- Katz J (2017, June 5). Drug deaths in America are rising faster than ever. New York Times. Retrieved from https://www.nytimes.com/interactive/2017/06/05/upshot/opioid-epidemic-drug-overdose-deaths-are-rising-faster-than-ever.html [Google Scholar]
- Keyes KM, Cerda M, Brady JE, Havens JR, Galea S (2014). Understanding the rural-urban differences in nonmedical prescription opioid use and abuse in the United States. AJPH, 104(2):e52-e59. [DOI] [PMC free article] [PubMed] [Google Scholar]
- Marques-Toledo CA, Degener CM, Vinhal L, Coelho G, Meira W, Codeco CT, Teixeira MM (2017). Dengue prediction by the web: Tweets are a useful tool for estimating and forecasting Dengue at county and city level. PLoS Negl Trop Dis, 11(7):e0005729. [DOI] [PMC free article] [PubMed] [Google Scholar]
- Monroe BL, Colaresi MP, & Quinn KM (2008). Fightin’ words: Lexical feature selection and evaluation for identifying the content of political conflict. Political Analysis, 16(4), 372–403. [Google Scholar]
- National Alliance for Model State Drug Laws. (2016a). Overview of state pain management and prescribing policies. Charlottesville, VA: National Alliance for Model State Drug Laws. [Google Scholar]
- National Alliance for Model State Drug Laws (2016b). Compilation of prescription monitoring program maps: Manchester, IA: National Alliance for Model State Drug Laws. [Google Scholar]
- National Institute of Standards and Technology (1987). Federal Information Processing Standards Publication 5–2 . Gaithersburg, MD: United States Department of Commerce. [Google Scholar]
- Paulozzi LJ (2006). Opioid analgesic involvement in drug abuse deaths in American metropolitan areas. Am J Public Health, 96(10):1755–1757. [DOI] [PMC free article] [PubMed] [Google Scholar]
- Paulozzi J, Budnitz DS, Xi Y (2006). Increasing deaths from opioid analgesics in the United States. Pharmacoepidemiol Drug Saf, 15(9):618–627. [DOI] [PubMed] [Google Scholar]
- Paulozzi LJ, Ryan GW (2006). Opioid analgesics and rats of fatal drug poisoning in the United States. Am J Prev Med, 311(6):506–511. [DOI] [PubMed] [Google Scholar]
- Popper N (2017, June 10). Opioid dealers embrace the dark web to send deadly drugs by mail. New York Times; Retrieved from https://www.nytimes.com/2017/06/10/business/dealbook/opioid-dark-web-drug-overdose.html [Google Scholar]
- Preotiuc-Pietro D, Samangooei S, Cohn T, Gibbins N, & Niranjan M (2012). Trendminer: An architecture for real time analysis of social media text. [Google Scholar]
- Schwartz HA, Eichstaedt JC, Kern ML, et al. (2013a). Characterizing geographic variation in well-being using tweets . Boston, MA: Proceedings of the Seventh International AAAI Conference on Weblogs and Social Media (ICWSM). [Google Scholar]
- Schwartz HA, Eichstaedt JC, Kern ML, et al. (2013b). Personality, gender, and age in the language of social media: The open-vocabulary approach. PloS One, 8(9), e73791. [DOI] [PMC free article] [PubMed] [Google Scholar]
- Seelye KQ (2016, March 25). Heroin epidemic is yielding to deadlier cousin: fentanyl. New York Times; Retrieved from https://www.nytimes.com/2016/03/26/us/heroin-fentanyl.html [Google Scholar]
- Sinnenberg L, DiSilvestro CL, Mancheno C, et al. (2016). Twitter as a potential data source for cardiovascular disease research. JAMA Cardiology, 1(9):1032–1036. [DOI] [PMC free article] [PubMed] [Google Scholar]
- Slavova S, Costich JF, Bunn TL, et al. (2017). Heroin and fentanyl overdoses in Kentucky: epidemiology and surveillance. Int J Drug Policy, 46:120–129. [DOI] [PubMed] [Google Scholar]
- Smith RJ, Crutchley P, Schwartz HA, Ungar L, Shofer F, Padrez KA, Merchant RM (2017). Variations in Facebook posting patterns across validated patient health conditions: a prospective cohort study. Journal of Medical Internet Research, 19(1):e7. [DOI] [PMC free article] [PubMed] [Google Scholar]
- Twitter Inc. (2017). New user FAQs. Retrieved from https://support.Twitter.com/articles/13920
- Unick GJ, Ciccarone D (2017). US regional and demographic differences in prescription opioid and heroin-related overdose hospitalizations. Int J Drug Policy, 46:112–119. [DOI] [PMC free article] [PubMed] [Google Scholar]
- Wong CA, Sap M, Schwartz A, Town R, Baker T, Ungar L, Merchant RM (2015). Twitter sentiment predicts Affordable Care Act marketplace enrollment. Journal of Medical Internet Research, 17(2):e51. [DOI] [PMC free article] [PubMed] [Google Scholar]
- Woo H, Sung CH, Shim E, Lee JK, Lee K, Song G, Cho Y (2017). Identification of keywords from Twitter and web blog posts to detect influence epidemics in Korea. Disaster Med Public Health Prep, 31:1–8. [DOI] [PubMed] [Google Scholar]
- Zacny J, Bigelow G, Compton P, Foley K, Iguchi M, Annerud C (2003). College on problems of drug dependence taskforce on prescription opioid non-medical use and abuse: position statement. Drug Alcohol Depend, 69(3):215–232. [DOI] [PubMed] [Google Scholar]
Associated Data
This section collects any data citations, data availability statements, or supplementary materials included in this article.