Abstract
MicroRNA (miRNA) expression profiles hold promise as biomarkers for diagnostics and prognosis of complex diseases. Herein, we report a super-resolution fluorescence imaging-based digital profiling method for specific, sensitive, and multiplexed detection of miRNAs. In particular, we applied the DNA-PAINT (point accumulation for imaging in nanoscale topography) method to implement a super-resolution geometric barcoding scheme for multiplexed single-molecule miRNA capture and digital counting. Using synthetic DNA nanostructures as a programmable miRNA capture nano-array, we demonstrated high-specificity (single nucleotide mismatch discrimination), multiplexed (8-plex, 2 panels), and sensitive measurements on synthetic miRNA samples, as well as applied one 8-plex panel to measure endogenous miRNAs levels in total RNA extract from HeLa cells.
Keywords: DNA nanotechnology, DNA-PAINT, microRNA, multiplexing, super-resolution imaging
MicroRNAs (miRNAs) have recently emerged as stable, disease-specific biomarkers useful for diagnostics and prognosis of complex diseases including cancer.[1] To this end, the ability of specific, sensitive, and multiplexed detection and quantitation of various clinically relevant miRNA levels is critical.[2] Standard assay methods based on polymerase chain reaction provide high sensitivity and sequence detection specificity but are limited in multiplexing power.[2a,3] Next-generation sequencing based methods, although providing high multiplexing capability, suffer from miRNA sequence-specific detection bias and lack of absolute quantification.[2a,b,4] Microarrays, and other amplification-free detection methods based on direct hybridization of miRNAs onto a set of complementary probe sequences, are typically limited by the thermodynamics of probe hybridization, and thus allow limited discrimination between closely related miRNA sequences.[2b,5] This limit in discrimination power is especially prominent in multiplexed assays because of the presence of many sample and probe sequences with varying thermodynamic properties.[2a,6] Recently, a single-molecule microscopy method, based on the principle of repetitive probe binding, has been demonstrated to achieve simultaneously high detection sensitivity and sequence specificity;[7] however, without an effective barcoding strategy, this method has only been performed on a single miRNA target at a time.
Herein, we present a multiplexed and highly sequence-specific method for miRNA profiling by combining the principle of repetitive probe binding[8] and DNA nanostructure-based super-resolution geometric barcoding [9] The programmability of our custom-shaped DNA nanostructure and its precise positioning of miRNA capturing probes effectively allow us to partition a single probe anchoring surface into multiple separable sub-areas, in a nano-array format, thus allowing a high degree of multiplexed miRNA capture and detection. Unlike methods based on spectrally separable fluorophores or plasmonic interactions[10] our method is not limited by the number of spectrally separable probe species and could potentially combine the advantages of a highly sensitive and specific single-molecule assay[7] with a high degree of multiplexing capability (> 100 ×).[11]
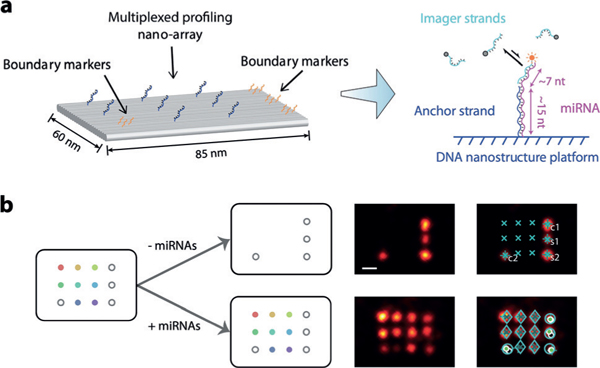
We implemented geometric barcoding by using DNA origami nanostructures[9a] immobilized on a glass surface as multiplexed profiling nano-arrays and resolving the pre-patterned sites on DNA origamis through DNA-PAINT, a super-resolution fluorescence microscopy technique that has been demonstrated with imaging resolution down to less than 5 nm on densely packed DNA nanostructures (Figure 1a).[9c,11] To detect miRNA targets, we functionalized DNA origami nanostructures with anchor strands partially complementary (13–17 nt) to the target miRNAs, which specifically capture and immobilize them on surface. The captured miRNA strand then displays a single-stranded region that serves as the docking site for DNA-PAINT imaging through transient hybridization of fluorophore-labeled complementary imager strands (Figure 1a). Geometric barcoding is based on super-resolution imaging of the pre-defined asymmetric pattern formed by boundary markers, which defines the position of individual anchor sites in each immobilized DNA origami nano-array, and the identity of their respective miRNA targets. Hundreds of uniquely addressable staple strands in the DNA origami enable nanometer-precision molecular patterning with custom- defined geometry, which can be visualized and identified by DNA-PAINT imaging.
Figure 1.

Principle of super-resolution geometric barcoding. a) Schematic of DNA nanostructures for super-resolution geometric barcoding. Immobilized single-molecule miRNA targets anchored on a DNA origami nano-array display single-stranded docking sites for DNA- PAINT super-resolution fluorescence microscopy readout, with repeated transient hybridization of imager strands. b) Left, schematic of DNA origami nanostructures for the 8-plex assay, in which each open gray circle represents a staple strand functionalized as a boundary marker and rainbow-colored dots represent anchor strands for different miRNA targets. Right, representative DNA-PAINT super-resolution images, pre-incubation (top) and post-incubation (bottom), without (left) and with (right) software-automated barcoding and alignment marks. Scale bar = 20 nm.
In this work, we designed a square lattice pattern with 20 nm spacing on a two-dimensional, rectangular DNA origami as our nano-array to implement the multiplexing strategy; the pattern consists of four boundary markers and eight anchor strands, allowing simultaneous identification and quantification of eight different miRNA species (Figure 1b and Figure S1). Higher multiplexing capability can be achieved by using larger nanostructures (e.g., DNA tiles and bricks[11a,b]) as nano-arrays or reducing the pattern spacing; alternatively, by using combinatorial designs of boundary markers as barcodes, a much higher multiplexing capacity could be afforded. In the present work, we selected 16 human miRNAs that are abnormally expressed in multiple cancer types as demonstration targets (Table S1),[1,2c] which are separated into two panels of 8-plex assays.
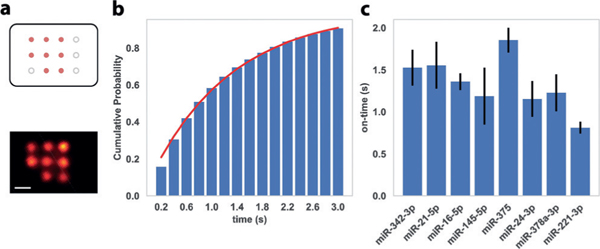
To satisfy the technical requirements for DNA-PAINT,[9c] we first evaluated the blinking kinetics for individual miRNA targets. In each test, we designed a test DNA origami nanostructure with eight anchor sites that are functionalized with the same anchor strand, all capturing the same miRNA target with high efficiency and specificity (Figure 2a). The self-assembled DNA origami nano-arrays were attached to the glass slide surface through biotin-streptavidin linkages (Supporting Information, Figure S2), followed by incubation with a high concentration (1 nM) of the corresponding target miRNA for 10 min at room temperature; DNA-PAINT was performed in the presence of a cy3b-labeled imager strand complementary to the exposed single-stranded region of the target miRNA sequence. We estimated the miRNA capture efficiency by counting the number of observed targets on the nano-arrays and characterized single-molecule blinking on-time by fitting the histogram of blinking-event lengths represented as a cumulative distribution function of exponential distribution (, Figure 2b).[9c,11] To ensure suitable blinking kinetics for high-resolution DNA-PAINT imaging (ideal blinking on-time in the range of 0.5 s-2.5 s), we designed and tested various anchor strand and imager strand designs of different lengths and hybridization positions on the target miRNA and measured their individual capture efficiency and blinking kinetics. In particular, we tested the dependence of blinking on-time on the length and GC-content of the duplex formed by miRNA and imager strand, as well as the base-stacking between the 3’-end of the anchor strand and 5’-end of the imager strand, when bridged by the target miRNA molecule. We noticed that the presence of this stacking interaction significantly increased the blinking on-time, giving us an extra degree of design freedom, also suggesting our system is potentially useful for single-molecule studies of nucleic acid base-stacking interactions. For each miRNA, we chose a combination of anchor strand and imager strand sequences, which enables both stable capture of miRNA target and suitable blinking kinetics for high-resolution DNA-PAINT imaging (Figure 2c and the Supporting Information, Figure S3 and Tables S4-S6).
Figure 2.

a) Top, schematic of DNA origami nano-array for blinking kinetics characterization, in which orange dots represent anchor sites with identical miRNA capture sequences and black circles represent boundary markers (not imaged in this experiment). Bottom, representative super-resolution image with a single miRNA species. b) Representative histogram (cumulative distribution function, CDF) of blinking event lengths. Red line represents fit to the exponential distribution for the estimation of blinking on-time. c) Blinking on-times for the 8 miRNA targets in the 8-plex assay, measured with optimized combinations of anchor strands and imager strands. Error bars represent the standard deviations from 3 independent experiments. Scale bar = 20 nm.
We then designed a new nano-array pattern with eight distinct anchor strands, each optimized with capture efficiency and DNA-PAINT blinking on-time for a different target miRNA, and tested the multiplexing capability of our method. Our multiplexed miRNA assay was performed in three steps. First, we took a pre-incubation super-resolution image of the immobilized, empty DNA nano-arrays with boundary markers only by using the marker-specific imager strand. Next, we incubated the origami samples with target miRNAs (3–300 pM) for 30–90 min. Finally, we took a post-incubation super-resolution image using a combination of imager strands for both boundary markers and eight target miRNAs, allowing visualization of both the boundary markers and all miRNAs captured by anchor strands on the DNA nano-arrays (Figure 1b). To measure the number of miRNA strands captured on our DNA origami platforms, we compared the position and orientation of the super-resolution imaged boundary markers on each DNA origami structure in the pre-incubation and post-incubation images. After image alignment based on the matched marker positions, we measured the number of captured miRNA strands for each target by counting the number of visualized points at their specific anchor sites, on all origami nano-arrays. We normalized the counts by the total number of valid DNA origami structures for quantification (we will refer to it as normalized count hereafter). In a typical experiment, a total of 1000–1500 DNA origami structures passed our quality control criteria, within a circa 40 μm x 40 μm field of view. (see the Supporting Information, Section 1.6 for details).
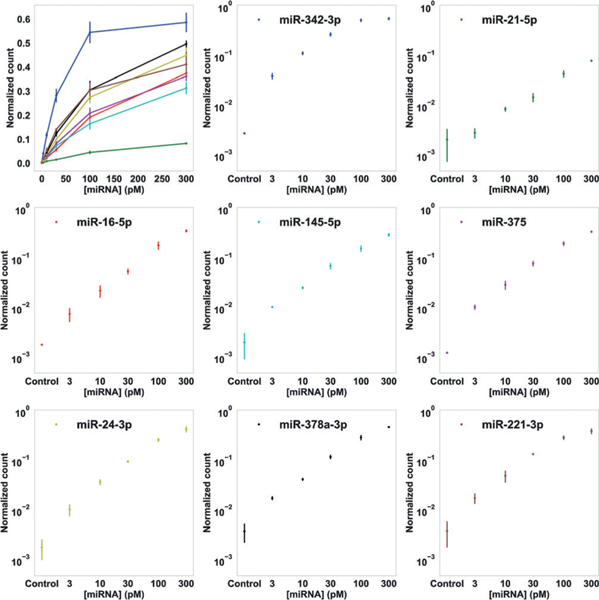
We tested the effect on capture efficiency and normalized counts with different miRNA incubation time (30, 60, 90 min), and then chose 90 min as the standard incubation time for the following studies, as it maximizes the capture efficiency for reliable quantification (Figure S5). The observed overall capture efficiency is likely limited by both origami self-assembly defects and miRNA sequence-dependent anchor-binding stability. We then measured the calibration curves of the normalized counts with target miRNA concentrations ranging from 3 to 300 pM for each miRNA target in the context of multiplexed assay (Figure 3). Representative images of DNA origami grids at various miRNA concentrations are shown in Figure S4. As expected, we observed higher normalized counts for higher concentrations of miRNAs. Furthermore, the logarithm of target concentration showed linear correlation with the logarithm of the normalized count for all 16 miRNAs used in the two groups of multiplexed assays (Figure 3 and Figure S6). We estimated the theoretical limit of detection (LoD) based on the measured normalized counts of the negative control samples (owing to occasional origami distortions, poor imaging quality, or occasional non-specific probe binding events), converted to absolute concentration using the linear fits. The LoDs of all 16 miRNAs tested in our experiments ranged from 100 fM to 7 pM without further optimizations (Table S8). We note that, even higher capture and detection sensitivity could be achieved with more stable anchor strands, for example, using locked nucleic acid (LNA) strands.[7,12]
Figure 3.

8-plex miRNA profiling with super-resolution geometric bar-coding and DNA-PAINT digital counting. Normalized counts (number of observed single-molecule miRNA targets divided by number of total valid DNA origami nano-arrays) for 8 miRNA targets, as functions of sample miRNA concentrations, are shown in linear (top left) and logarithmic scales (8 separate plots). Error bars represent standard deviations from 3 independent experiments.
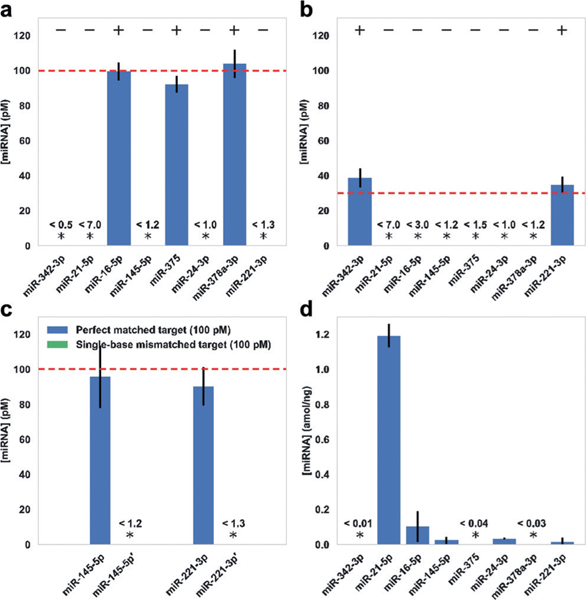
To investigate the miRNA capture and detection specificity of our method, we tested samples containing different subset combinations of target miRNAs arbitrarily chosen from the first group of eight miRNAs, with arbitrarily chosen concentrations (100 pM and 30 pM). The test was performed in the presence of all miRNA capture strands and all miRNA imager strands. We observed expected levels of signals for the on-target miRNAs, with background-level signal for off-target miRNA species, showing that our nano-array system can specifically capture and detect target miRNAs with negligible crosstalk between different miRNA species (Figure 4a,b and Figure S7).
Figure 4.

a,b) Multiplexed detection of arbitrarily chosen subsets of miRNA targets at a) 100 pM and b) 30 pM. +/— indicate the presence/ absence of target miRNAs in the chosen subsets, out of the 8-plex panel. c) High-specificity discrimination between synthetic miRNA sequences with a single-base mismatch, on two groups of test targets. Targets with single-base mismatches are indicated with apostrophes. d) 8-plex miRNA profiling in total RNA extract from HeLa cells. In all experiments, absolute sample concentrations were calculated from measured normalized counts and the calibration curves (Figure 3). Stars indicate concentrations below LoD, and the values of LoD are shown above. Dashed lines indicate expected miRNA concentrations. Error bars represent standard deviations from 3 independent experiments. Plots of normalized counts for these experiments are shown in Figures S7 and S8.
MiRNAs with single-base mismatches or length heterogeneity have different gene regulatory effects and clinical roles;[1c,2b] however, they are difficult to detect specifically with direct hybridization-based methods.[2a,6] To further investigate the specificity of our method in detecting miRNAs with highly similar sequences, we performed two groups of tests on synthetic miRNA sequences with a single-base mismatch (see Table S1 for sequence details). In both cases, we observed an expected level of signal from the correct target miRNA, while only background-level counts were observed for the single-base-mismatched target (Figure 4c and Figure S8). These results demonstrated high specificity for miRNA detection of our method, against both different miRNAs and single-base-mismatched miRNAs.
Finally, we tested our method for miRNA detection from HeLa cell extracts. We first prepared total RNA extracts from HeLa cells (at 400 ng μL−1), then diluted the sample with imaging buffer (to 40 ng μL−1) for single-molecule capture and quantification. We performed the test on the panel of eight miRNAs shown above. Out of the eight miRNAs in our test, five showed concentrations above our system’s LoD. We observed the highest expression level for miR-21 (1.2 ± 0.1 amolng−1), followed by miR-16, miR-145, miR-24, and miR-221; the other three miRNAs showed concentrations below LoD (Figure 4d and Figure S8). These measurements were consistent with previous reports and further confirmed the specific capture and multiplexed, accurate quantitation ability of our method (Figure S9).[10,14]
In summary, we have developed a super-resolution geometric barcoding method for multiplexed detection and quantitation of miRNAs by direct single-molecule detection and super-resolution geometric barcoding that achieves high detection specificity and sensitivity. Our method uses programmable DNA origami nanostructures with pre-designed nano-array patterns for multiplexed capture, and the high-sensitivity DNA-PAINT super-resolution method for amplification-free, single-molecule microscopy readout. In particular, we used the principle of repetitive binding for sensitive discrimination between closely related miRNA sequences. By effectively partitioning the space into separate sub-compartments for each miRNA species, we demonstrated multiplexed measurements of two panels of eight miRNA species each, using a single fluorescent dye and the same optical path.
In a sense, we have developed a nanoscale version of the microarray-based miRNA detection method, implemented on an optically super-resolved synthetic nano-array. Compared with microarray-based miRNA detection methods, our super-resolved digital counting method has two advantages, sequence-specific miRNA detection (especially, discrimination between single-nucleotide-mismatched targets) and accurate quantification of miRNA concentration by single-molecule digital counting.
Although only 8-plex simultaneous detection and quantification is demonstrated in the current study, a much higher degree of multiplexing could be achieved with our method, for example, by the combination a larger synthetic nano-structure array[11c] or tightly packed capture probes (e.g. packing with ca. 5 nm spacing on the current DNA origami platform would potentially allow ca. 200 × different miRNA species to be captured[9c]) and spectrally multiplexed imaging (e.g. four imaging channels with ca. 25 miRNA-targeting imager probes each would potentially allow ca. 100 x multiplexed imaging). Alternatively, by designing different boundary barcodes for different panels of miRNA targets as barcodes and using the Exchange-PAINT imaging method, a combinatorial multiplexing capacity could be afforded. A higher detection sensitivity could be achieved by using more stable anchor probes, scanning over a larger surface area, using a higher surface density of nanostructures, or more elaborate image analysis to further reduce false positive counts. Our method could potentially provide an accurate and sensitive alternative for highly multiplexed miRNA profiling in both basic science and biotechnological applications.
Supplementary Material
Acknowledgements
We thank S. Saka, B. Beliveau, H. Sasaki, F. Xuan, D. Liu, Y. Wang, N. Gopalkrishnan and J. Silverberg for helpful discussions, and S. Saka for kindly providing experimental materials. This work is supported by a National Institutes of Health (NIH) Director’s New Innovator Award (1DP2OD007292), an NIH Transformative Research Award (lR01EB018659), an NIH grant (5R21HD072481), an Office of Naval Research (ONR) Young Investigator Program Award (N000141110914), ONR grants (N000141612410, N000141010827 and N000141310593), a National Science Foundation (NSF) Faculty Early Career Development Award (CCF1054898), an NSF grant (CCF1162459) and a Wyss Institute for Biologically Engineering Faculty Startup Fund to PY.
Footnotes
Conflict of interest
The authors declare no conflict of interest.
Supporting information and the ORCID identification number(s) for the author(s) of this article can be found under: https://doi.org/10.1002/anie.201807956.
Contributor Information
Weidong Xu, Department of Chemistry and Chemical Biology, Harvard University Cambridge, MA 02138 (USA); Wyss Institute for Biologically Inspired Engineering, Harvard University, Boston, MA 02115 (USA); Department of Systems Biology, Harvard Medical School Boston, MA 02115 (USA).
Peng Yin, Wyss Institute for Biologically Inspired Engineering, Harvard University Boston, MA 02115 (USA) Department of Systems Biology, Harvard Medical School Boston, MA 02115 (USA).
Dr. Mingjie Dai, Wyss Institute for Biologically Inspired Engineering, Harvard University Boston, MA 02115 (USA); Department of Systems Biology, Harvard Medical School Boston, MA 02115 (USA).
References
- [1].a) Hayes J, Peruzzi PP, Lawler S, Trends Mol. Med. 2014, 20, 460–469; [DOI] [PubMed] [Google Scholar]; b) Schwarzenbach H, Nishida N, Calin GA, Pantel K, Nat. Rev. Clin. Oncol. 2014,11,145; [DOI] [PubMed] [Google Scholar]; c) Wang J, Chen J, Sen S, J. Cell. Physiol 2016, 231, 25–30. [DOI] [PMC free article] [PubMed] [Google Scholar]
- [2].a) Dong H, Lei J, Ding L, Wen Y, Ju H, Zhang X, Chem. Rev.113, 6207–6233; [DOI] [PubMed] [Google Scholar]; b) Pritchard CC, Cheng HH, Tewari M, Nat. Rev. Genet. 2012, 13, 358; [DOI] [PMC free article] [PubMed] [Google Scholar]; c) Jarry J, Schadendorf D, Greenwood C, Spatz A, Van Kempen L, Mol. Oncol 8, 819–829. [DOI] [PMC free article] [PubMed] [Google Scholar]
- [3].Kroh EM, Parkin RK, Mitchell PS, Tewari M, Methods 2010, 50, 298–301. [DOI] [PMC free article] [PubMed] [Google Scholar]
- [4].Lu C, Tej SS, Luo S, Haudenschild CD, Meyers BC, Green PJ, Science 2005, 309, 1567–1569. [DOI] [PubMed] [Google Scholar]
- [5].a) Calin GA, Croce CM, Nat. Rev. Cancer 2006, 6, 857; [DOI] [PubMed] [Google Scholar]; b) Li L, Li X, Li L, Wang J, Jin W, Anal. Chim. Acta 2011, 685, 52–57; [DOI] [PubMed] [Google Scholar]; c) Ho S-L, Chan H-M, Ha AW-Y, Wong RN-S, Li H-W, Anal. Chem. 2014, 86, 9880–9886; [DOI] [PubMed] [Google Scholar]; d) Ke Y, Lindsay S, Chang Y, Liu Y, Yan H, Science 2008, 319, 180–183. [DOI] [PubMed] [Google Scholar]
- [6].Zhang DY, Chen SX, Yin P, Nat. Chem. 2012, 4, 208. [DOI] [PMC free article] [PubMed] [Google Scholar]
- [7].Johnson-Buck A, Su X, Giraldez MD, Zhao M, Tewari M, Walter NG, Nat. Biotechnol. 2015, 33, 730–732. [DOI] [PMC free article] [PubMed] [Google Scholar]
- [8].a) Sharonov A, Hochstrasser RM, Proc. Natl. Acad. Sci. USA 2006,103, 18911–18916; [DOI] [PMC free article] [PubMed] [Google Scholar]; b) Jungmann R, Avendano MS, Woehrstein JB, Dai M, Shih WM, Yin P, Nat. Methods 2014,11, 313. [DOI] [PMC free article] [PubMed] [Google Scholar]
- [9].a) Rothemund PW, Nature 2006, 440, 297. [DOI] [PubMed] [Google Scholar]; b) Lin C Jungmann R Leifer AM Li C Levner D Church GM Shih WM Yin P, Nat. Chem 2012, 4, 832. [DOI] [PMC free article] [PubMed] [Google Scholar]; c) Dai MR Jungmann P Yin, Nat. Nanotechnol. 2016,11, 798. [DOI] [PMC free article] [PubMed] [Google Scholar]
- [10].Kim S, Park JE, Hwang W, Seo J, Lee YK, Hwang JH, Nam JM, J. Am. Chem. Soc. 2017,139, 3558–3566. [DOI] [PubMed] [Google Scholar]
- [11].a) Wei B, Dai M, Yin P, Nature 2012, 485, 623. [DOI] [PMC free article] [PubMed] [Google Scholar]; b) Ong LL, Hanikel N, Yaghi OK, Grun C, Strauss MT, Bron P, Lai-Kee-Him J, Schueder F, Wang B, Wang P, Nature 2017, 552, 72. [DOI] [PMC free article] [PubMed] [Google Scholar]; c) Tikhomirov G, Petersen P, Qian L, Nature 2017, 552, 67. [DOI] [PubMed] [Google Scholar]
- [12].Jungmann R, Steinhauer C, Scheible M, Kuzyk A, Tinnefeld P, Simmel FC, Nano Lett. 2010,10, 4756–4761. [DOI] [PubMed] [Google Scholar]
- [13].Valoczi A, Hornyik C, Varga N, Burgyan J, Kauppinen S, Havelda Z, Nucleic Acids Res. 2004, 32, e175–e175. [DOI] [PMC free article] [PubMed] [Google Scholar]
- [14].a) Panwar B, Omenn GS, Guan Y, Bioinformatics 2017, 33, 1554–1560; [DOI] [PMC free article] [PubMed] [Google Scholar]; b) Chen J, Lozach J, Garcia EW, Barnes B, Luo S, Mikoulitch I, Zhou L, Schroth G, Fan J-B, Nucleic Acids Res. 2008, 36, e87–e87; [DOI] [PMC free article] [PubMed] [Google Scholar]; c) Kumar S, Gomez EC, Chalabi-Dchar M, Rong C, Das S, Ugrinova I, Gaume X, Monier K, Mongelard F, Bouvet P, Sci. Rep. 2017, 7, 9017. [DOI] [PMC free article] [PubMed] [Google Scholar]
Associated Data
This section collects any data citations, data availability statements, or supplementary materials included in this article.


