

Abstract
Neurobiological disturbances associated with reward and/or habit learning are theorized to maintain symptoms of anorexia nervosa (AN). Although research has investigated responses in brain regions associated with reward and habit to disorder‐specific cues (e.g., food) and presumed rewards (e.g., money), little is known about the functional organization of the circuits underlying these constructs independent of stimulus. This study aimed to provide initial data on the synchrony of networks associated with reward and habit in AN by comparing resting‐state functional connectivity (RSFC) patterns between AN and healthy control (HC) participants in these circuits and delineating how these patterns relate to symptoms. Using theoretically selected seeds in the nucleus accumbens (NAcc), ventral caudate, and dorsal caudate, reflecting a continuum from reward‐ to habit‐ oriented regions, RSFC patterns were compared between AN restricting subtype (n = 19) and HC (n = 19) participants (cluster threshold: p < .01). Exploratory correlations between RSFC z‐scores and Eating Disorder Examination (EDE) scores, BMI, and illness duration were conducted. The AN group demonstrated lower RSFC between the NAcc and superior frontal gyrus, between the ventral caudate and frontal and posterior regions, and between the dorsal caudate and frontal, temporal, and posterior regions. In the AN group, lower NAcc‐ superior frontal gyrus RSFC correlated with greater EDE Global scores (r = −.58, CI: −.83, −.13). These resting‐state synchrony disruptions of the ventral and dorsal frontostriatal circuits, considered in context of the broader literature, support the utility of further investigating possible reward and habit disturbances supporting symptoms in AN.
Keywords: anorexia nervosa, eating disorder, functional connectivity, habit, resting state fMRI, reward
1. INTRODUCTION
Anorexia nervosa (AN) is a serious psychiatric illness characterized by a remarkable persistence in weight loss activities despite being severely underweight (American Psychiatric Association, 2013). AN is associated with significant morbidity (Mitchell & Crow, 2006) and the highest mortality rate of any mental illness (Crow et al., 2009). Once AN is established, it is often a chronic illness, with typical duration of illness persisting beyond 10 years (Eddy et al. 2017). Remission rates are low (Fichter, Quadflieg, Crosby, & Koch, 2017) and there are limited options for intervention (Berkman et al., 2006). Critically, treatment development efforts for AN have been hindered by an incomplete knowledge of the neurobiological mechanisms that initiate and maintain AN symptoms (Walsh, 2013).
Two neurobiologically informed theories centering on striatal functioning, a reward deficit model (Kaye, Wierenga, Bailer, Simmons, & Bischoff‐Grethe, 2013; Wierenga et al., 2014) and a habit‐centered model (Steinglass & Walsh, 2016; Walsh, 2013), have been proposed to account for the maintenance of AN symptoms. The striatum is functionally organized such that more ventrally located regions, such as the nucleus accumbens (NAcc) and ventral regions of the caudate, demonstrate more limbic connectivity and greater associations with indices of reward responding (Di Martino et al., 2008; Huang et al., 2017). On the other hand, the dorsal regions of the striatum, including the dorsal caudate, are more interconnected with prefrontal regions and implicated in motor and cognitive functions, including habitual responding. The reward deficit model is predicated on the hypothesis that there is widespread dysfunction of the ventral frontostriatal network in AN (Kaye et al., 2013; Wierenga et al., 2014), which results in chronic under‐responding to stimuli that typically engage dopaminergic circuitry, including palatable foods (Brooks et al., 2011; Holsen et al., 2012). This pattern of frontostriatal dysfunction could also result in excessive orientation to the narrow range of cues that manage to engage the networks associated with reward, such illness‐compatible stimuli (e.g., thinness cues; Fladung et al., 2010; Redgrave et al., 2008).
In contrast, the habit‐centered model proposes that AN is most notably characterized by abnormalities in habit learning and associated neural circuitry, especially within the dorsal striatum (Steinglass & Walsh, 2016; Walsh, 2013). This theory overlaps with the reward deficit model in hypothesizing that initial eating disturbances among those who develop AN result from dysfunctions of the ventral striatum, promoting enhanced reward responding to disorder‐specific cues. However, this model further asserts that the over‐training of such reward responses to illness‐compatible stimuli eventually fosters a compulsive reliance on rigid and automatic eating disorder behaviors, independent of momentary dopaminergic responding (Foerde, Steinglass, Shohamy, & Walsh, 2015; Godier & Park, 2014). Thus, the habit‐centered model deviates from the reward deficit model in postulating that, once an individual has fully developed AN, especially after the initial stages of illness (e.g., adolescence, <3–5 years of illness; Broomfield, Stedal, Touyz, & Rhodes, 2017), dysfunctions in dorsal frontostriatal network predominate over those in more ventral, reward‐oriented regions (Godier & Park, 2014; Walsh, 2013).
Several studies of individuals with AN using structural and task‐based functional imaging have found evidence of abnormalities in brain regions associated with reward, such as the NAcc and orbitofrontal cortex (OFC) (Brooks et al., 2011; Frank, Shott, Hagman, & Mittal, 2013; Holsen et al., 2012; Steward et al., 2017), as well as those associated with habit (Bailer et al., 2017; Foerde et al., 2015; Rothemund et al., 2011; Titova, Hjorth, Schiöth, & Brooks, 2013) including the dorsal striatum and dorsolateral prefrontal cortex (Balleine & O'Doherty, 2010). Most of the studies examining functional patterns in circuitry associated with reward and habit learning in AN have examined responses to specific cues, such as those salient to the illness (e.g., food, thin bodies) or stimuli that are typically considered rewarding (e.g., money). Illness‐specific cues provide useful information about neural functioning in disorder‐relevant situations (e.g., eating, body checking). However, they cannot provide information about disturbances that occur outside of these particular contexts, which could represent shared mechanisms with other psychiatric illnesses. Further, although reward tasks using more generalized reinforcers (e.g., money) provide information about functional responses outside of an eating disorder context, they are also impacted by stimulus presentation. This could potentially affect the interpretation of the results if a particular cue is perceived differently across populations (e.g., money is not conceptualized as a compelling reward for those with AN). These considerations underscore the importance of examining the brain networks that underlie reward and habit processing during the resting state as a complement to task‐based designs in order to more fully characterize the organization of these neural circuits.
Resting state functional connectivity (RSFC), which examines the correlation pattern of naturally occurring fluctuations in blood oxygen level dependent signal between brain regions, provides an opportunity to investigate abnormalities in the synchrony of ventral and dorsal frontostriatal networks independent of stimulus presentation. One study has specifically investigated RSFC of the ventral frontostriatal network in AN (Cha et al., 2016). The authors found evidence of NAcc and left medial OFC hyperconnectivity during acute and weight‐restored stages of illness relative to healthy control (HC) subjects, confirming abnormalities of circuitry associated with reward responding in AN. Although this study provided initial evidence supporting RSFC disturbances in the ventral frontostriatal network in AN, no research to our knowledge has been published that has examined the connectivity of striatal regions spanning the ventral to dorsal dimension and their relationship with clinical symptoms in an AN sample. This approach would allow for examination of whether dysfunctions in reward‐ and habit‐oriented brain networks predominate, or characterize different aspects or stages of illness as has been hypothesized (Godier & Park, 2014; Walsh, 2013).
Therefore, in this study we compared RSFC of AN, restricting subtype (AN‐R) and HC groups using a seed‐based approach, spanning across the ventral through dorsal striatum (NAcc, ventral caudate, and dorsal caudate) in order to capture disturbances across the reward to habit continuum. In accordance with the reward deficit model of AN, which hypothesizes under‐functioning of reward‐associated circuitry outside of disorder‐specific contexts (Kaye et al., 2013; Wierenga et al., 2014), we predicted lower connectivity among individuals with AN‐R compared to HC participants within the ventral frontostriatal network. We retained this hypothesis despite preliminary contradicting results from another group (Cha et al., 2016) in order to specifically test a tenant of this theory. In line with the habit‐centered model of AN, we hypothesized hyperconnectivity within dorsal frontostriatal circuitry for AN‐R versus HC participants, potentially signaling an over‐trained habit response system (Steinglass & Walsh, 2016; Walsh, 2013). As an exploratory aim, we examined how RSFC related to salient clinical correlates (i.e., BMI, cognitive eating disorder symptoms, and length of illness). Our over‐arching aim was to further characterize the functional organization of the striatum in AN, and to begin to elucidate the relationship between dysfunctional RSFC and clinical presentation.
2. METHODS AND MATERIALS
2.1. Participants
Participants were 38 females (19 AN‐R, 19 age‐matched HC). Inclusion criteria included: (i) 16–30 years old; and (ii) English fluency. Exclusion criteria included: (i) current substance use disorder, schizophrenia, or bipolar‐I disorder, due to rare occurrence of these issues in AN‐R, reflecting uncommon phenotypes (Ulfvebrand, Birgegård, Norring, Högdahl, & von Hausswolff‐Juhlin, 2015) and the potential to introduce heightened noise to analyses; (ii) history of serious head injuries, neurological disorders, or medical instability; (iii) MRI contraindications; and (iv) pregnant or lactating.
Individuals in the AN‐R group were a heterogeneous outpatient research sample that met DSM‐5 criteria for AN‐R and had a BMI ≤18.5 kg/m2. AN‐R participants were recruited from the community and local eating disorder treatment facilities, and concurrent psychiatric treatments, including medication, were permitted for this group. We chose to restrict subtype and BMI variability to limit heterogeneity in symptom presentation. Evidence suggests that individuals with AN‐R and AN binge eating/purging subtype (AN‐BP) may demonstrate different patterns in reward responding (Fassino et al., 2002). In order to reduce noise within a limited clinical sample, we selected to examine AN‐R as representative of the core psychopathology on AN, since this group has been implicated as a distinct phenotype with less mechanistic overlap with other eating disorders (e.g., bulimia nervosa, binge eating disorder) compared to AN‐BP (Brooks, Rask‐Andersen, Benedict, & Schiöth, 2012; Steward et al., 2017). To otherwise increase the representativeness of the AN‐R group, psychiatric co‐morbidity was permitted outside of the exclusionary disorders. Individuals in the HC group were required to be free from any current Axis‐I disorder or lifetime eating disorder diagnoses and to have a BMI between 20.0 and 24.9 kg/m2. None of the participants in the HC group were taking psychotropic medication.
Study inclusion and exclusion were determined by an extensive screening process, which included an initial phone screen, in‐person diagnostic interviews, and a battery of self‐report questionnaires. AN‐R and HC groups were matched on age, race/ethnicity, and education level, but expectedly differed on all clinical variables (see Table 1). For the AN‐R group, illness duration ranged from 1 to 16 years, with participants reporting, on average, nearly a decade of illness. This research was performed in compliance with the Code of Ethics of the World Medical Association (Declaration of Helsinki) and the standards of the local Institutional Review Board. All participants signed informed consent prior to study procedures.
Table 1.
Demographic and clinical information for anorexia nervosa, restricting subtype (AN‐R) and healthy control (HC) groups
| AN (n = 19) | HC (n = 19) | Test statistic | Effect size | ||
|---|---|---|---|---|---|
| Variable | M (SD) [range] or no. (%) | M (SD) [range] or no. (%) | Wald χ2 (1) | p | d/w |
| Age | 22.32 (3.87) | 22.95 (3.67) | 0.29 | .60 | 0.17 |
| Race/ethnicity (% Caucasian) | 17 (90%) | 18 (95%) | 0.35 | .56 | 0.10 |
| Education (% ≥ some college) | 17 (90%) | 19 (100%) | 0.00 | 1.00 | 0.24 |
| Psychological treatment (% receiving) | 10 (53%) | 0 (0%) | – | – | – |
| Psychotropic medication (% using) | 10 (53%) | 0 (0%) | – | – | – |
| Antidepressant | 10 (53%) | – | – | – | – |
| Anxiolytic | 3 (16%) | – | – | – | – |
| Stimulant | 2 (11%) | – | – | – | – |
| Antipsychotic | 1 (5%) | – | – | – | – |
| Body mass index | 16.98 (1.35) | 22.30 (1.31) | 144.56 | <.001 | 4.11 |
| EDE globala | 3.11 (1.09) | 0.26 (0.23) | 223.99 | <.001 | 3.72 |
| EDE restrainta | 2.98 (1.49) | 0.19 (0.44) | 104.08 | <.001 | 2.61 |
| EDE eating concerna | 2.21 (1.14) | 0.12 (0.42) | 93.22 | <.001 | 2.50 |
| EDE shape concerna | 3.57 (1.49) | 0.43 (0.35) | 133.81 | <.001 | 2.98 |
| EDE weight concerna | 3.66 (1.37) | 0.28 (0.27) | 231.17 | <.001 | 3.58 |
| Duration of illness (years) | 8.00 (3.73) | – | – | – | – |
Note. EDE, eating disorder examination.
2.2. Assessment
2.2.1. Diagnostic information
The overview, eating disorders module (modified to DSM‐5), and substance use disorder module of the Structured Clinical Interview for DSM‐IV Axis‐I Disorders, Patient Edition (First, Spitzer, Gibbon, & Williams, 2002) were used to establish AN‐R and HC eligibility. The SCID‐IV is a semi‐structured interview designed to assess current and lifetime DSM‐IV‐TR Axis‐I disorders.
2.2.2. Clinical correlates
BMI was calculated using weight measured by digital scale and height by stadiometer. The Eating Disorder Examination (EDE; Fairburn, Cooper, & O'Connor, 2008) Global score was used to assess cognitive eating disorder symptoms. Duration of illness for the AN‐R group was retrieved from the eating disorders section of the SCID‐IV.
2.3. Imaging data acquisition
Participants underwent a 6 min resting‐state functional magnetic resonance imaging (fMRI) scan and were instructed to lie still, keep eyes closed, and stay awake. Images were collected using a 3 Tesla Siemens TIM Trio scanner with a 32‐channel radio‐frequency head coil. Sequence parameters: multiband echo‐planar imaging 260 volumes, repetition time (TR) = 1,320 ms, echo time (TE) = 30 ms, flip angle = 90°, FOV = 212 mm; voxel size = 2 × 2 × 2 mm; matrix = 106 × 106; multiband factor = 4; PE = A > P. A high‐resolution T1‐weighted anatomical image was acquired using a magnetization prepared rapid gradient‐echo sequence. A field map acquisition was collected and used to correct the fMRI data for geometric distortion caused by magnetic field inhomogeneities (Magnetization Prepared Rapid Acquisition GRE: 224 coronal slices; TR = 2,530 ms; TE = 3.65 ms; TI = 1,100 ms; flip angle = 7°; FOV = 256; voxel size = 1 × 1 × 1 mm isotropic; matrix size = 256 × 176).
2.4. fMRI data preprocessing
Preprocessing was conducted using the FEAT program (FMRIB's Software Library [FSL]). The following prestatistics were applied for each subject: first 10 volumes deleted to account for magnetization stabilization, motion correction, correction for geometric distortion, slice‐timing correction, non‐brain removal, spatial smoothing (4‐mm full‐width half‐maximum kernel), grand mean scaling, high‐pass temporal filtering (100 Hz) to remove correlations associated with slow trends scanner noise, and registration of all images to standard space. Probabilistic independent component analysis was conducted for each individual and components were removed that represented noise according characteristics detailed in the MELODIC manual and previous methodological reports (Kelly et al., 2010). AN‐R and HC groups did not differ along the six motion parameters that characterize translations and rotations along x‐, y‐, and z‐ dimensions, t(36) = −.36 to −1.14, ps = .26 to .72.
Image registrations were conducted with FMRIB's Linear Image Registration Tool, which uses an automated linear (affine) registration (Jenkinson, Bannister, Brady, & Smith, 2002). Each participant's preprocessed and denoised data was registered to the participant's high‐resolution T1‐weighted structural image (with 6° of freedom), generating a transformation matrix file. The high‐resolution T1‐weighted structural image was then registered to the standard Montreal Neurological Institute (MNI‐152) brain (with 12° of freedom), generating a second transformation matrix file. These two transformation matrices were used to register each individual's preprocessed and denoised data to MNI standard space prior to group analysis.
2.5. Region of interest (ROI) generation
Figure 1 presents a visual representation of NAcc, ventral caudate, and dorsal caudate seed maps with MNI coordinates. Time series were extracted from each of these seeds for each participant.
Figure 1.
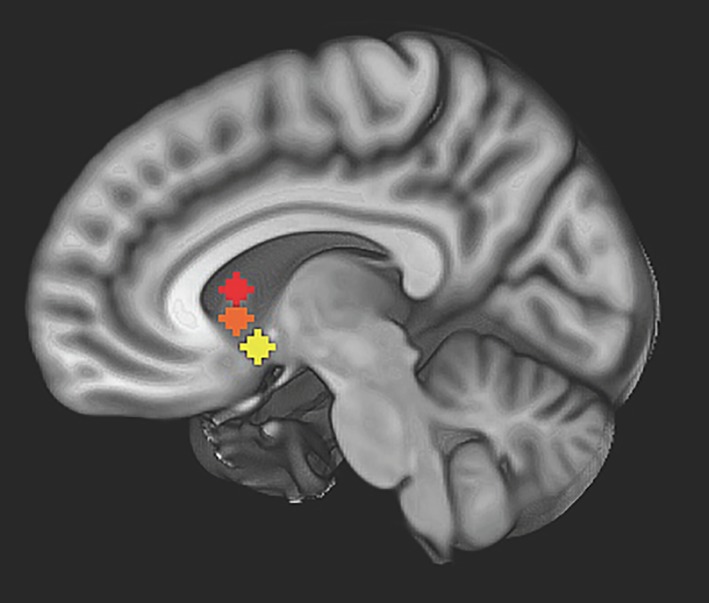
Nucleus accumbens (NAcc), ventral caudate, and dorsal caudate seed map: image depicts non‐overlapping NAcc (yellow) (right: x = 12, y = 10, z = −8; left: x = −10, y = 10, z = −8, not pictured), ventral caudate (orange) (bilateral, x = ±10, y = 15, z = 0), and dorsal caudate (red) (bilateral, x = ±13, y = 15, z = 9) seeds used to examine strength of resting state functional connectivity overlaid on Montreal neurological institute (MNI) brain [Color figure can be viewed at http://wileyonlinelibrary.com]
2.6. Resting state individual‐level analysis
For each participant and ROI (bilateral NAcc, ventral caudate, and dorsal caudate), a multiple regression analysis (3dfimþ, AFNI) was performed on the denoised data between the extracted average time‐series from each ROI and all voxels in the brain. This analysis generated a map with a correlation coefficient (r) for each voxel, for each individual, for each seed. Bilateral seeds were combined for each ROI (NAcc, ventral caudate, and dorsal caudate) to produce correlation maps reflecting connectivity associated with both left and right seeds. Coefficients were transformed to standardized z‐scores (3dcalc, AFNI). All voxels in resulting standardized z‐maps showed the degree of positive or negative correlations with the corresponding averaged time‐series for each ROI for each participant.
2.7. Statistical analysis
2.7.1. Primary analyses: Group differences in RSFC
Group‐level analyses were conducted separately for each ROI using the 3dttest++ in AFNI, with the ‐clustsim option to calculate smoothness of data considering that data distribution is non‐Gaussian. To avoid artificial alpha inflation (Eklund, Nichols, & Knutsson, 2016), Monte Carlo simulations (1,000 iterations) accounted for the full‐width half‐maximum Gaussian filter (6 mm FWHM; 3dFWHMx) and with a connectivity radius of 7.1 mm. The most stringent output (NN = 1 and bi‐sided results) was selected for significant clustering and thresholding. To set the per‐voxel p value threshold at 0.005 and the probability of getting a single noise‐only cluster at <0.01, the cluster size threshold was calculated at 747 voxels (NAcc), 630 voxels (ventral caudate), and 906.5 voxels (dorsal caudate). Clusters that survived correction for multiple comparisons were used as masks from which individual z‐scores were extracted for graphic visualization and correlation analyses. To examine whether medication use affected results, t‐tests were conducted within the AN‐R group to determine whether RSFC z‐scores in ROIs differed according to medication use. In the case that a significant difference was detected, t‐tests examining RSFC differences between AN‐R and HC were repeated accounting for with medication status (yes/no).
2.7.2. Exploratory analysis: RSFC and symptom expression
To investigate the relationship between RSFC patterns and clinical symptoms, average z‐scores clusters that showed significant between‐group differences in functional connectivity related to NAcc and ventral and dorsal caudate seeds were extracted. Separate correlations were conducted for AN‐R and HC groups to examine the relationship between RSFC z‐scores and eating disorder symptoms (EDE Global Score, BMI) for each group. Additionally, correlations between duration of illness and RSFC z‐scores were conducted for the AN‐R group to determine if RSFC were represented differently according to earlier versus later stages of AN. Bootstrapping procedures (1,000 samples, 95% confidence interval) were used in the context of the smaller sample size. All statistical tests were two‐tailed; because of the exploratory nature of these analyses, alpha p < .05 and bootstrapped confidence intervals that did not cross zero were used to determine significance.
3. RESULTS
3.1. Primary analyses: Group differences in reward and habit circuitry RSFC
3.1.1. NAcc seed
For the bilateral NAcc seed, a difference was detected between the AN‐R and HC groups in RSFC with the left superior frontal gyrus (SFG; see Figure 2 and Table 2). The AN‐R group demonstrated lower RSFC between the NAcc and the SFG compared to the HC group. Among individuals with AN‐R, psychotropic medication use was associated with reduced NAcc‐SFG connectivity, t(17) = 2.85, p = .04; however, AN‐R versus HC group differences in NAcc‐SFG RSFC remained significant after controlling for medication use (p = .03).
Figure 2.
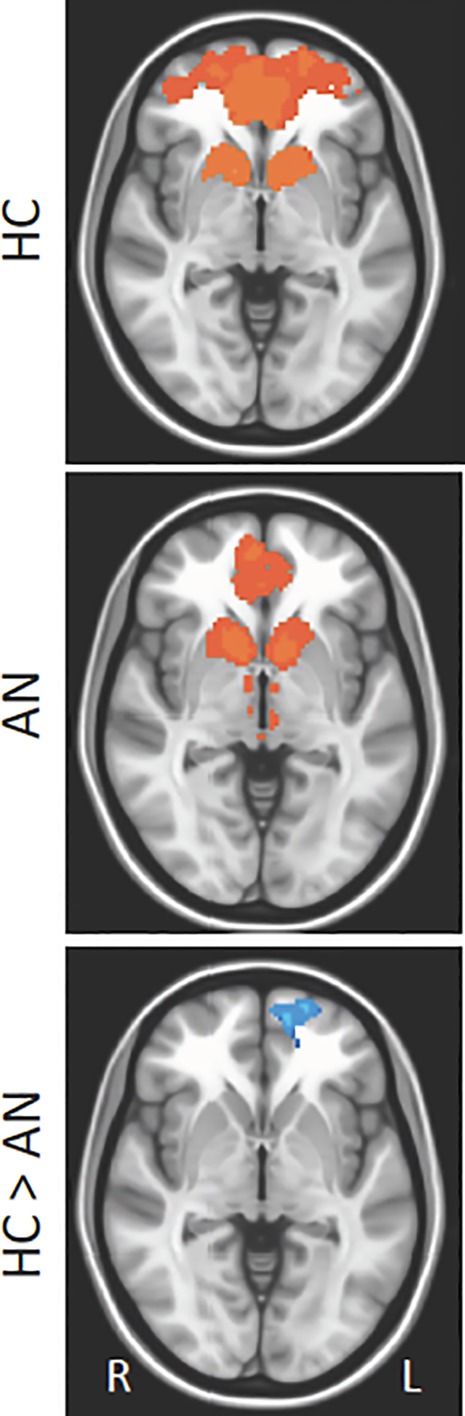
Group differences in resting state functional connectivity (RSFC) from nucleus Accumbens (NAcc) seed: Results showing RSFC between NAcc and left superior frontal gyrus (Brodmann area 10) in healthy control (HC) versus anorexia nervosa (AN) groups. Whole‐brain FC maps showing regions with significant connectivity to the NAcc (p < .01, corrected for multiple comparisons) in HC (first row) and AN (second row) groups. Third row shows whole‐brain independent samples t‐test results in which HC had significantly higher RSFC than AN (p < .01, corrected for multiple comparisons). Functional maps are laid on Montreal neurological institute (MNI) brains in radiological orientation, right (R) to left (L) [Color figure can be viewed at http://wileyonlinelibrary.com]
Table 2.
Significant nodes of resting state functional connectivity for nucleus accumbens, ventral caudate, and dorsal caudate seeds (healthy control > anorexia nervosa, restricting subtype)
| Anatomical location (Brodmann area) | MNI coordinates (mm) | Cluster (voxels) | F | p | |||
|---|---|---|---|---|---|---|---|
| X | Y | Z | |||||
| Nucleus accumbens seed | |||||||
| Frontal | L superior frontal gyrus (BA 10) | 20 | −62 | −6 | 436 | 13.75 | .001 |
| Ventral caudate seed | |||||||
| Frontal | R orbitofrontal cortex (BA 11) | −6 | −38 | −20 | 204 | 11.17 | .002 |
| L precentral gyrus (BA 6) | 34 | 10 | 56 | 240 | 13.21 | .001 | |
| Posterior | L posterior cingulate (BA 29) | 2 | 42 | 16 | 581 | 13.81 | .001 |
| L precuneus (BA 39) | 48 | 72 | 32 | 531 | 13.87 | .001 | |
| R precuneus (BA 39) | −48 | 74 | 38 | 344 | 16.10 | <.001 | |
| L precuneus (BA 7) | 6 | 70 | 34 | 137 | 13.83 | .001 | |
| Dorsal caudate seed | |||||||
| Frontal | R orbitofrontal cortex (BA 11) | −8 | −34 | −16 | 1,197 | 13.99 | .001 |
| L precentral gyrus (BA 6) | 34 | 12 | 56 | 202 | 13.11 | .001 | |
| L superior frontal gyrus (BA 9) | −2 | −54 | 32 | 177 | 12.83 | .001 | |
| Temporal | L middle temporal gyrus (BA 21) | 64 | 22 | −12 | 832 | 13.64 | .001 |
| 64 | 40 | 0 | 216 | 11.58 | .002 | ||
| Basal ganglia | L putamen (BA 13) | 34 | 10 | 56 | 197 | 13.91 | .001 |
| Posterior | L precuneus (BA 31) | 0 | 50 | 40 | 5,497 | 15.73 | <.001 |
| R precuneus (BA 7) | −34 | 76 | 46 | 1,092 | 14.67 | <.001 | |
| R inferior occipital gyrus (BA 17) | −8 | 98 | 10 | 904 | 15.98 | <.001 | |
| R precuneus (BA 5) | −4 | 50 | 64 | 293 | 11.99 | .001 | |
| L precuneus (BA 7) | 10 | 54 | 72 | 102 | 12.15 | .001 | |
Note. Significantly different z‐scores that survived thresholding (p < .005 familywise and p < .01 voxelwise) and clustering to correct for multiple comparisons. BA, Brodmann area; L, left; R, right; MNI, Montreal Neurological institute.
3.1.2. Ventral caudate seed
For the bilateral ventral caudate seed, differences were detected between the AN‐R and HC groups in RSFC with frontal (i.e., OFC, motor cortex) and posterior regions. The AN‐R group demonstrated lower RSFC strength between the ventral caudate and each of these regions (see Figure 3 and Table 2). For individuals with AN‐R, psychotropic medication use was associated with reduced ventral caudate‐posterior connectivity, t(17) = 3.50, p = .003; however, AN‐R versus HC group differences in ventral caudate‐posterior RSFC remained significant after controlling for medication use (p = .04).
Figure 3.
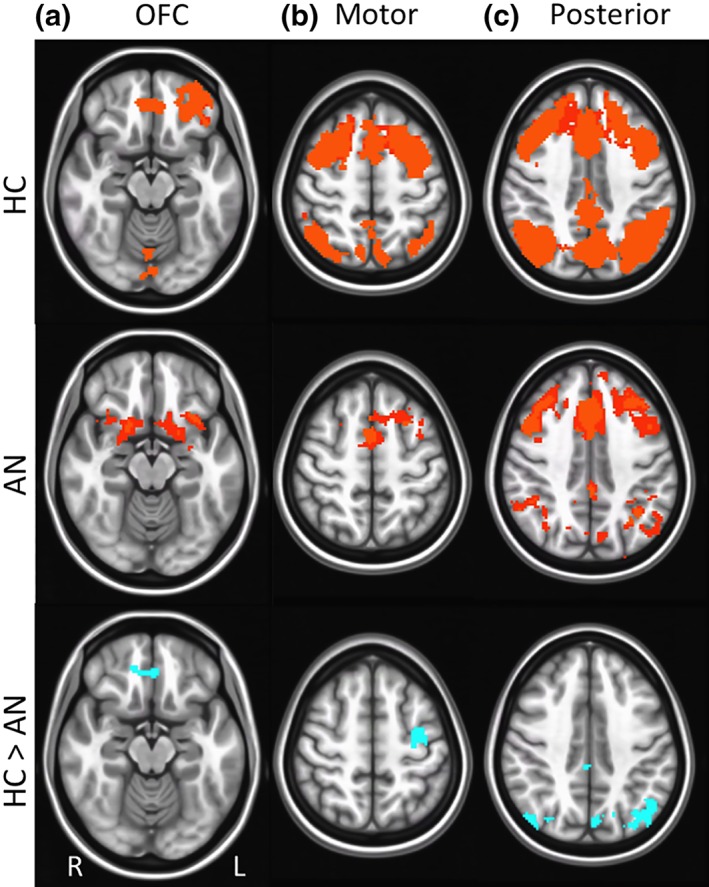
Group differences in resting state functional connectivity (RSFC) from ventral caudate seed: Results showing higher resting state functional connectivity (RSFC) between ventral caudate and: (a) frontal region (orbitofrontal cortex, Brodmann area 11), (b) motor region (precentral gyrus, Brodmann area 6), and (c) posterior regions (posterior cingulate, Brodmann area 29; precuneus, Brodmann areas 7, 30) in healthy control (HC) versus anorexia nervosa (AN) groups. Whole‐brain FC maps showing regions with significant connectivity to ventral caudate (p < .01, corrected for multiple comparisons) in HC (first row) and AN (second row) groups. Third row shows whole‐brain independent samples t‐test results in which HC had significantly higher RSFC than AN (p < .01, corrected for multiple comparisons). Functional maps are laid on Montreal neurological institute (MNI) brains in radiological orientation, right (R) to left (L) [Color figure can be viewed at http://wileyonlinelibrary.com]
3.1.3. Dorsal caudate seed
For the bilateral dorsal caudate seed, differences were detected between the AN‐R and HC groups in RSFC with frontal (i.e., OFC, SFG, motor cortex), temporal, basal ganglia (i.e., putamen), and posterior (i.e., precuneus, visual cortex) regions. The AN‐R group demonstrated lower RSFC strength between the dorsal caudate and each of these regions (see Figure 4 and Table 2). For AN‐R participants, psychotropic medication use was associated with reduced dorsal caudate connectivity with frontal, t(17) = 2.23, p = .04, basal ganglia, t(17) = 2.67, p = .02, and posterior, t(17) = 2.34, p = .03, regions. However, AN‐R versus HC group differences in dorsal caudate RSFC remained significant after controlling for medication use (ps = .03).
Figure 4.
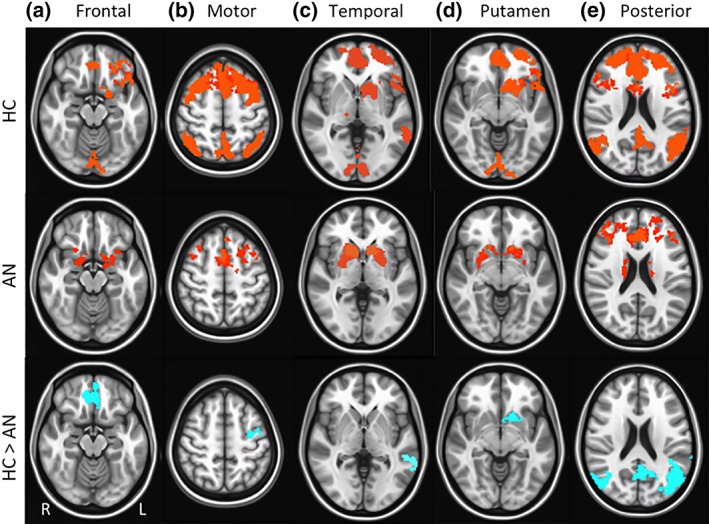
Group differences in resting state functional connectivity (RSFC) from dorsal caudate seed: Results showing higher resting state functional connectivity (RSFC) between dorsal caudate and: (a) frontal regions (orbitofrontal cortex, Brodmann area 11; superior frontal gyrus, Brodmann area 9), (b) motor region (precentral gyrus, Brodmann area 6), (c) temporal regions (middle temporal gyrus, Brodmann area 21), (d) basal ganglia region (putamen, Brodmann area 13), and (e) posterior regions (precuneus, Brodmann areas 5, 7; inferior occipital gyrus, Brodmann area 17) in healthy control (HC) versus anorexia nervosa (AN) groups. Whole‐brain FC maps showing regions with significant connectivity to dorsal caudate (p < .01, corrected for multiple comparisons) in HC (first row) and AN (second row) groups. Third row shows whole‐brain independent samples t‐test results in which HC had significantly higher RSFC than AN (p < .01, corrected for multiple comparisons). Functional maps are laid on Montreal neurological institute (MNI) brains in radiological orientation, right (R) to left (L) [Color figure can be viewed at http://wileyonlinelibrary.com]
3.2. Exploratory analyses: RSFC and symptom expression
A significant correlation was detected between NAcc‐SFG RSFC and EDE Global Scores for the AN‐R group (r = −.58, p = .01, CI: −.83, −.13), but not the HC group (r = .16, p = .52, CI: −.15, .65). For individuals with AN‐R, lower NAcc‐SFG connectivity strength was associated with more cognitive eating disorder symptoms (see Figure 5). Additionally, although the correlation between dorsal caudate‐temporal RSFC and EDE global failed to meet significance based on p value for the AN‐R group (r = −.40, p = .10), the bootstrapped confidence interval highlighted a significant effect with repeated sampling (CI: −.02, −.68), suggesting that lower dorsal caudate‐temporal RSFC may be associated with higher cognitive eating disorder symptoms in this group. This relationship was not significant according to either index for the HC group (r = −.16, p = .52, CI: −.38, .19). There were no significant correlations between patterns of ventral caudate RSFC and EDE Global Scores.
Figure 5.
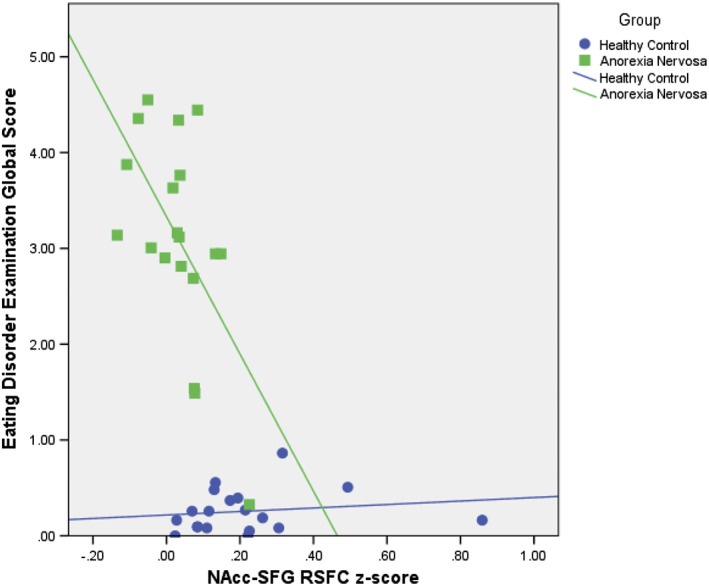
Associations between nucleus accumbens (NAcc)‐superior frontal gyrus (SFG) resting state functional connectivity (RSFC) strength and eating disorder examination (EDE) global scores by diagnosis: Results showing significant bootstrapped correlation between NAcc‐SFG RSFC z‐scores and EDE global scores for the anorexia nervosa (AN) group (r = −.58, p = .01, CI: −.83, −.13), but not the healthy control (HC) group (r = .16, p = .52, CI: −.15, .65). AN group depicted with green squares and healthy control HC group with purple circles [Color figure can be viewed at http://wileyonlinelibrary.com]
The correlation between ventral caudate‐OFC RSFC and BMI failed to meet significance based on p value for the AN‐R group (r = .35, p = .14); however, the bootstrapped confidence interval highlighted a significant effect with repeated sampling (CI: .04, .64), suggesting that less ventral caudate‐OFC RSFC may be associated with lower BMI for this group, but not the HC group (r = −.12, p = .64, CI: −.55, .40). The correlation between dorsal caudate‐putamen RSFC and BMI also failed to meet significance based on p value for the AN‐R group (r = −.29, p = .23), but demonstrated a significant bootstrapped confidence interval with repeated sampling (CI: −.03, −.56), suggesting that higher dorsal caudate‐putamen RSFC may be associated with lower BMI in this group, but not the HC group (r = −.24, p = .32, CI: .62, −.37). There were no significant correlations between patterns of NAcc RSFC and BMI.
No other significant associations were detected between any other connectivity pattern and symptom measure. Illness duration in the AN‐R group was not significant associated with any RSFC pattern (rs = −.01 to .23, ps = .40 to .98, CI: −.19, .51 to −.51, .50).
4. DISCUSSION
In this study, we expanded upon the literature on the neural systems implicated in reward‐ and habit‐based learning in AN by examining RSFC along the ventral (affective) to dorsal (cognitive) functional organization of the striatum (Di Martino et al., 2008; Huang et al., 2017) between AN‐R and HC groups. Consistent with the reward deficit (Kaye et al., 2013; Wierenga et al., 2014) and habit‐centered (Steinglass & Walsh, 2016; Walsh, 2013) theories of AN, resting state differences were identified for AN‐R relative to HC groups between the NAcc, ventral caudate, and dorsal caudate and related brain regions. The degree of network disturbance increased dorsally along this axis, suggesting more widespread dysconnectivity in areas implicated in habit learning and other cognitive and motor processes. Exploratory analyses suggested that these abnormal patterns of connectivity might be associated with the expression of clinical symptoms in AN‐R, with NAcc‐SFG hypoconnectivity especially linked to cognitive eating disorder symptoms.
In line with study hypotheses, the AN‐R group exhibited lower RSFC between the NAcc and a frontal brain region (i.e., SFG), as well as between the ventral caudate and frontal (i.e., OFC, motor cortex) and posterior (i.e., precuneus) regions compared to the HC group, representing poor functional coordination in AN between key brain areas that have been associated with reward processing (Balleine & O'Doherty, 2010). Further, exploratory analyses revealed a moderate and significant effect in which low RSFC between the NAcc and SFG was associated with elevated cognitive symptoms of an eating disorder. There was also initial suggestion that lower ventral caudate‐OFC RSFC was associated with lower BMI; however, this finding should be interpreted cautiously since it failed to reach alpha significance, despite demonstrating a significant bootstrapped confidence interval.
These findings are consistent with theoretical perspectives suggesting that AN is characterized by disturbances in the underlying organization of reward‐related circuitry, which are connected to key clinical symptoms of this disorder (Brooks et al., 2011; Holsen et al., 2012). However, the results did not replicate the results of a prior study that found greater NAcc‐left OFC RSFC strength in AN versus HC groups (Cha et al., 2016). Sample differences may account for these incongruities. The study by Cha et al. (2016) included both AN subtypes, whereas our sample exclusively comprised AN‐R, a group which may have lower trait reward responsivity than AN‐BP (Fassino et al., 2002) and thereby more pronounced disturbances in RSFC in ventral frontostriatal circuitry. Notably, AN subtype was not found to influence results in the prior study (Cha et al., 2016). Alternatively, differences in psychotropic medication use, which was permitted in this study, but excluded in the prior study (Cha et al., 2016), may have influenced results. However, medication use did not fully account for group differences in this study.
These discrepancies highlight a broader issue within the reward literature for AN. Although differences in the function of ventral frontostriatal circuitry between AN and HC participants have been frequently identified and hypothesized to reflect reward system disturbances in AN, the direction of these effects has been inconsistent (O'Hara, Campbell, & Schmidt, 2015). For instance, some studies have demonstrated over‐responsivity (Cowdrey, Park, Harmer, & McCabe, 2011; Frank et al., 2012) and others under‐responsivity (Brooks et al., 2011; Holsen et al., 2012; Scaife, Godier, Reinecke, Harmer, & Park, 2016) of regions associated with reward processing in response to food cues. Such incongruities in the literature indicate that there is unexplained complexity, and potentially heterogeneity, in the precise pattern of ventral frontostriatal involvement in AN that warrants further research. However, the results of this study add to a growing body of literature suggesting that there are disturbances in the functioning of the circuitry underlying reward processing this population.
Individuals with AN‐R also exhibited differences compared to the HC group in patterns of RSFC between the dorsal caudate and several brain regions, include frontal (i.e., OFC, SFG, motor cortex), temporal, and posterior (i.e., precuneus, visual cortex) regions, as well as other areas of the dorsal striatum (i.e., putamen). These areas have broadly been implicated in attending to, organizing, and executing behavior, supporting theories suggesting alterations in the biological correlates of habit learning in AN (Steinglass & Walsh, 2016; Walsh, 2013). However, whereas we hypothesized a greater functional organization of the dorsal frontostriatal system among individuals with AN‐R based on habit‐centered theory, we found evidence of low dorsal caudate integration with other brain regions, and some initial evidence (although not meeting alpha significance standards) that low dorsal caudate connectivity with other brain regions (i.e., temporal cortex) may be associated with greater cognitive eating disorder symptoms.
It is important to note that patterns of RSFC activity do not necessarily correspond with task‐related activity. Therefore, it is possible that lower connectivity between the dorsal caudate and other brain regions could co‐occur with hyper‐responsivity of these same regions to disorder‐relevant cues. In fact, significant evidence suggests that dorsal caudate activation underlies responses to food stimuli in AN (Foerde et al., 2015; Rothemund et al., 2011; Sanders et al., 2015; Zhu et al., 2012), which has been interpreted as evidence as habit learning to disorder‐specific situations (Steinglass & Walsh, 2016). Interestingly, there was suggestion in our data based on significant bootstrapped confidence intervals that greater connectivity specifically within the dorsal striatum (i.e., dorsal caudate and putamen) may be associated with lower BMIs among individuals with AN, which is consistent with habit‐centered hypotheses on the maintenance of AN. However, these effects were small and very preliminary due to failing to meet statistical standards (i.e., correction for multiple comparisons, alpha significance). Further, some research has found no evidence of a heightened tendency towards habit formation in this population (Godier et al., 2016), and the dorsal caudate has been implicated in a range of other functions beyond habit learning. Therefore, more research is needed to understand the distinct involvement of the dorsal caudate and functionally connected regions in the maintenance of symptoms of AN. Regardless of interpretation, the results of this study for the first time demonstrate notable disturbances in the resting functional synchrony of the dorsal caudate with other brain regions in AN.
All group difference findings were in the direction of hypoconnectivity in AN‐R relative to HC participants, which could raise questions about whether there were non‐specific alterations in the functional organization of brain circuitry, rather than disturbances specifically related to frontostriatal functioning. Related, there is a possibility that the use of psychotropic medications among approximately half of the AN‐R sample may have broadly impacted RSFC. Specifically, we found that NAcc, ventral caudate, and dorsal caudate RSFC patterns all differed between AN‐R participants taking versus not taking these medications. Prior research has found that antidepressant medication use can have effects on RSFC of a range of circuitry, including in circuits related to reward and emotional processing (An et al., 2017; McCabe & Mishor, 2011). For this reason, further research is needed to characterize RSFC in patients with AN and other psychiatric illnesses before and after interventions, including medication. However, our analyses used a robust method for identifying significant whole‐brain correlations with the specified ROIs (NAcc, ventral caudate, and dorsal caudate). This approach did not show reduced striatal connectivity with the entire brain, but only with specific regions; therefore, it is unlikely that non‐specific effects are entirely responsible for the findings of this study.
Stage of illness was not related to RSFC patterns in this sample, despite suggestions that ventral frontostriatal disturbances may predominate in early stages and dorsal frontostriatal disturbances in later stages of AN (Godier & Park, 2014; Walsh, 2013). This finding should be interpreted cautiously because this study may have been underpowered to detect the association between duration of AN and RSFC patterns and the measure used to establish duration of illness was somewhat imprecise. Additionally, although illness duration suggested that participants were, on average, beyond the early stages of AN (Broomfield et al., 2017), it is possible that the illness duration range was too narrow to capture effects of illness chronicity on frontostriatal circuitry. However, this finding could also suggest that patterns of heterogeneity in brain functioning among individuals with AN differ according to variables other than length of illness. As these analyses were exploratory, further research is needed to examine changes in brain functioning over the course of illness in AN.
These findings should be considered in context of study limitations. This research was cross‐sectional and conducted with an acutely ill sample to examine hypothetical maintenance factors. Therefore, causality cannot be assumed. Additionally, the findings of the correlation analyses may be limited by a relatively small sample size and multiple comparisons and, thus, need to be replicated. There is also evidence that structural differences between AN and HC groups could impact patterns of RSFC (Scaife, Godier, Filippini, Harmer, & Park, 2017). For this reason, it is possible that the findings of this study could be accounted for by the documented differences in the structure of frontostriatal regions between and AN and HC groups (Frank, Shott, Riederer, & Pryor, 2016; Frank et al., 2013; Zhang et al., 2016). Future directions should include larger multi‐modal, longitudinal investigations to better understand the relationship between the structure and function of frontostriatal circuitry and the risk and maintenance of AN.
There are also potential limitations related to the sample selection for this study. The AN‐R group was underweight, representing protracted under‐nourishment, and possibly more immediately calorically deprived, as intake was not controlled before imaging. Starvation has been found to alter neural circuitry underlying reward and habit learning (Zink & Weinberger, 2010); therefore, group differences could reflect brain alterations associated with acute or prolonged starvation. However, some research has not found an association between acute (Wierenga et al., 2015) and sustained (Cha et al., 2016) nourishment and frontostriatal responding in AN. The AN group was also heterogeneous in terms of treatment involvement, which may have introduced variability into study outcomes. In addition, other differences between AN‐R and HC groups that we were unable to measure in this study (e.g., menstrual function, IQ, concurrent mood or anxiety disorder diagnosis, trait compulsivity) could be responsible for the effects detected in this study. These potential confounders should be systematically measured in future research examining RSFC of the ventral and dorsal striatum in AN. Finally, the sample consisted of young females with AN‐R; this could have resulted in an overly narrow sample and it is unknown the degree to which these findings would generalize to other demographics or AN‐BP. Future research with more diverse samples reflecting the range of developmental and illness stages in AN is encouraged to better understand patterns of heterogeneity in RSFC in this group. Because prior research has not identified AN subtype differences in RSFC of the striatum (Cha et al., 2016), future studies may benefit from including both AN subtypes.
Although these findings warrant replication, they provide preliminary evidence demonstrating resting state abnormalities across the ventral and dorsal striatum that lend credence to both reward deficit and habit‐centered models of AN. Future research uniting these theories of AN symptom maintenance is encouraged to better characterize the neural underpinnings of this severe psychiatric illness.
ACKNOWLEDGEMENTS
These data were presented during the Top Abstracts paper session at the annual conference for the Eating Disorders Research Society in Leipzig, Germany in September 2017. Research reported in this publication was supported by the National Institute of Mental Health under award numbers T32MH082761 and K23MH112867. The authors have no conflicts of interest to disclose.
Haynos AF, Hall LMJ, Lavender JM, et al. Resting state functional connectivity of networks associated with reward and habit in anorexia nervosa. Hum Brain Mapp. 2019;40:652–662. 10.1002/hbm.24402
Funding information National Institute of Mental Health, Grant/ Award Numbers: K23MH112867, T32MH082761
REFERENCES
- American Psychiatric Association . (2013). Diagnostic and statistical manual of mental disorders (5th ed.). Washington, DC: Author. [Google Scholar]
- An, J. , Wang, L. , Li, K. , Zeng, Y. , Su, Y. , Jin, Z. , … Si, T. (2017). Differential effects of antidepressant treatment on long‐range and short‐range functional connectivity strength in patients with major depressive disorder. Science Reports, 7, 10214. [DOI] [PMC free article] [PubMed] [Google Scholar]
- Bailer, U. F. , Price, J. C. , Meltzer, C. C. , Wagner, A. , Mathis, C. A. , Gamst, A. , & Kaye, W. H. (2017). Dopaminergic activity and altered reward modulation in anorexia nervosa‐insight from multimodal imaging. International Journal of Eating Disorders, 50, 593–596. [DOI] [PMC free article] [PubMed] [Google Scholar]
- Balleine, B. W. , & O'Doherty, J. P. (2010). Human and rodent homologies in action control: Corticostriatal determinants of goal‐directed and habitual action. Neuropsychopharmacology, 35, 48–69. [DOI] [PMC free article] [PubMed] [Google Scholar]
- Berkman, N. D. , Bulik, C. M. , Brownley, K. A. , Lohr, K. N. , Sedway, J. A. , Rooks, A. , & Gartlehner, G. (2006). Management of eating disorders. Evidence Report/Technology Assessment, 135, 1–166. [PMC free article] [PubMed] [Google Scholar]
- Brooks, S. J. , O'Daly, O. G. , Uher, R. , Friederich, H. C. , Giampietro, V. , Brammer, M. , … Campbell, I. C. (2011). Differential neural responses to food images in women with bulimia versus anorexia nervosa. PLoS One, 6, e22259. [DOI] [PMC free article] [PubMed] [Google Scholar]
- Brooks, S. J. , Rask‐Andersen, M. , Benedict, C. , & Schiöth, H. B. (2012). A debate on current eating disorder diagnoses in light of neurobiological findings: Is it time for a spectrum model? BMC Psychiatry, 12, 76. [DOI] [PMC free article] [PubMed] [Google Scholar]
- Broomfield, C. , Stedal, K. , Touyz, S. , & Rhodes, P. (2017). Labeling and defining severe and enduring anorexia nervosa: A systematic review and critical analysis. International Journal of Eating Disorders, 50, 611–623. [DOI] [PubMed] [Google Scholar]
- Cha, J. , Ide, J. S. , Bowman, F. D. , Simpson, H. B. , Posner, J. , & Steinglass, J. E. (2016). Abnormal reward circuitry in anorexia nervosa: A longitudinal, multimodal MRI study. Human Brain Mapping, 37, 3835–3846. [DOI] [PMC free article] [PubMed] [Google Scholar]
- Cowdrey, F. A. , Park, R. J. , Harmer, C. J. , & McCabe, C. (2011). Increased neural processing of rewarding and aversive food stimuli in recovered anorexia nervosa. Biological Psychiatry, 70, 736–743. [DOI] [PubMed] [Google Scholar]
- Crow, S. J. , Peterson, C. B. , Swanson, S. A. , Raymond, N. C. , Specker, S. , Eckert, E. D. , & Mitchell, J. E. (2009). Increased mortality in bulimia nervosa and other eating disorders. American Journal of Psychiatry, 166, 1342–1346. [DOI] [PubMed] [Google Scholar]
- Di Martino, A. , Scheres, A. , Margulies, D. S. , Kelly, A. M. , Uddin, L. Q. , Shehzad, Z. , … Milham, M. P. (2008). Functional connectivity of human striatum: A resting state fMRI study. Cerebral Cortex, 18, 2735–2747. [DOI] [PubMed] [Google Scholar]
- Eddy, K. T. , Tabri, N. , Thomas, J. J. , Murray, H. B. , Keshaviah, A. , Hastings, E. , … Franko, D. L. (2017). Recovery from anorexia nervosa and bulimia nervosa at 22‐year follow‐up. Journal of Clinical Psychiatry, 78, 184–189. [DOI] [PMC free article] [PubMed] [Google Scholar]
- Eklund, A. , Nichols, T. E. , & Knutsson, H. (2016). Cluster failure: Why fMRI inferences for spatial extent have inflated false‐positive rates. Proceedings of the National Academy of Sciences of the United States of America, 113, 7900–7905. [DOI] [PMC free article] [PubMed] [Google Scholar]
- Fairburn, C. G. , Cooper, Z. , & O'Connor, M. (2008). Eating disorder examination (16.0) In Fairburn C. G. (Ed.), Cognitive behavior therapy and eating disorders (pp. 265–308). New York, NY: Guilford Press. [Google Scholar]
- Fassino, S. , Abbate‐Daga, G. , Amianto, F. , Leombruni, P. , Boggio, S. , & Rovera, G. G. (2002). Temperament and character profile of eating disorders: A controlled study with the temperament and character inventory. International Journal of Eating Disorders, 32, 412–425. [DOI] [PubMed] [Google Scholar]
- Fichter, M. M. , Quadflieg, N. , Crosby, R. D. , & Koch, S. (2017). Long‐term outcome of anorexia nervosa: Results from a large clinical longitudinal study. International Journal of Eating Disorders, 50, 1018–1030. [DOI] [PubMed] [Google Scholar]
- First, M. B. , Spitzer, R. L. , Gibbon, M. , & Williams, J. B. W. (2002). Structured clinical interview for DSM‐IV‐TR Axis I disorders, research version, patient edition. (SCID‐I/P). New York, NY: Biometrics Research, New York State Psychiatric Institute. [Google Scholar]
- Fladung, A. K. , Grön, G. , Grammer, K. , Herrnberger, B. , Schilly, E. , Grasteit, S. , … von Wietersheim, J. (2010). A neural signature of anorexia nervosa in the ventral striatal reward system. American Journal of Psychiatry, 167, 206–212. [DOI] [PubMed] [Google Scholar]
- Foerde, K. , Steinglass, J. E. , Shohamy, D. , & Walsh, B. T. (2015). Neural mechanisms supporting maladaptive food choices in anorexia nervosa. Nature Neuroscience, 18, 1571–1573. [DOI] [PMC free article] [PubMed] [Google Scholar]
- Frank, G. K. , Shott, M. E. , Hagman, J. O. , & Mittal, V. A. (2013). Alterations in brain structures related to taste reward circuitry in ill and recovered anorexia nervosa and in bulimia nervosa. American Journal of Psychiatry, 170, 1152–1160. [DOI] [PMC free article] [PubMed] [Google Scholar]
- Frank, G. K. , Shott, M. E. , Riederer, J. , & Pryor, T. L. (2016). Altered structural and effective connectivity in anorexia and bulimia nervosa in circuits that regulate energy and reward homeostasis. Translational Psychiatry, 6, e932. [DOI] [PMC free article] [PubMed] [Google Scholar]
- Frank, G. K. , Reynolds, J. R. , Shott, M. E. , Jappe, L. , Yang, T. T. , Tregellas, J. R. , & O'Reilly, R. C. (2012). Anorexia nervosa and obesity are associated with opposite brain reward response. Neuropsychopharmacology, 37, 2031–2046. [DOI] [PMC free article] [PubMed] [Google Scholar]
- Godier, L. R. , de Wit, S. , Pinto, A. , Steinglass, J. E. , Greene, A. L. , Scaife, J. , … Park, R. J. (2016). An investigation of habit learning in anorexia nervosa. Psychiatry Research, 244, 214–222. [DOI] [PMC free article] [PubMed] [Google Scholar]
- Godier, L. R. , & Park, R. J. (2014). Compulsivity in anorexia nervosa: A transdiagnostic concept. Frontiers in Psychology, 5, 778. [DOI] [PMC free article] [PubMed] [Google Scholar]
- Holsen, L. M. , Lawson, E. A. , Blum, J. , Ko, E. , Makris, N. , Fazeli, P. K. , … Goldstein, J. M. (2012). Food motivation circuitry hypoactivation related to hedonic and nonhedonic aspects of hunger and satiety in women with active anorexia nervosa and weight‐restored women with anorexia nervosa. Journal of Psychiatry and Neuroscience, 37, 322–332. [DOI] [PMC free article] [PubMed] [Google Scholar]
- Huang, H. , Nguyen, P. T. , Schwab, N. A. , Tanner, J. J. , Price, C. C. , & Ding, M. (2017). Mapping dorsal and ventral caudate in older adults: Method and validation. Frontiers in Aging Neuroscience, 9, 91. [DOI] [PMC free article] [PubMed] [Google Scholar]
- Jenkinson, M. , Bannister, P. , Brady, M. , & Smith, S. (2002). Improved optimization for the robust and accurate linear registration and motion correction of brain images. NeuroImage, 17, 825–841. [DOI] [PubMed] [Google Scholar]
- Kaye, W. H. , Wierenga, C. E. , Bailer, U. F. , Simmons, A. N. , & Bischoff‐Grethe, A. (2013). Nothing tastes as good as skinny feels: The neurobiology of anorexia nervosa. Trends in Neuroscience, 36, 110–120. [DOI] [PMC free article] [PubMed] [Google Scholar]
- Kelly, R. E., Jr. , Alexopoulos, G. S. , Wang, Z. , Gunning, F. M. , Murphy, C. F. , Morimoto, S. S. , … Hoptman, M. J. (2010). Visual inspection of independent components: Defining a procedure for artifact removal from fMRI data. Journal of Neuroscience Methods, 189, 233–245. [DOI] [PMC free article] [PubMed] [Google Scholar]
- McCabe, C. , & Mishor, Z. (2011). Antidepressant medications reduce subcortical‐cortical resting‐state functional connectivity in healthy volunteers. NeuroImage, 57, 1317–1323. [DOI] [PMC free article] [PubMed] [Google Scholar]
- Mitchell, J. E. , & Crow, S. (2006). Medical complications of anorexia nervosa and bulimia nervosa. Current Opinion in Psychiatry, 19, 438–443. [DOI] [PubMed] [Google Scholar]
- O'Hara, C. B. , Campbell, I. C. , & Schmidt, U. (2015). A reward‐centred model of anorexia nervosa: A focussed narrative review of the neurological and psychophysiological literature. Neuroscience and Biobehavioral Reviews, 52, 131–152. [DOI] [PubMed] [Google Scholar]
- Redgrave, G. W. , Bakker, A. , Bello, N. T. , Caffo, B. S. , Coughlin, J. W. , Guarda, A. S. , … Moran, T. H. (2008). Differential brain activation in anorexia nervosa to fat and thin words during a stroop task. Neuroreport, 19, 1181–1185. [DOI] [PMC free article] [PubMed] [Google Scholar]
- Rothemund, Y. , Buchwald, C. , Georgiewa, P. , Bohner, G. , Bauknecht, H. C. , Ballmaier, M. , … Klingebiel, R. (2011). Compulsivity predicts fronto striatal activation in severely anorectic individuals. Neuroscience, 197, 242–250. [DOI] [PubMed] [Google Scholar]
- Sanders, N. , Smeets, P. A. , van Elburg, A. A. , Danner, U. N. , van Meer, F. , Hoek, H. W. , & Adan, R. A. (2015). Altered food‐cue processing in chronically ill and recovered women with anorexia nervosa. Frontiers in Behavioral Neuroscience, 9, 46. [DOI] [PMC free article] [PubMed] [Google Scholar]
- Scaife, J. C. , Godier, L. R. , Filippini, N. , Harmer, C. J. , & Park, R. J. (2017). Reduced resting‐state functional connectivity in current and recovered restrictive anorexia nervosa. Frontiers in Psychiatry, 8, 30. [DOI] [PMC free article] [PubMed] [Google Scholar]
- Scaife, J. C. , Godier, L. R. , Reinecke, A. , Harmer, C. J. , & Park, R. J. (2016). Differential activation of the frontal pole to high vs low calorie foods: The neural basis of food preference in anorexia nervosa? Psychiatry Research: Neuroimaging, 258, 44–53. [DOI] [PMC free article] [PubMed] [Google Scholar]
- Steinglass, J. E. , & Walsh, B. T. (2016). Neurobiological model of the persistence of anorexia nervosa. Journal of Eating Disorders, 4, 19. [DOI] [PMC free article] [PubMed] [Google Scholar]
- Steward, T. , Menchón, J. M. , Jiménez‐Murcia, S. , Soriano‐Mas, C. , & Fernández‐Aranda, F. (2017). Neural network alterations across eating disorders: A narrative review of fMRI studies. Current Neuropharmacology, 16, 1150–1163. 10.2174/1570159X15666171017111532 [DOI] [PMC free article] [PubMed] [Google Scholar]
- Titova, O. E. , Hjorth, O. C. , Schiöth, H. B. , & Brooks, S. J. (2013). Anorexia nervosa is linked to reduced brain structure in reward and somatosensory regions: A meta‐analysis of VBM studies. BMC Psychiatry, 13, 110. [DOI] [PMC free article] [PubMed] [Google Scholar]
- Ulfvebrand, S. , Birgegård, A. , Norring, C. , Högdahl, L. , & von Hausswolff‐Juhlin, Y. (2015). Psychiatric comorbidity in women and men with eating disorders results from a large clinical database. Psychiatry Research, 230, 294–299. [DOI] [PubMed] [Google Scholar]
- Walsh, B. T. (2013). The enigmatic persistence of anorexia nervosa. American Journal of Psychiatry, 170, 477–484. [DOI] [PMC free article] [PubMed] [Google Scholar]
- Wierenga, C. E. , Bischoff‐Grethe, A. , Melrose, A. J. , Irvine, Z. , Torres, L. , Bailer, U. F. , … Kaye, W. H. (2015). Hunger does not motivate reward in women remitted from anorexia nervosa. Biological Psychiatry, 77, 642–652. [DOI] [PMC free article] [PubMed] [Google Scholar]
- Wierenga, C. E. , Ely, A. , Bischoff‐Grethe, A. , Bailer, U. F. , Simmons, A. N. , & Kaye, W. H. (2014). Are extremes of consumption in eating disorders related to an altered balance between reward and inhibition? Frontiers in Behavioral Neuroscience, 8, 410. [DOI] [PMC free article] [PubMed] [Google Scholar]
- Zhang, A. , Leow, A. , Zhan, L. , GadElkarim, J. , Moody, T. , Khalsa, S. , … Feusner, J. D. (2016). Brain connectome modularity in weight‐restored anorexia nervosa and body dysmorphic disorder. Psychological Medicine, 46, 2785–2797. [DOI] [PMC free article] [PubMed] [Google Scholar]
- Zhu, Y. , Hu, X. , Wang, J. , Chen, J. , Guo, Q. , Li, C. , & Enck, P. (2012). Processing of food, body and emotional stimuli in anorexia nervosa: A systematic review and meta‐analysis of functional magnetic resonance imaging studies. European Eating Disorder Review, 20, 439–450. [DOI] [PubMed] [Google Scholar]
- Zink, C. F. , & Weinberger, D. R. (2010). Cracking the moody brain: The rewards of self‐starvation. Nature Medicine, 16, 1382–1383. [DOI] [PubMed] [Google Scholar]