

Abstract
Introduction
Morbidity and mortality from poison- and drug-related illness continue to rise in the USA. Medical toxicologists are specifically trained to diagnose and manage these patients. Inpatient medical toxicology services exist but their value-based economic benefits are not well established.
Methods
This was a retrospective study where length of stay (LOS) and payments received between a hospital with an inpatient medical toxicology service (TOX) and a similar hospital in close geographic proximity that does not have an inpatient toxicology service (NONTOX) were compared. Controlling for zip code, demographics and distance patients lived from each hospital, we used a fitted multivariate linear regression model to identify factors associated with changes in LOS and payment.
Results
Patients admitted to the TOX center had 0.87 days shorter LOS per encounter and the hospital received an average of $1800 more per patient encounter.
Conclusion
In this study, the presence of an inpatient medical toxicology service was associated with decreased patient LOS and increased reimbursement for admitted patients. Differences may be attributable to improved direct patient care provided by medical toxicologists, but future prospective studies are needed.
Keywords: Medical toxicology service, Economics, Quality of health care
Introduction
Drug overdoses and poisonings are on the rise nationally; deaths from unintentional drug overdoses increased 137% from 2000 to 2014 [1] while suicide rates increased 28% from 1999 to 2016. Poisoning is the third leading mode of suicide [2]. At the same time, recent health care reforms have placed an emphasis on providing high-value care focusing, among other metrics, on the patient length of stay (LOS) and payment. Under the Affordable Care Act (ACA), hospitals are incentivized to discharge patients as soon as possible, to ensure follow-up care, and to avoid 30-day readmissions. As drug-related hospitalizations increase and drug-related morbidity and mortality continue to rise, the need for cost-appropriate measures that address rising inpatient expenses, yet, maintain high-quality care for this subset of patients is essential.
Medical toxicologists (MTs) are clinicians who specialize in the treatment of drug- and poison-related illness. MTs provide care for this group of patients in various ways: they may staff regional poison control centers and relay advice via telephone, provide direct bedside or telemedicine consultation, run their own primary admitting services, or a combination of these activities. Numerous studies have demonstrated the value of regional poison control center input in managing poisoned patients through reductions in unnecessary emergency department visits, hospital admissions, and hospital length of stay [3–16]. However, few studies have evaluated the value, efficiency, and patient outcomes of inpatient services run by medical toxicologists. Results of three such studies are remarkably consistent and found overall benefit in care provided by MTs with decreased LOS, increased overall healthcare savings, and improved outcomes [17–19]. Two of these studies were conducted in Australia and their findings may not generalize to US health systems. The beneficial effect of an inpatient medical toxicology service in Arizona as described by Curry has yet to be described in other US hospital systems and other states.
With the increased emphasis of linking quality outcomes to reimbursement coupled with the rise of illness due to poisoning in the USA, describing the benefits of bedside medical toxicology services is needed. Prior work has shown improved clinical outcomes associated with an admitting toxicology service [19]. In this study, we compare the LOS and payment received for poisoned patients in two geographically proximate hospitals operated by the same healthcare system, one hospital with a primary admitting inpatient medical toxicology service (TOX) and one without (NONTOX). Since MTs are specifically trained in diagnosing and managing acutely poisoned patients, we hypothesize that a primary inpatient medical toxicology service hospital provides more efficient care in terms of hospital LOS and enhanced payment.
Methods and Data
This is a retrospective observational cohort study comparing patients admitted to two hospitals in Pittsburgh, Pennsylvania, both within the University of Pittsburgh Medical Center (UPMC) healthcare system.
These two hospitals are each level I trauma tertiary care academic referral centers and located in the same city within 2 mi of each other. Both hospitals had a similar average annual emergency department volume (TOX, 53000 versus NONTOX, 70,000) during the study period and have a similar number of acute care beds (TOX, 650 versus NONTOX, 535). Both hospitals are part of the same health system and have the same available resources including consulting services, surgical subspecialties, and residency training programs.
TOX hospital has an active inpatient medical toxicology service staffed 24/7 by MTs who are the primary service. While other services may be consulted for needed interventions and advice including pulmonology, nephrology, gastroenterology, general surgery and other surgical subspecialties, and psychiatry, MTs make the ultimate care decisions. Additionally, the toxicology service provides bedside consultations for other primary services (e.g., internal medicine, general surgery, critical care medicine) who seek their advice. The TOX hospital is the primary training site for medical toxicology fellows. The toxicology service is composed of medical toxicology attendings, first and second year fellows, and a small group of rotating residents (emergency, internal medicine, psychiatry, and pediatrics) and medical students. Fellows-in-training perform duties including patient evaluations, writing orders and notes, professional communication, and procedures under the supervision of the attending medical toxicologists. The NONTOX hospital has no medical toxicologists on staff to provide inpatient admissions or bedside consultation, but the NONTOX hospital does have access to the regional poison center where the toxicologists from the TOX hospital provide medical direction and phone consultation.
We included all patients admitted to either hospital through the emergency department or transferred from an outside institution over a 4-year period (2009–2012) with the primary diagnosis of “overdose,” “poisoning,” or “toxicity” with ICD-9 codes 289, 304, 305, 503, E850–869, E930–952, and 960–989. Each ICD-9 code and each code’s relative frequency at each hospital are shown in Table 1. An honest broker is a neutral third entity that collects and provides de-identified information to a research team. We employed the use of an honest broker to obtain the de-identified charts as per university protocol and to limit bias throughout the chart review process.
Table 1.
Frequency of ICD-9 diagnostic code by hospital
| Primary diagnosis code (ICD-9) | Diagnostic description | NONTOX (%) | TOX (%) |
|---|---|---|---|
| 289.7, 304, 305, and 503 | Methemoglobinemia (289.7), Drug Dependence (304), Nondependent Drugs of Abuse (305), and pneumoconiosis (503) | 0.17 | 0.1 |
| 960–979 | Poisoning by: | ||
| 960 and 961 | Antibiotics and anti-infectives | 0 | 0 |
| 962 | Hormones and synthetic substitutes | 1.16 | 0 |
| 963 | Primarily systemic agents | 2.15 | 3.18 |
| 964 | Primarily affecting blood constituents | 0.17 | 0.2 |
| 965 | Analgesics, antipyretics, and antirheumatics | 34.77 | 30.38 |
| 966 | Anticonvulsants and anti-Parkinsonism drugs | 3.97 | 2.41 |
| 967 | Sedatives and hypnotics | 4.31 | 2.51 |
| 968 | Other CNS depressants and anesthetics | 2.31 | 1.94 |
| 969 | Psychotropic agents | 36.76 | 36.74 |
| 970 | CNS stimulants | 2.49 | 1.64 |
| 971 | Primarily affecting autonomic nervous system | 0.99 | 1.74 |
| 972 | Primarily affecting cardiovascular system | 2.16 | 2.32 |
| 973 | Primarily affecting the GI system | 0 | 0.1 |
| 974 | Water, mineral, and uric acid metabolism drugs | 0.33 | 0.2 |
| 975 | Primarily acting on smooth and skeletal muscles and respiratory system | 1 | 2.23 |
| 976 | Primarily Affecting Skin and Mucous Membrane, Eye, ENT, and Dental Drugs | 0 | 0.2 |
| 977 | Unspecified Drugs and Medicinal Substances | 2.81 | 2.89 |
| 978 and 979 | Bacterial Vaccines and Other Vaccines and Biological Substances | 0 | 0 |
| 980–989 | Toxic effect of substances chiefly nonmedicinal as to source: | ||
| 980 | Alcohol | 1.16 | 1.84 |
| 981 and 984 | Petroleum products and Leda and its compounds | 0 | 0 |
| 982 | Solvents other than petroleum-based | 0.5 | 1.74 |
| 983 | Corrosive aromatics, acids, and caustic alkalis | 0.83 | 0.68 |
| 985 | Other metals | 0 | 0.19 |
| 986 | Carbon monoxide | 0.33 | 3.28 |
| 987 | Gases, fumes, or vapors | 0.5 | 0.3 |
| 988 | Noxious substances eaten as food | 0 | 0.29 |
| 989 | Other nonmedicinal substances | 1 | 1.55 |
| E850–69 (supplementary classifications) | Accidental poisoning by drugs, medicinal substances, and biologicals, solid and liquid substances, gases, and vapors | 0 | 0 |
| E930–49 (supplementary classifications) | Drugs, medicinal and biological substances causing adverse effects in therapeutic use | 0 | 0 |
| E950–952 (supplementary classifications) | Suicide and self-inflicted poisoning | 0 | 0 |
| Total | 100 | 100 |
Authors’ own tabulation of primary diagnostic codes for all inpatient admissions within the study period. TOX hospital with an inpatient toxicology service, NONTOX hospital without an inpatient toxicology service. CNS central nervous system ENT ear, nose, and throat
We identified 1970 charts that met inclusion criteria. Study authors then reviewed the charts. Since the NONTOX hospital serves as an inpatient center for addiction treatment and the TOX hospital serves as both the envenomation center and hyperbaric oxygen center, certain cases were removed to eliminate bias. Exclusion criteria included the following: age < 18 years old, prisoners, pregnant women, patients admitted for withdrawal or alcohol intoxication only, envenomations, carbon monoxide poisoning, “level 1” or “level 2” trauma activations, no evidence of overdose or toxicity, cocaine chest pain, patients that died in the ED, and those with incomplete data. Patients admitted for alcohol intoxication or withdrawal only were excluded based on hospital characteristics. The NONTOX hospital has an observation area in the emergency department for intoxicated individuals as well as a robust addiction medicine service. The TOX hospital did not. Therefore, intoxicated patients were likely to be admitted to the TOX hospital toxicology service and presumably would skew the TOX hospital LOS. Similarly, carbon monoxide poisoning was excluded because only the TOX hospital has hyperbaric capabilities. Envenomations were excluded because all envenomations were preferentially admitted or transferred to the TOX hospital because of the medical toxicology service. Two investigators reviewed each patient chart independently (AK and NM). Each chart was coded as “a clear overdose/poisoning/toxicity,” “clearly not an overdose/poisoning/toxicity,” “meets exclusion criteria,” or “unsure.” A third and fourth investigator reviewed 20% of each primary assessor’s charts to assess for discrepancies (MA and ML). A fifth co-investigator was the deciding vote for all discrepancies (AFP). Interrater agreement by investigators of 1000 randomly selected charts was 76.40% with a calculated Cohen’s kappa of 0.61 (Standard Error 0.022). This suggests substantial agreement between reviewers.
We collected basic demographic data including age, sex, race, health insurance status, zip code, Charlson index of comorbidities, number of diagnoses at admission, and admission to ICU. Additionally, we collected hospital LOS, ICU LOS, hospital DRGs with Case Mix Index (CMI) modifiers, and admission disposition (i.e., ICU versus medical floor), as well as total cost and reimbursement of hospitalization (costs are defined as the dollar amount of resources used to provide all aspects of patient care, including direct and indirect reported costs). Because billing is dependent on multiple factors and institution-specific, we analyzed reimbursements received from private and public insurance carriers, patients, and other third parties. We call these reimbursements “payment” in our analysis.
We supplemented the data with patient zip code characteristics from the American Community Survey (ACS) for 2013. We used patient zip code characteristics to help control for economic factors that could influence patient health and, thus, outcomes. Zip code characteristics included poverty rate, average age, median income, unemployment rate, and proportions of Medicaid and Medicare patients. Under the assumption that most patients originated from his/her home address, we also used distance from hospital to control for the possibility that EMS providers chose the TOX hospital for poisoning emergencies.
Statistics
In an ideal study setting, patients would be randomly assigned to TOX or NONTOX hospital, with reimbursements attributable to the toxicology service clearly separated from all other care. Then, a direct comparison of mean LOS and reimbursements at the hospitals would allow us to attribute the change in each outcome to the toxicology intervention without bias. In the absence of such random assignment, however, patients sort themselves into TOX and NONTOX hospital rendering a direct comparison of means biased. For example, the TOX hospital may attract more acute poisoning cases in view of their expertise. In this case, TOX hospital would have an average longer LOS due to the higher complexity of cases. Another possibility is that the patient populations may differ between hospitals depending on its surrounding communities. If the NONTOX hospital is closer to zip codes with low income, patients drawn from these communities may have a higher incidence of comorbidities and higher risk of complications. Thus, in a direct comparison, patients at the NONTOX hospital would have a higher LOS and higher reimbursements reflecting more complications and comorbidities.
To untangle these confounding factors, our analysis extends beyond a direct comparison of hospital means, using multivariate linear regression modeling. Regression analysis allows us to separate our sample into component categories of gender, age, race, payer type, ICU admission status, Charlson comorbidity index, patient zip code characteristics, and year admission for a like-to-like comparison across hospitals. To conduct the analysis, we fit the following Eq. (1) to our data:
| 1 |
where Yit is the outcome of interest (LOS, reimbursement) for individual i in year t. The outcome of interest is a function of the hospital type (TOXi), gender (Femi), age (Agei), race (Blacki), payer type (MCaidi, MCarei, Selfi), ICU admission status (ICUi), Charlson comorbidity index (Charlsoni), the year of admission (Yeart), a vector of the zip code characteristics (Zipt), distance from hospital (Disti), and unobserved confounders reflected by the error term (εit). Each of the coefficients β1–β10 captures the contribution of the corresponding factor to the observed outcome. While the coefficient of interest in this study is β1 which estimates the difference between TOX and NONTOX hospitals when all other confounders have been removed; to complete our exposition, we will interpret all of these coefficients where interest and statistical significance allow.
The outcomes of interest were hospital LOS, ICU admissions, and payment received from all parties. Because ICU admissions are a binary indicator, logistic analysis would be appropriate. However, in interest of ease of interpretation and sample size, we will estimate this outcome using the same linear model, interpreting the results in consistency with linear probability model. The results from a logistic analysis for this outcome are available upon request. Payments were both from inpatient and outpatient charges and included ED billing and patients admitted to “observation” status. When estimating the specification for payment received, we controlled for the hospital LOS to account for the additional cost associated with longer stays. To test the sensitivity of our results, we repeated our analysis with different controls, with and without transfer patients, and by payee. Interrater reliability was assessed using Cohen’s kappa test and baseline characteristics are compared using Student’s t tests (Table 2). Else, all other comparisons utilized multilinear regression. We estimate all our models using Stata® statistical software, and the standard errors are adjusted for heteroscedastic data.
Table 2.
TOX versus NONTOX summary comparison statistics
| Total | NONTOX | TOX | Difference | p value | |
|---|---|---|---|---|---|
| Age | 46.723 | 48.068 | 46.015 | − 2.053 | 0.014 |
| Black | 13.00% | 15.00% | 11.80% | − 3.20% | 0.0647 |
| Female | 51.20% | 50.30% | 51.90% | 1.60% | 0.4545 |
| Medicaid | 39.50% | 43.90% | 37.10% | − 6.80% | 0.0083 |
| Medicare | 24.20% | 26.40% | 23.00% | − 3.40% | 0.1346 |
| Private | 26.30% | 22.20% | 28.60% | 6.40% | 0.0047 |
| Self-pay | 9.60% | 7.10% | 11.10% | 4.00% | 0.0074 |
| ICU | 31.60% | 11.50% | 43.30% | 31.80% | 0 |
| Length of stay (days) | 3.592 | 3.425 | − 0.167 | 0.4615 | |
| Payment (dollars) | $5072 | $8068 | $2996 | 0.0002 | |
| N. Obs | 1675 | 617 | 1058 | ||
Authors’ own calculations of all inpatient admissions with diagnostic code 289, 304, 305, 503, E850–869, E930–952, and 960–989. ICU intensive care unit. TOX hospital with inpatient medical toxicology service, NONTOX hospital without inpatient medical toxicology service. Length of stay is defined as difference between admission date and discharge date. Payment is the sum of reimbursements received from private and public insurance, patient, and third-party payer
Results
After application of inclusion and exclusion criteria, 1675 charts were identified and a total of 617 and 1058 patients at the NONTOX and TOX hospitals, respectively, were included in analysis (Fig. 1). Cases with incomplete data (e.g., zip code characteristics, and distance from hospital) were excluded from some analyses, which accounts for the change in total numbers of observations among the tables. Table 2 shows the direct unadjusted comparison between hospitals. It reports patient demographics, insurance status, and proportion admitted to each hospital’s ICU, in the first by hospital type, and then the difference with corresponding p value.
Fig. 1.
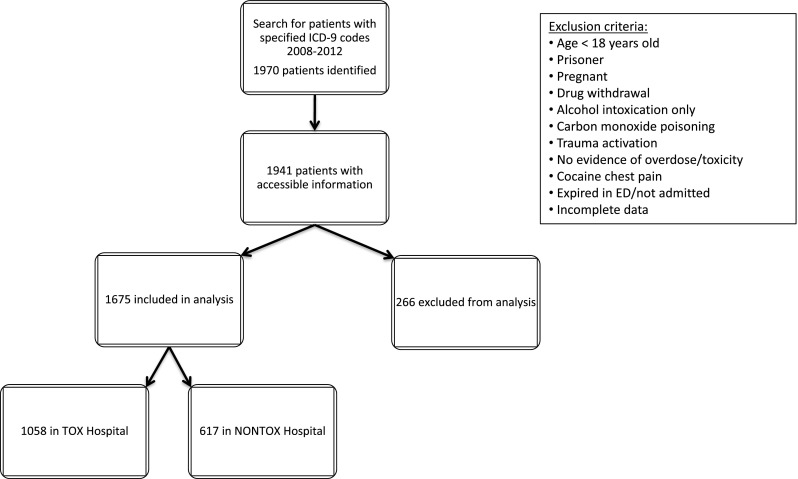
Flowchart of study chart selection
Patients admitted to the NONTOX hospital were 2 years older and more likely to have Medicaid than the TOX hospital. Patients admitted to the TOX hospital were more likely to have private or no insurance and were more likely to be admitted to the ICU (43.3% versus 11.5%). Finally, the TOX hospital received an unadjusted average of $3000 more in payment per hospitalized patient. The unadjusted LOS was not significantly different between hospitals (3.6 versus 3.4 days; p = 0.46).
To control for patient composition on our outcomes of interest (LOS and payment), we performed a multivariate linear regression. Table 3 reports the results of this linear regression model comparing the TOX to the NONTOX hospital, controlling for patient demographics, year, payer, ICU admission, Charlson comorbidity index, zip code demographics, and distance from patient zip code to hospital. Table 3 reports the estimated values for β1–β10, and their p values. Statistically significant results are bolded. In the first column, examining LOS, we interpret the statistically significant coefficients in the following manner: controlling for other confounding factors, patients admitted to the TOX hospital stayed 0.87 fewer days than those admitted to the NONTOX center (− 0.87, p = 0.000). At both hospitals, for each additional year of age, patients stayed 0.03 extra days (0.03, p = 0.001), while each unit increase in the Charlson comorbidity index increased length of stay by 0.52 days (0.52, p = 0.000). Black patients stayed an average 0.48 fewer days compared to other races and ethnicities, though this estimate is weakly statistically significant (− 0.48. p = 0.053). At both hospitals, patients stayed 0.25 days longer with each passing year during the study period 2009–2012 (0.25, p = 0.004). At both TOX and NONTOX, Medicaid patients stayed 0.87 more days, compared to privately insured patients (0.87, p = 0.000).
Table 3.
Multivariate linear regression of length of stay including transferred patients
| Length of stay (days) | Payment (US dollars) | |||
|---|---|---|---|---|
| Coeff. | p value | Coeff. | p value | |
| TOX | − 0.87 | 0.000 | 1809.11 | 0.000 |
| LOS | 1695.12 | 0.000 | ||
| Age | 0.03 | 0.001 | − 14.74 | 0.500 |
| Black | − 0.48 | 0.053 | − 265.97 | 0.594 |
| Female | − 0.10 | 0.655 | − 829.86 | 0.072 |
| Year | 0.25 | 0.004 | − 172.60 | 0.256 |
| Medicaid | 0.87 | 0.000 | − 1675.40 | 0.008 |
| Medicare | 0.54 | 0.107 | − 1956.76 | 0.015 |
| Self-pay | − 0.26 | 0.322 | − 4919.25 | 0.000 |
| ICU | 2.27 | 0.000 | 1730.94 | 0.003 |
| Charlson | 0.52 | 0.000 | 262.02 | 0.302 |
| Zip demographics | Yes | Yes | ||
| Distance | Yes | Yes | ||
| R-squared | 0.11 | 0.46 | ||
| N. Obs | 1522 | 1522 | ||
Authors’ own calculations of all inpatient admissions with diagnostic code 289, 304, 305, 503, 850–869, 930–952, and 960–989. ICU intensive care unit. TOX hospital with inpatient medical toxicology service, NONTOX hospital without inpatient medical toxicology service. Length of stay (LOS) is defined as difference between admission date and discharge date. Payment is the sum of reimbursements received from private and public insurance, patient, and third-party payer
Differences in payment received are presented in the second column of Table 3. In this analysis, we include LOS as an independent variable because the longer stays have higher reimbursements. Once again, interpreting the significant coefficients, we found that the TOX hospital received $1809 more in reimbursements for an admitted patient than the NONTOX hospital (1809.11, p = 0.000). In general, hospitals received $1695 for each day of hospitalization (1695.12, p = 0.000) with additional $1730 for patients admitted to the ICU (1730.94, p = 0.003). Since the omitted payer category is private insurance, we estimate that privately insured patients generated more reimbursements than Medicaid (− $1675.40, p = 0.008), Medicare (− $1956.76, p = 0.015), and particularly self-paying patients (− $4919.25, p = 0.000).
Patients transferred to a hospital with subspecialty services are generally more complicated, unstable, and thus may have introduced biases resulting in longer length of stays and payments. Therefore, to remove the potential bias introduced by these patients, we repeated the analysis excluding transferred patients. There were 342 transferred patients with complete data. The results for this subsample are presented in Table 4. For this analysis, we limit the interpretation to the TOX and ICU coefficient. After excluding transferred patients, we found the TOX hospital had even greater advantage in shorter length of stay (1.01, p = 0.000). This suggests that the differences in LOS found are independent of transfer status. Excluding transfer patients reduced the payment received per patient to $1299 (1299.22, p = 0.000). Furthermore, payments for ICU care decreased $1456 ($1456.47, p = 0.009). In combination, changes noted in LOS, payment, and ICU estimates suggest that transfers to the TOX hospitals require longer stays and more intensive treatment.
Table 4.
Multivariate linear regression of length of stay and payment excluding transferred patients
| Length of stay | Payment | |||
|---|---|---|---|---|
| Coeff. | p value | Coeff. | p value | |
| TOX | − 1.01 | 0.000 | 1299.22 | 0.000 |
| LOS | 1414.40 | 0.000 | ||
| Age | 0.03 | 0.000 | − 21.43 | 0.103 |
| Black | − 0.39 | 0.125 | − 73.73 | 0.891 |
| Female | − 0.24 | 0.273 | − 827.03 | 0.011 |
| Year | 0.30 | 0.001 | − 100.76 | 0.496 |
| Medicaid | 0.66 | 0.002 | − 1493.77 | 0.000 |
| Medicare | 0.53 | 0.148 | − 753.83 | 0.123 |
| Self-pay | 0.00 | 0.994 | − 4743.38 | 0.000 |
| ICU | 2.02 | 0.000 | 1456.47 | 0.009 |
| Charlson | 0.45 | 0.001 | 202.38 | 0.235 |
| Zip demographics | Yes | Yes | ||
| Distance | Yes | Yes | ||
| R-squared | 0.11 | 0.53 | ||
| N. Obs | 1180 | 1180 | ||
Columns labeled “Coeff.” present the coefficients estimates for the variables included in the multivariate linear regression as described in Eq. (1). Columns labeled “p value” present the p value of the coefficient in the adjacent column. A p value smaller than 0.10 is considered statistically significant in this analysis. ICU intensive care unit. TOX hospital with inpatient medical toxicology service. Length of stay (LOS) is defined as the difference between admission date and discharge date. Payment is the sum of reimbursements received from private and public insurance, patient, and third-party payer. Each specification additionally controls for patient zip code demographics, and distance from patient zip code to hospital
To evaluate if there was an effect of the inpatient service (TOX versus NONTOX) with respect to patients that have prolonged hospital stays, we repeated the analysis by (1) restricting the sample to shorter stay patients (< 10 and 20 days) and (2) additionally, excluding those admitted to the ICU. Results for only the coefficients of interest are presented in Table 5. The estimate for LOS was mostly unchanged when patients with LOS greater than 20 days were excluded, at 0.88 fewer days (− 0.88, p = 0.000); the estimate declined somewhat when patients with LOS of more than 10 days were excluded, to 0.76 fewer days in the TOX hospital (− 0.76, p = 0.000). Additionally, when excluding patients with 20 or longer LOS and those who were admitted to the ICU, the estimate for the TOX gain in LOS increases slightly to 0.93 days (− 0.93, p = 0.000). Thus, there is not a subset of patients with prolonged hospitalizations that biased the results in favor of the TOX hospital.
Table 5.
Multivariate linear regression of length of stay excluding patients with prolonged hospitalizations and patients admitted to intensive care units (ICU)
| LOS 20 days or fewer | LOS 10 days or fewer | LOS 20 days or fewer excluding ICU patients | ||||
|---|---|---|---|---|---|---|
| Coeff. | p value | Coeff. | p value | Coeff. | p value | |
| TOX | − 0.88 | 0.0000 | − 0.76 | 0.0000 | − 0.93 | 0.0000 |
| ICU | 1.67 | 0.0000 | 1.01 | 0.0000 | ||
| Charlson | 0.37 | 0.0000 | 0.17 | 0.0020 | 0.21 | 0.0240 |
| Demographics | Yes | Yes | Yes | |||
| Payer | Yes | Yes | Yes | |||
| Zip demographics | Yes | Yes | Yes | |||
| Distance | Yes | Yes | Yes | |||
| R-squared | 0.15 | 0.15 | 0.21 | |||
| N. Obs | 1497 | 1444 | 1072 | |||
Columns labeled “Coeff.” present the coefficients estimates for the variables included in the multivariate linear regression as described in Eq. (1). Columns labeled “p value” present the p value of the coefficient in the adjacent column. A p value smaller than 0.10 is considered statistically significant in this analysis. ICU intensive care unit. TOX hospital with inpatient medical toxicology service. While only coefficients for TOX, ICU admission, and Charlson index are reported, all regressions also include patient demographic characteristics, payer information, patient zip code demographic characteristics, and distance from patient zip code to hospital. Length of stay (LOS) is defined as the difference between admission date and discharge date
The direct comparison between TOX and NONTOX hospital showed a substantial difference in the tendency to admit to the ICU. To understand how much of this difference can be explained by patient characteristics, we estimate a linear probability model for ICU admission as the outcome. Results are presented in Table 6. Of patient characteristics, we find self-paying patients have six percentage points reduced probability of being admitted to ICU though it is weakly statistically significant (− 0.06 p = 0.070). We also find the probability of admission declines with each passing year in our data (− 0.05, p = 0.000). Despite controlling for these confounders, we find that TOX hospitals is 25 percentage points more likely to admit patients to the ICU than the NONTOX hospital (0.25, p = 0.000), leaving 78% of the variation attributable to unaccounted hospital differences.
Table 6.
Linear probability model of admission to the intensive care unit (ICU)
| ICU | ||
|---|---|---|
| Coeff. | p value | |
| TOX | 0.25 | 0.0000 |
| LOS | 0.02 | 0.0000 |
| Age | 0.00 | 0.0160 |
| Black | − 0.03 | 0.3360 |
| Female | 0.03 | 0.2000 |
| Year | − 0.05 | 0.0000 |
| Medicaid | 0.02 | 0.4920 |
| Medicare | 0.03 | 0.3660 |
| Self-pay | − 0.06 | 0.0700 |
| Charlson | − 0.01 | 0.2320 |
| Zip demographics | Yes | |
| Distance | Yes | |
| R-squared | 0.29 | |
| N. Obs | 1497 | |
Columns labeled “Coeff.” present the coefficients estimates for the variables included in the multivariate linear regression as described in Eq. (1). Columns labeled “p value” present the p value of the coefficient in the adjacent column. A p value smaller than 0.10 is considered statistically significant in this analysis. ICU intensive care unit. TOX hospital with inpatient medical toxicology service. Length of stay (LOS) is defined as the difference between admission date and discharge date. Each specification additionally controls for patient zip code demographics and distance from patient zip code to hospital
Discussion
In this study, we found patients admitted to the TOX hospital were more likely to have shorter LOS and higher total hospital payments than patients admitted to the NONTOX hospital.
To account for patient and case-mix differences, we controlled for visit characteristics including patient demographics, socioeconomic indicators for patient zip code of residence, distance from patient zip code to the hospital, ICU disposition, and comorbidities. We continued to note a shorter LOS at the TOX hospital including and excluding transferred patients, patients with extended LOS, and patients admitted to the ICU. While we were not able to implement an objective illness severity score due to a lack of consistent data, patients at the TOX hospital were admitted to an intensive care setting more often (43.3% versus 11.5%) suggesting that TOX patients had more critical presentations than NONTOX. A portion of this illness severity seems to be accounted for by transferred patients: when transfers were excluded, the ICU admission rate decreased to 35.6%. Our estimates are the lower bound of actual gains in LOS. As a frame of reference for evaluating LOS impact of an inpatient service, hospital medicine models of care provided by hospitalists have become increasingly common since the 1990s motivated primarily by a desire to reduce length of stay and improve efficiency. The estimated reduction in length of stay resulting from a hospitalist versus a non-hospitalist service is 0.4–0.44 days [20, 21]. In our review of an inpatient toxicology service, the improvement in length of stay of 0.87–1.01 days compares favorably to hospitalist models of care in delivering efficient care with additional reductions in LOS.
As expected, older patients, those with higher Charlson comorbidity index scores, and those admitted to critical care units, stayed longer. Medicaid and Medicare patients had longer LOS. Though our analysis controlled for age, Medicare patients are more likely to have more comorbidities and may have experienced different types of poisonings compared to younger patients. Medicaid patients have a lower socioeconomic status, more and poorly controlled comorbidities, worse diets, and worse access to care. Self-pay or uninsured patients are generally younger with fewer comorbidities and fewer financial means. These factors could account for their shorter LOS and lower payments.
Despite the reduction in adjusted LOS, the TOX hospital received more payments than the NONTOX hospital. Although patients were more likely to be admitted to the ICU at the TOX hospital, this did not appear to account for differences in payment. The potential reasons for these findings include focused care resulting in more appropriate charges (and more accurate DRG coding), increased understanding of billing and coding at a hospital accustomed to managing this population of patients consistently, and a reduction in unnecessary charges or expenses that were not reimbursed. That is to say, MTs may provide more itemized care of poisonings and their complications as well as produce documentation that more accurately reflects the complexity of the case allowing for more appropriate reimbursement. Charts generated by MTs may positively affect DRGs and their CMI modifiers, bill at a higher rate and thus receive more payment. Alternatively, higher bills and payments may be due to providers performing more procedures, ordering more tests or may be due to hospital-specific charging practices, which is independent of billing. A markedly higher ICU admission rate may also reflect a population at the TOX hospital suffering more complex and severe illness. This combined with the demonstrated decreased LOS would further support the benefit and expediency of care provided by an inpatient toxicology service. The higher acuity noted may be the result of preferential selection of the TOX hospital by EMS and/or patients due to the existence of specialized services though we attempted to control for this by including distance from the hospital in our analysis.
Since DRGs are inherently the outcome of the treatment process, an analysis of differences in the rates of these in the hospitals would require a side-by-side comparison of the procedures performed by physicians in each hospital. If MTs, as we hypothesize, use a different set of procedures to arrive at a DRG, then the frequency of common procedures will differ across hospitals. Such micro level analysis, however, is beyond the scope of present research and will be part of our future work. Such analysis would allow us to conclude whether the differences are attributable to practice or to billing differences between the hospitals.
While it would have been interesting to compare patients that were treated at the TOX hospital but not under the care of the medical toxicology service, we did not have identifiers of the specialty of the treating physician/care team. Because the majority of admissions came through the emergency department and all the practicing medical toxicologists were emergency physicians, it was expected that the vast majority of poisoned patients were admitted to the toxicology service. Similarly, patients transferred to the TOX hospital for overdose/toxicity were customarily accepted by the medical toxicology service and were notified as the accepting service rather than having been accepted by another service and handed over to the toxicology service after arrival. Any patients not admitted to the toxicology service were likely to have an inconclusive admitting diagnosis (e.g., altered mental status) or other significant comorbidities that were more pressing than any potential poisoning, drug, or substance issue and were likely removed from analysis during the initial chart review.
Overall, we found that primary management of poisoned patients by fellowship-trained and board-certified medical toxicologists resulted in decreased LOS and increased payments when compared to a similar hospital with no inpatient medical toxicology service. The value and efficiency of an inpatient medical toxicology service may translate to improvements in other unmeasured, costly outcomes including nosocomial illness, iatrogenic complications, adverse drug events, and thromboembolism. Prospective evaluation of efficiency, outcomes, and economic value can build upon these findings in order to justify development of regional toxicology referral centers as an important piece in the delivery of value-based healthcare. As the opioid epidemic, addiction, suicide, and drug poisonings in general are becoming increasingly common and represent a national public health emergency, regional medical toxicology referral centers, staffed by MTs, are an important resource. A secondary contribution of this research is the creation of a clinical database of all poisoned patients treated at two hospitals. Data from this database can answer other clinical questions in the field of medical toxicology that require large numbers of patients over extended time frames.
Limitations
Limitations of this study are inherent to the retrospective nature of its data. All differences noted are correlations and the cause of the differences cannot be definitively ascribed to the care of the MTs. While suggestive, all differences are hypothesis-generating and should be followed by prospective studies. Furthermore, retrospective data may be prone to selection bias, misclassification, inherent bias from unblinded chart abstractors, and subject to confounding factors not otherwise identified. Consistent data points were unavailable to apply a validated acute severity or complexity score. While the difference in ICU admission rate would indicate a higher complexity in TOX hospital cases, the difference in groups is not quantified.
We controlled for patient demographic and acuity differences in a number of other ways. To control for preexisting differences in patient populations with respect to comorbidities, income, and socioeconomic status, we used zip code characteristics. We controlled for the possibility that the local population knew about the specialty service at the TOX hospital and chose it over the closer destination using distance from patient zip code of residence to hospital. Similarly, in some analyses, transferred patients were excluded under the assumption that they would require higher levels of care and implicitly, longer hospitalizations, biasing the results in favor of the NONTOX hospital. However, the magnitude and significance of our results did not change substantially between specifications. This suggests that the main findings are robust.
There are multiple factors that affect hospital LOS in poisoned patients. Types and amounts of xenobiotics consumed to cause toxicity, nontoxicologic complications, iatrogenic complications, and nosocomial illness are a few. Especially important in this patient population—with the potential to significantly increase LOS—is availability of psychiatric services and availability of inpatient psychiatric beds. A substantial share of patients hospitalized for intentional overdose require subsequent inpatient psychiatric hospitalization. Unless psychiatric beds are available immediately upon “medical clearance,” patients are likely to remain hospitalized. Both hospitals have dedicated inpatient psychiatric consultation services with on-site or adjacent inpatient psychiatric hospitals. Thus, psychiatric bed availability’s effect on LOS is likely minimal between hospitals.
We were unable to identify readmissions due to methodology of chart selection employed and that all charts were de-identified. Furthermore, while death is an important short-term outcome to assess, we were unable to obtain final disposition (e.g., home, nursing home, death) on a significant proportion of cases. Even so, short-term and/or in-hospital mortality is dependent on too many factors to make meaningful comparisons without controlling for severity of initial presentation and other factors. For example, even if a small number of patients present to a specific hospital after opioid overdoses with severe anoxic brain injury, hospital services provided are unlikely to change outcome and, on first glance, one could erroneously conclude that the higher short-term death rate is due to worse care. Similarly, patients with more acute and severe presentations have a higher mortality rate. If one hospital has a higher acuity rate, either naturally or due to transfers, that hospital would have a higher mortality rate and appear to provide worse care.
The Pittsburgh Poison Center (PPC) offers consultation service available at all times to any healthcare provider. The PPC is under the medical direction and oversight of the same medical toxicologists taking care of the inpatient service. Thus, recommendations for care would be similar to care provided directly. It is unknown how often providers at the NONTOX hospital consulted with the PPC, and specifically with the toxicologist on call, while caring for patients analyzed in this study. Furthermore, a number of the inpatient medical toxicologists work in the ED of the NONTOX hospital. Since much of the evaluation, stabilization, and treatment performed in the emergency department carries over to inpatient care, care by a medical toxicologist in the NONTOX ED may contribute to decreased LOS differences between the two hospitals. MTs staffed the emergency departments roughly equally at both hospitals; thus, the effect of ED care should be minimally contributory to noted differences.
We were unable to incorporate a cost of delivering care versus payments received comparison into our analysis. Per episode cost is not readily available information. In recent years, some hospital systems have used third-party private contractors to identify cost information based on facility, physician, nursing, and material use. Such data is exceedingly difficult to obtain and its accuracy has not been validated in literature. Instead, the Center for Medicare and Medicaid Services (CMS) has generated a hospital level cost estimate as a proportion of charges submitted. This cost-to-charge ratio is available at hospital level only and would not enhance our analysis of two hospitals. Therefore, given the lack of cost information, we are careful to distinguish that our findings reflect increased revenue for the hospital, not profit.
Finally, hospital administration, operations, and “culture” can vary even among hospitals within the same system. Administration at one hospital may more efficiently disposition patients than at another. Staff ratios, laboratory services, support staff such as social workers, complements of medical trainees and their oversight, and subspecialty availability, and response times may vary as well and can contribute to differences in LOS.
Conclusion
Our findings support and recognize the value of MT specialists in providing high-value, expedited care. Incorporating MTs into the hospital medical staff serves the interests of patients and healthcare provider groups. In this retrospective cohort study, patients admitted to a hospital with a medical toxicology service had shorter inpatient length of stay, yet yielded higher hospital reimbursement. Future prospective studies should focus on verifying these findings prospectively and identifying factors that drive the benefit of an inpatient medical toxicology service.
Sources of Funding
This study received the 2013 Medical Toxicology Foundation (MTF) Medical Toxicology Practice Award.
Compliance with Ethical Standards
Conflicts of Interest
None.
Footnotes
Portions of this manuscript were presented at the American College of Medical Toxicology (ACMT) 2015 and 2018 Annual Scientific Meeting in Clearwater, FL.
References
- 1.Rudd RA, et al. Increases in drug and opioid overdose deaths--United States, 2000–2014. MMWR Morb Mortal Wkly Rep. 2016;64(50–51):1378–1382. doi: 10.15585/mmwr.mm6450a3. [DOI] [PubMed] [Google Scholar]
- 2.Suicide. Available at https://www.nimh.nih.gov/health/statistics/suicide.shtml#part_154969. Access 5/21/2018.
- 3.King WD, Palmisano PA. Poison control centers: can their value be measured? South Med J. 1991;84(6):722–6. doi: 10.1097/00007611-199106000-00011. [DOI] [PubMed] [Google Scholar]
- 4.Kearney TE, et al. Health care cost effects of public use of a regional poison control center. West J Med. 1995;162(6):499–504. [PMC free article] [PubMed] [Google Scholar]
- 5.Harrison DL, et al. Cost-effectiveness of regional poison control centers. Arch Intern Med. 1996;156(22):2601–2608. doi: 10.1001/archinte.1996.00440210129013. [DOI] [PubMed] [Google Scholar]
- 6.Miller TR, Lestina DC. Costs of poisoning in the United States and savings from poison control centers: a benefit-cost analysis. Ann Emerg Med. 1997;29(2):239–245. doi: 10.1016/S0196-0644(97)70275-0. [DOI] [PubMed] [Google Scholar]
- 7.Zaloshnja E, et al. The potential impact of poison control centers on rural hospitalization rates for poisoning. Pediatrics. 2006;118(5):2094–2100. doi: 10.1542/peds.2006-1585. [DOI] [PubMed] [Google Scholar]
- 8.Vassilev ZP, Marcus SM. The impact of a poison control center on the length of hospital stay for patients with poisoning. J Toxicol Environ Health A. 2007;70(2):107–110. doi: 10.1080/15287390600755042. [DOI] [PubMed] [Google Scholar]
- 9.Blizzard JC, et al. Cost-benefit analysis of a regional poison center. Clin Toxicol (Phila) 2008;46(5):450–456. doi: 10.1080/15563650701616145. [DOI] [PubMed] [Google Scholar]
- 10.Bunn TL, et al. The effect of poison control center consultation on accidental poisoning inpatient hospitalizations with preexisting medical conditions. J Toxicol Environ Health A. 2008;71(4):283–288. doi: 10.1080/15287390701738459. [DOI] [PubMed] [Google Scholar]
- 11.LoVecchio F, et al. Poison control centers decrease emergency healthcare utilization costs. J Med Toxicol. 2008;4(4):221–4. doi: 10.1007/BF03161204. [DOI] [PMC free article] [PubMed] [Google Scholar]
- 12.Zaloshnja E, et al. The impact of poison control centers on poisoning-related visits to EDs--United States, 2003. Am J Emerg Med. 2008;26(3):310–315. doi: 10.1016/j.ajem.2007.10.014. [DOI] [PubMed] [Google Scholar]
- 13.Galvao TF, et al. Impact of a poison control center on the length of hospital stay of poisoned patients: retrospective cohort. Sao Paulo Med J. 2011;129(1):23–29. doi: 10.1590/S1516-31802011000100005. [DOI] [PMC free article] [PubMed] [Google Scholar]
- 14.Offerman SR. The clinical management of acetaminophen poisoning in a community hospital system: factors associated with hospital length of stay. J Med Toxicol. 2011;7(1):4–11. doi: 10.1007/s13181-010-0115-5. [DOI] [PMC free article] [PubMed] [Google Scholar]
- 15.Austin T, et al. A survey of primary care offices: triage of poisoning calls without a poison control center. Int J Family Med. 2012;2012:417823. doi: 10.1155/2012/417823. [DOI] [PMC free article] [PubMed] [Google Scholar]
- 16.Friedman LS, et al. The association between U.S. Poison Center assistance and length of stay and hospital charges. Clin Toxicol (Phila) 2014;52(3):198–206. doi: 10.3109/15563650.2014.892125. [DOI] [PubMed] [Google Scholar]
- 17.Whyte IM, et al. Health care. A model for the management of self-poisoning. Med J Aust. 1997;167(3):142–146. doi: 10.5694/j.1326-5377.1997.tb138813.x. [DOI] [PubMed] [Google Scholar]
- 18.Lee V, et al. Impact of a toxicology service on a metropolitan teaching hospital. Emerg Med (Fremantle) 2001;13(1):37–42. doi: 10.1046/j.1442-2026.2001.00175.x. [DOI] [PubMed] [Google Scholar]
- 19.Curry SC, et al. Effect of a medical toxicology admitting service on length of stay, cost, and mortality among inpatients discharged with poisoning-related diagnoses. J Med Toxicol. 2015;11(1):65–72. doi: 10.1007/s13181-014-0418-z. [DOI] [PMC free article] [PubMed] [Google Scholar]
- 20.Lindenauer PK, et al. Outcomes of care by hospitalists, general internists, and family physicians. N Engl J Med. 2007;357:2589–2600. doi: 10.1056/NEJMsa067735. [DOI] [PubMed] [Google Scholar]
- 21.Rachoin JS, et al. The impact of hospitalists on length of stay and costs: systematic review and meta-analysis. Am J Manag Care. 2012;18(1):e23–e30. [PubMed] [Google Scholar]