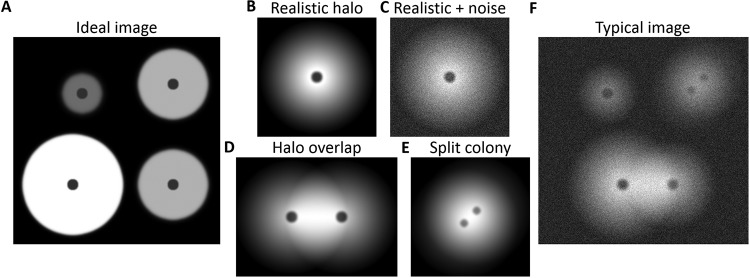
FIG 1.
Illustration of common artifacts in automatic identification of luminescent halos. (A) An ideal image, with clear halo borders. The darker spots in the center of each halo represent the colonies. (B) A more realistic halo, with its values slowly decreasing from the center. This creates soft edges, with very small difference in values between the halo's edge and the background. (C) As described for panel B, but with the addition of noise, which lessens the difference between the halo and the background even further. (D) Two overlapping halos. Notice that the area of overlap is brighter (i.e., has higher values) than the other side of each halo. (E) A split colony, separated into two areas (indicated by the two dark spots). (F) The common result of a colony luminescence assay: the image is noisy, the halo values are gradually decreasing, and both overlaps and split colonies may exist.

