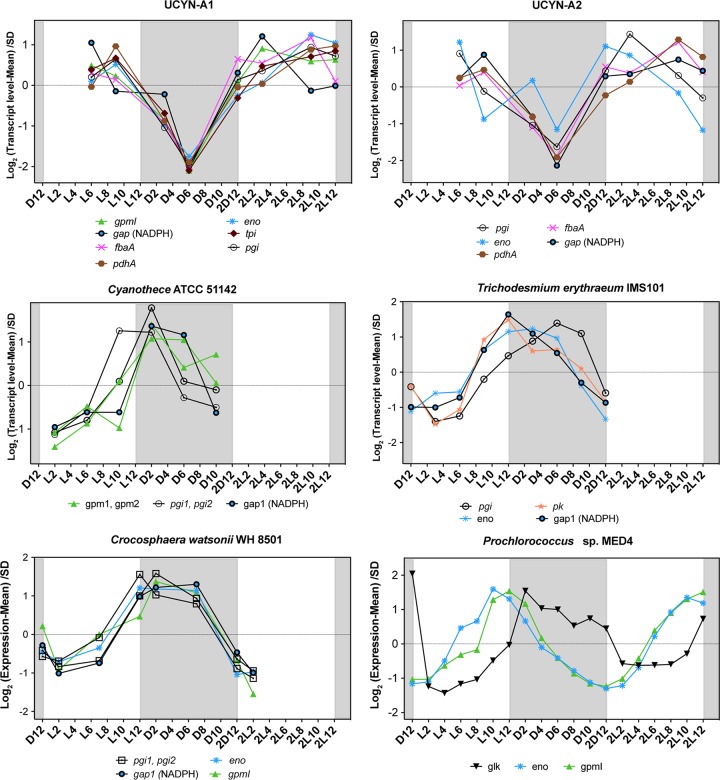
FIG 5.
Transcriptional profiles of the genes for glycolysis over light-dark cycles in the cyanobacteria studied here. The transcription value of each gene at each time point was normalized to the mean at all time points and divided by the standard deviation (SD) (y axis, log scale). The x axis represents time points where “D” and “L” stand for dark and light, respectively, followed by a number corresponding to the hour of entry into the light or dark period. The second light-dark cycle is indicated as “2D” followed by a number corresponding to the hour of entry into the light or dark period. The shaded area represents the dark period.

