Abstract
As a consequence of impaired glucose or fatty acid metabolism, bioenergetic stress in skeletal muscles may trigger myopathy and rhabdomyolysis. Genetic mutations causing loss of function of the LPIN1 gene frequently lead to severe rhabdomyolysis bouts in children, though the metabolic alterations and possible therapeutic interventions remain elusive. Here, we show that lipin1 deficiency in mouse skeletal muscles is sufficient to trigger myopathy. Strikingly, muscle fibers display strong accumulation of both neutral and phospholipids. The metabolic lipid imbalance can be traced to an altered fatty acid synthesis and fatty acid oxidation, accompanied by a defect in acyl chain elongation and desaturation. As an underlying cause, we reveal a severe sarcoplasmic reticulum (SR) stress, leading to the activation of the lipogenic SREBP1c/SREBP2 factors, the accumulation of the Fgf21 cytokine, and alterations of SR–mitochondria morphology. Importantly, pharmacological treatments with the chaperone TUDCA and the fatty acid oxidation activator bezafibrate improve muscle histology and strength of lipin1 mutants. Our data reveal that SR stress and alterations in SR–mitochondria contacts are contributing factors and potential intervention targets of the myopathy associated with lipin1 deficiency.
Keywords: endoplasmic reticulum stress, genetic disease, metabolism, myopathy
Subject Categories: Metabolism, Molecular Biology of Disease, Protein Biosynthesis & Quality Control
Introduction
Skeletal muscle accounts for almost half of the total body mass and energy expenditure and is a major site for fatty acid and glucose oxidation. Genetic mutations leading to alterations of glycolysis, glycogenolysis, lipid oxidation, and mitochondrial respiration impair skeletal muscle functions and cause severe myopathies and rhabdomyolysis (Chan et al, 2015). Loss‐of‐function mutations in genes encoding aldolase, phosphofructokinase, glycogen storage enzymes, CPT1, CPT2, very‐long‐chain acyl‐CoA dehydrogenase, or subunits of cytochrome c oxidase (COX) have been reported to cause myopathies and rhabdomyolysis in humans. In these cases, the metabolic defects can be predicted by the known enzymatic functions of the gene products allowing for the design of the appropriate pharmacological and nutritional interventions to alleviate the energetic deficits. A relatively common genetic origin for rhabdomyolysis in children is the homozygous or heterozygous compound loss‐of‐function mutations of the LPIN1 gene, encoding the lipin1 protein (Michot et al, 2010). However, the metabolic analysis in the blood of lipin1‐deficient patients does not reveal a clear energy stress, as the blood levels of triglycerides, lactate, cholesterol, creatinine, amino acids are normal, together with the rates of fatty acid oxidation (FAO), CPT2 activity, and respiratory complex activities in lymphocytes. The mysterious metabolic origin of the disease contributes to the morbidity, as lipin1 deficiency may be lethal during the rhabdomyolysis bouts.
Lipin1 is a Mg2+‐dependent phosphatidate phosphatase (PAP1) enzyme catalyzing the dephosphorylation of phosphatidic acid (PA), yielding inorganic phosphate and diacylglycerol needed for the synthesis of phospholipids and triacylglycerol (Han et al, 2007; Reue, 2007). In addition, lipin1 has a role in the regulation of gene expression. Lipin1 translocates to the nucleus in conditions of nutrient starvation, while lipin1 phosphorylation by the nutrient‐activated mammalian target of rapamycin (mTOR) kinase leads to retention in the cytosol (Harris & Finck, 2011; Peterson et al, 2011). In the nucleus, lipin1 does not directly bind DNA but interacts with transcriptional factors or co‐activators involved in metabolic gene expression, including peroxisome proliferator‐activated receptor gamma coactivator 1‐alpha (PGC1α), peroxisome proliferator‐activated receptors alpha and gamma (PPARα, PPARγ), nuclear factor of activated T cells (NFAT), and sterol regulatory element‐binding protein 1 (SREBP1). To explain why to date the metabolic origin of the myopathy remained elusive, one possibility is that lipin1 has a minor role in the blood samples and fibroblasts used for routine analysis. Lipin1 is expressed at high levels in white adipose tissue (WAT), liver, and muscle (Donkor et al, 2007) and is also present in other tissues including the peripheral nerve (Nadra et al, 2008). Another possibility is that lipin1 deficiency does not cause major defects in glucose or fatty acid usage in skeletal muscles, but rather affects other physiological responses. The homologous LPIN2 gene is mutated in the Majeed syndrome, an autoinflammatory bone disease, suggesting that lipin1 may also be involved in the inflammatory responses (Ferguson et al, 2005). Moreover, lipin1 deficiency in the fatty liver dystrophy (Lpin1 fld/fld) mutant mice has been reported to alter autophagy flux and aggravate statin‐induced myopathy, concomitant with a shutdown of mTOR activity (Zhang et al, 2014). A thorough metabolic profiling in skeletal muscles should help dissecting these possibilities.
The whole‐body deficiency of lipin1 in mice and rats causes lipodystrophy and innervation defects that are not commonly observed in human patients, possibly due to species‐specific differences in Lipin2 and Lipin3 expression or other compensatory mechanisms (Peterfy et al, 2001; Donkor et al, 2007; Nadra et al, 2008). Conversely in human patients, skeletal muscles and heart disturbances have been exclusively reported (Michot et al, 2010). To get deeper insights into putative muscle cell autonomous roles of lipin1, we generated skeletal muscle‐specific lipin1 deficiency by crossing transgenic mice expressing the Cre recombinase under the human skeletal actin promoter (HSA‐Cre) with lipin1 floxed mice. The myopathy of the mutant mice reveals a severe sarcoplasmic reticulum (SR) stress contributing to lipid accumulation and mitochondrial alterations. Of note, in vivo treatment aiming at ameliorating the unfolded protein response (UPR), such as the chemical chaperone TUDCA, improves the muscle strength of the lipin1‐deficient model.
Results
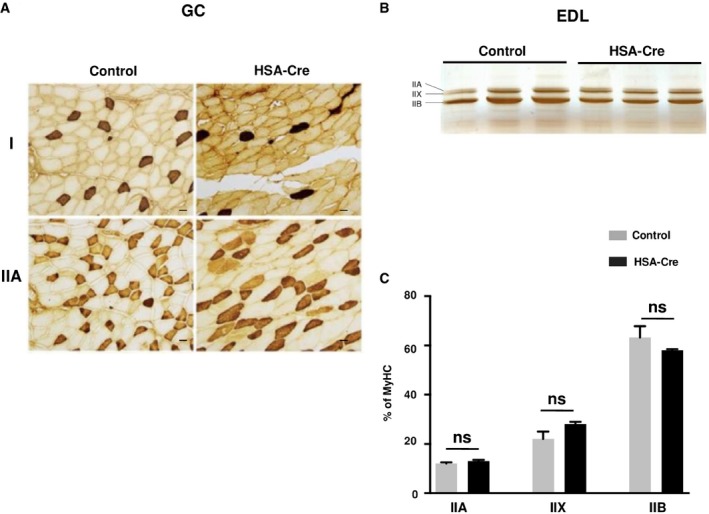
To assess the pathological alterations in skeletal muscles without the confounding effects of whole‐body metabolic disturbances, we generated the skeletal muscle‐specific deletion of the lipin1 gene by crossing Lipin1 floxed/floxed mice with transgenic mice expressing the Cre recombinase under the human skeletal actin promoter (HSA‐Cre; Miniou et al, 1999; Nadra et al, 2008). Lipin1 expression in HSA‐Cre;Lipin1 floxed/floxed mice was decreased by 98% in skeletal muscles while did not differ from Lipin1 floxed/floxed control mice in other organs such as white adipose tissue (WAT; Fig 1A). Recombination at the Lipin1 floxed/floxed locus should delete exons 3 and 4, leading to the expression of a truncated protein lacking PAP1 activity. Accordingly, a truncated lipin1 protein, but not the full length, was detected in muscles from HSA‐Cre;Lipin1 floxed/floxed mice (Fig EV1A). Moreover, the lipin1‐associated PAP1 activity was attenuated in mutant skeletal muscle, while PAP2 activity was increased (Fig 1B). The increased PAP2 activity was likely due to broad specificity phospholipid phosphatase (PLPP), as the expression of PLPP2 mRNA was upregulated in mutant muscles (Fig EV1B). These enzymes mediate lipid signaling and are less involved in the bulk production of phospholipids and triglycerides (Pascual & Carman, 2013). In contrast to the whole‐body lipin1‐deficient mouse model, the weights of the whole body and white adipose tissue were not affected in the muscle‐specific mouse mutant (Fig EV1C). Fasting glucose levels were also equivalent in mutant vs. control mice (Fig EV1D). Of note, the ratio of skeletal muscle vs. total body weight was not decreased in HSA‐Cre;Lipin1 floxed/floxed mice (Fig 1C). This was confirmed by measurements of cross‐sectional areas (CSA) (Fig EV1E). Our data are consistent with the lack of muscle atrophy in LPIN1‐deficient human patients. However, histological analysis also revealed profound pathological alterations with fiber necrosis, degeneration, and regeneration as evidenced by centronucleated fibers, fibrosis, immune cell infiltration, and immunoglobulin detection (Figs 1D and EV1F and G). These changes were not accompanied by effects on fiber type composition (Fig EV2). Of note, the normalized force of gastrocnemius (GC) muscle in vivo showed a significant impairment in force production at all stimulation frequencies in 3‐month‐old mutant mice as compared to control animals (Fig 1E). Taken together, our data reveal a severe myopathy after specific deletion of lipin1 in murine skeletal muscles, thus providing a useful tool for assessing direct lipin1 action on muscle function and metabolism.
Figure 1. HSA‐Cre mice develop myopathy.
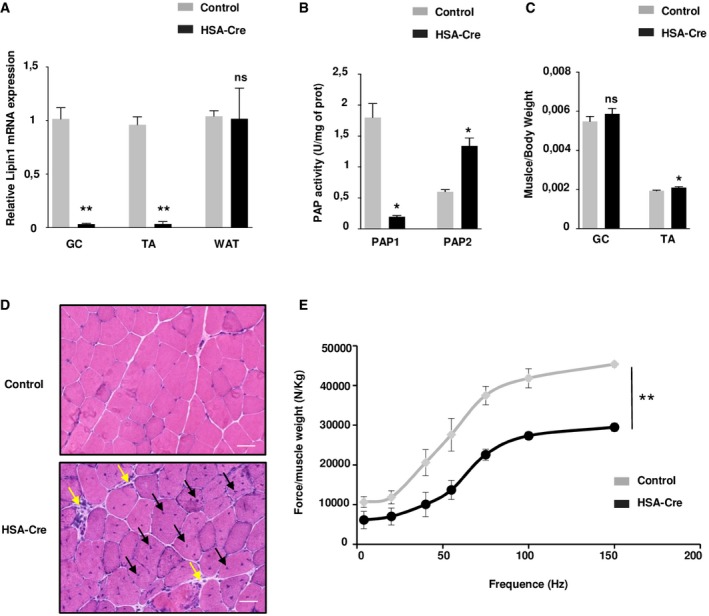
- Quantitative RT–PCR shows that Lpin1 expression is depleted in the skeletal muscles gastrocnemius (GC) and tibialis anterior (TA), but not in white adipose tissue (WAT) from 3‐month‐old HSA Cre/+ /Lpin1 fEx2‐3/fEx2‐3 mice (HSA‐Cre) compared to control mice. Expression levels are corrected for expression of the control gene Pinin and presented in the graph as fold change relative to control mice. Data are mean ± SEM (n = 5; **P < 0.01).
- PAP1 and PAP2 activities were, respectively, substantially decreased and increased in TA, of HSA‐Cre mice as compared to control mice, respectively. Data are mean ± SEM (n = 6; *P < 0.05).
- Measurements of muscle/body weight ratio of GC and TA of 3‐month‐old HSA‐Cre and control mice. Data are mean ± SEM (n = 6; *P < 0.05).
- Hematoxylin and eosin (HE) staining of representative transverse sections of GC muscles from 3‐month‐old HSA‐Cre and control mice. The black arrows indicate fibers with centrally located nuclei, and yellow arrows indicate mononuclear cell infiltration. Scale bars: 40 μm.
- Relative force measurements after normalization of absolute tetanic force to GC muscle weight from 3‐month‐old HSA‐Cre and control male mice. Data are mean ± SEM (n = 3; **P < 0.01).
Figure EV1. Fiber damage of lipin1‐deficient muscles.
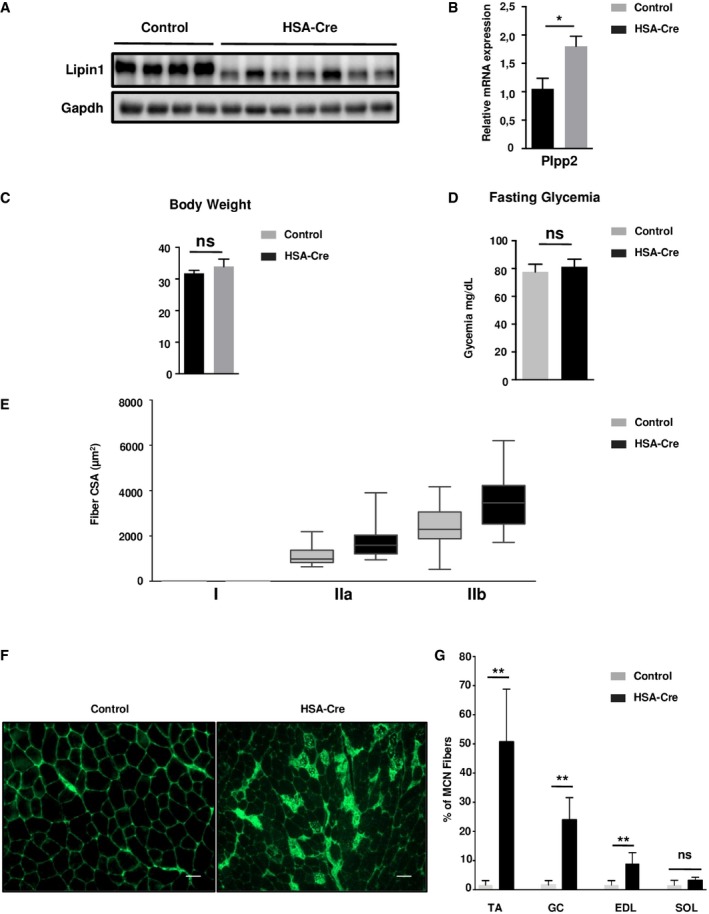
- Immunoblot analysis of lipin1 in GC muscle of 4‐month‐old HSA‐Cre and control mice. This experiment was simultaneously run with experiments in Figs EV1F, EV2A and EV2B, and the same loading control was used.
- Quantitative RT–PCR measurement of Plpp2 expression in GC muscle of 4‐month‐old HSA‐Cre (n = 7) and control (n = 4) mice (*P < 0.05).
- Body weight of 4‐month‐old HSA‐Cre and control mice (n = 5).
- Fasting glycaemia of 4‐month‐old HSA‐Cre and control mice (n = 5).
- Distribution of fiber CSA measurement for each fiber type of TA from 4‐month‐old HSA‐Cre and control mice (n = 3). Boxes represent the median (horizontal line), and interquartile range (box limits). Whiskers indicate the minimum and maximum values.
- Representative staining of IgG‐positive fibers on frozen sections of TA of 4‐month‐old control, HSA‐Cre and control mice. Scale bars: 20 μm.
- Determination of the percentage of multicentronucleated (MCN) fibers in TA, GC, EDL, and SOL muscles from 3‐month‐old HSA‐Cre and control mice (n = 4; **P < 0.01).
Figure EV2. Fiber type of lipin1‐deficient muscles.
-
AHistological analysis of GC by immunohistochemistry for slow (type I) and fast (type IIA). Scale bars: 40 μm.
-
B, CPanel (B) represents an electrophoretic separation of myosin heavy chain (MyHC) isoforms (IIA, IIB, IIX) in extensor digitorum longus (EDL) skeletal muscle from HSA‐Cre and control mice. Panel (C) represents the quantification of the gels in panel (B) (n = 3). Two‐tailed Student's t‐test was used for statistical analysis. Data are expressed as means ± SEM.
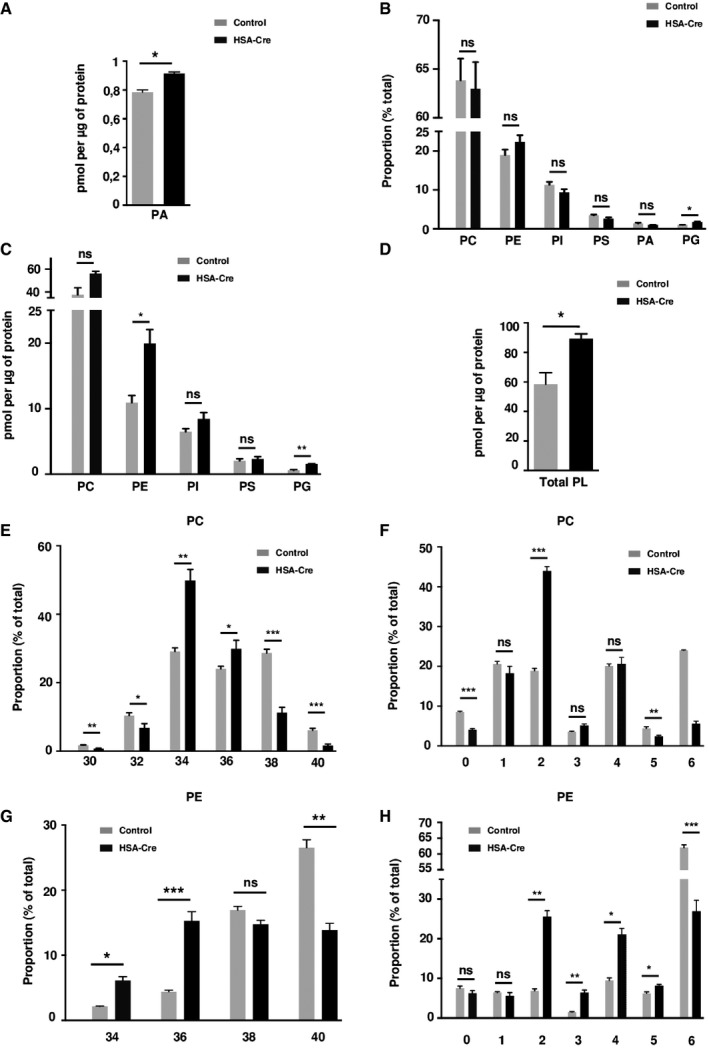
Lipin1 is a major regulator of lipid homeostasis at the crossroad of triglyceride and phospholipid biosynthesis, due to its PAP catalytic activity (Santos‐Rosa et al, 2005). In addition, as a transcriptional coregulator, lipin1 may promote gene expression programs of lipogenesis or FAO, depending on the target transcription factor (Harris & Finck, 2011). The alterations of lipid homeostasis in the lipin1‐deficient syndrome may therefore be complex and tissue specific. We first evaluated the levels of the PAP substrate phosphatidic acid (PA) in muscle whole cell extracts. The absolute PA levels were only slightly increased by 25% in lipin1‐deficient GC and TA muscles as compared to wild‐type controls (Figs 2A and EV3A). In addition, the overall phospholipid composition was similar (Figs 2B and EV3B). However, the absolute levels of phosphatidylcholine (PC), phosphatidylethanolamine PE, phosphatidylinositol (PI), and phosphatidylglycerol (PG) were sharply increased (Figs 2C and EV3C). Consequently, the total phospholipid levels were increased by 70% in mutant muscles (Figs 2D and EV3D). We also noted a striking change in the acyl chain composition of phospholipids. PC and PE in mutant muscles were composed by acyl chains with lower number of carbon atoms and double bonds as compared to controls (Figs 2E–H and EV3E–H). Thus, our data in skeletal muscles are consistent with the first description of the lipin1 orthologue PAH1/SMP2 mutant in yeast (Santos‐Rosa et al, 2005), demonstrating increased phospholipid biosynthesis.
Figure 2. Phospholipidome in HSA‐Cre mice muscles.
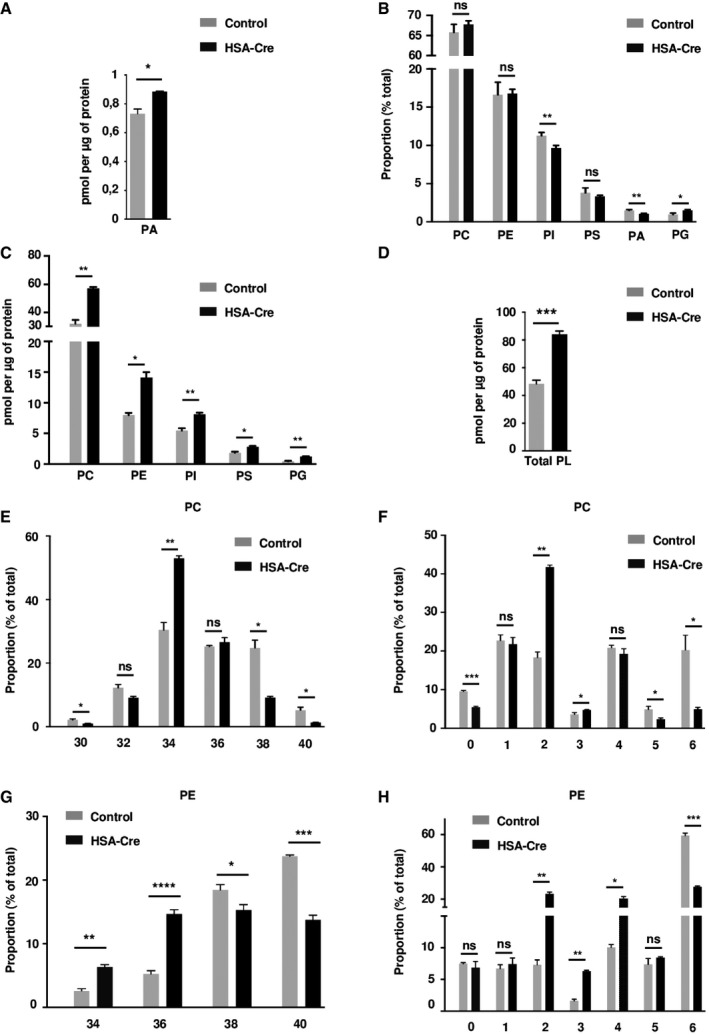
- Phosphatidic acid (PA) levels in HSA‐Cre and control GC muscles.
- Phospholipidome in HSA‐Cre and control GC muscles. Proportions of indicated phospholipid classes in total phospholipids are represented. PC, phosphatidylcholine; PE, phosphatidylethanolamine; PI, phosphatidylinositol; PS, phosphatidylserine; PA, phosphatidic Acid; PG, phosphatidylglycerol.
- Amounts of indicated phospholipid classes normalized by protein content in HSA‐Cre and control GC muscles.
- Total phospholipid (PL) amount normalized by protein content in HSA‐Cre and control GC muscles.
- Distribution of the total carbon number in acyl chains of PC in HSA‐Cre and control GC muscles.
- Distribution of the number of double bonds in acyl chains of PC in HSA‐Cre and control GC muscles.
- Distribution of the total carbon number in acyl chains of PE in HSA‐Cre and control GC muscles.
- Distribution of the number of double bonds in acyl chains of PE in HSA‐Cre and control GC muscles.
Figure EV3. Phospholipidome in HSA‐Cre mice muscles.
- PA levels in HSA‐Cre and control TA muscles.
- Phospholipidome in HSA‐Cre and control TA muscles. Proportions of indicated phospholipid classes in total phospholipids are represented. PC, phosphatidylcholine; PE, phosphatidylethanolamine; PI, phosphatidylinositol; PS, phosphatidylserine; PA, phosphatidic Acid; PG, phosphatidylglycerol.
- Amounts of indicated phospholipid classes normalized by protein content in HSA‐Cre and control TA muscles.
- Total phospholipid (PL) amount normalized by protein content in HSA‐Cre and control TA muscles.
- Distribution of the total carbon number in acyl chains of PC in HSA‐Cre and control TA muscles.
- Distribution of the number of double bonds in acyl chains of PC in HSA‐Cre and control TA muscles.
- Distribution of the total carbon number in acyl chains of PE in HSA‐Cre and control TA muscles.
- Distribution of the number of double bonds in acyl chains of PE in HSA‐Cre and control TA muscles.
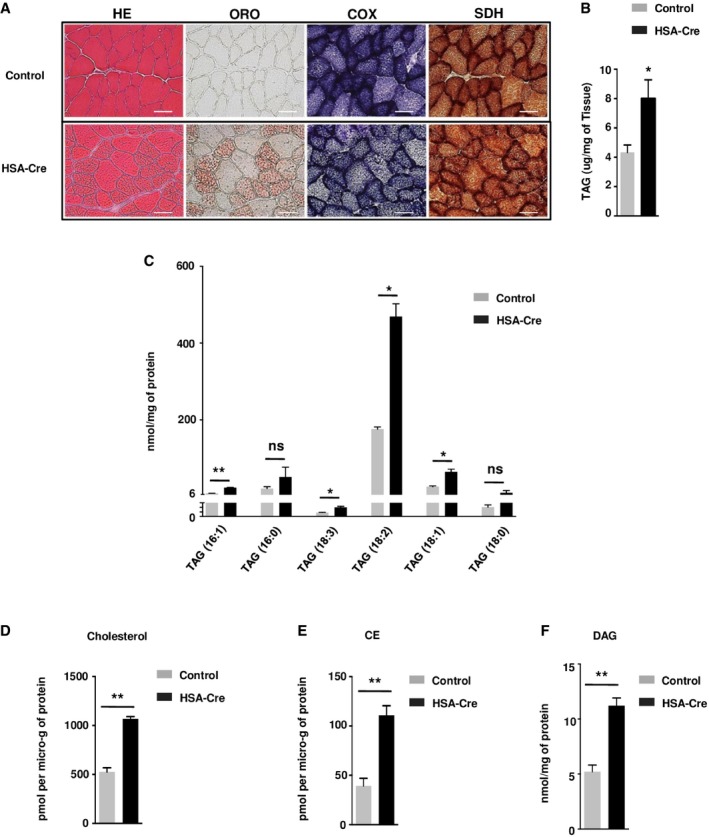
Next, we asked whether the up‐regulation of phospholipid synthesis in lipin1‐deficient muscles was at the expense of neutral lipids. First, we performed Oil Red O staining of triglycerides and cholesterol esters in soleus muscles. As indicated in Fig 3A, lipin1‐deficient skeletal muscles displayed a sharp increase in lipid droplets especially in oxidative fibers, as assessed by succinate dehydrogenase (SDH) and cytochrome c oxidase (COX) activity staining. The neutral lipids accumulating in lipin1‐deficient muscles were triglycerides (TAG), cholesterol, and cholesterol esther (CE), as detected by biochemical analysis and mass spectrometry (Fig 3B–E). Of note, diacylglycerol, a precursor of both TAG and phospholipid biosynthesis, was also increased in mutant muscle (Fig 3F), thus providing a possible explanation for the accumulation of both neutral‐ and phospholipids.
Figure 3. Dysregulation of lipid metabolism in HSA‐Cre mice muscles.
-
AHE, Oil Red O (ORO), cytochrome c oxidase (COX), and succinate dehydrogenase (SDH) staining of representative frozen sections of TA muscle from 3‐month‐old HSA‐Cre and control mice. Scale bars: 40 μm.
-
BQuantification of triacylglycerol (TAG) levels in GC muscles from 3‐month‐old HSA‐Cre and control mice. Data are mean ± SEM (n = 5; *P < 0.05).
-
C–F(C) Content of TAG, (D) cholesterol, (E) cholesteryl ester (CE), (F) DAG was assessed by MS in HSA‐Cre and control GC muscles. Data are mean ± SEM (n = 3; *P < 0.05, **P < 0.01).
The alterations in lipid amounts were accompanied by a lipogenic gene expression program, as shown by the increased levels of fatty acid synthase (Fasn), ATP citrate lyase (Acly), thyroid hormone‐inducible hepatic protein (Thrsp), angiopoietin‐like protein 4/fast‐induced adipose factor (ANGPTL4/Fiaf), insulin‐induced gene 1 (Insig1), and peroxisome proliferator‐activated receptor gamma (PPARγ) mRNA or protein (Fig 4A and B). Conversely, medium‐chain specific acyl‐Coenzyme A dehydrogenase (Mcad) and carnitine palmitoyltransferase 1B (Cpt1b) mRNAs involved in FAO were down‐regulated in mutant muscles (Fig 4C). The up‐regulation of Fasn and Insig1 target genes (Fig 4A) is a typical sign of sterol regulatory element‐binding protein (SREBP) activation (Yecies et al, 2011). SREBP1c and SREBP2 are ER‐resident transcription factors that are activated by N‐terminus cleavage in the Golgi in pro‐lipogenic conditions (Brown & Goldstein, 1997). By immunoblot analysis, we revealed cleavage of both SREBP1c and SREBP2 in lipin1‐deficient muscles (Fig 4D). Taken together, our data demonstrate that the absence of lipin1 in skeletal muscle turns on an SREBP‐dependent program promoting storage of lipids, while impairing FAO gene expression.
Figure 4. Lipogenic gene expression program in HSA‐Cre mice muscles.
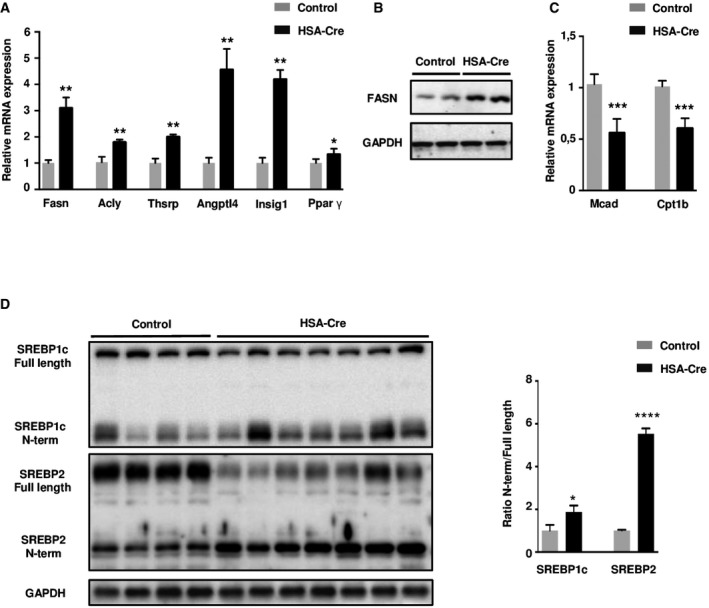
- Quantitative RT–PCR detection of the level of expression of fatty acid synthase (Fasn), ATP citrate lyase (Acly), thyroid hormone‐inducible hepatic protein 1 (Thrsp1), angiopoietin‐like protein 4/fast‐induced adipose factor (ANGPTL4/Fiaf), insulin‐induced gene 1 (Insig1), and peroxisome proliferator‐activated receptor gamma (PPARg) in TA from 3‐month‐old HSA‐Cre and control mice. Expression levels are corrected for expression of the control gene Pinin and presented in the graph as fold change relative to control mice. Data are mean ± SEM (n = 5; *P < 0.05, **P < 0.01).
- Immunoblot analysis of Fasn in TA muscle of 3‐month‐old HSA‐Cre and control mice.
- Quantitative RT–PCR measurement of carnitine palmitoyltransferase 1B (Cpt1b) and medium‐chain acyl‐CoA dehydrogenase (Mcad) in TA from 3‐month‐old HSA‐Cre and control mice. Data are mean ± SEM (n = 5; ***P < 0.001).
- Immunoblot analysis of full length and N‐terminal SREBP1c and SREBP2 protein levels in GC muscle of 4‐month‐old HSA‐Cre and control mice (n = 7 and n = 4, respectively). The ratio of the densitometric assay of the N‐term and full length forms is presented. Data are mean ± SEM (*P < 0.05, ****P < 0.0001).
To further elucidate the enigmatic metabolic origin of the lipin1‐deficient myopathy, tissue extracts were analyzed by liquid chromatography (LC) tandem mass spectrometry (MS/MS). The method allowed the identification of 125 small metabolites with a broad representation of metabolic pathways. The steady‐state levels of 30 metabolites were significantly altered in lipin1‐deficient GC muscles relative to controls (Fig 5A). Of note, phospholipid precursors such as glycerol 3‐phosphate, O‐phosphoethanolamine, CMP, and CTP were markedly increased in lipin1‐deficient muscles (Fig 5B). Free fatty acids, including linoleic acid (C18:2) and the pro‐inflammatory arachidonic acid (C20:4), were also increased in the mutant muscles, possibly due to the action of phospholipases. The Pyruvate/Acetyl‐CoA and the Pyruvate/Citrate ratios were lowered in lipin1‐deficient muscles, while the Pyruvate/Lactate ratio was similar to the control, indicating a flow of glycolysis intermediates toward lipid synthesis in the mutant genotype (Fig 5C). Of note, muscle energy homeostasis was not affected, as assessed by AMP, ADP, ATP, and phospho‐creatine levels (Fig 5B and C).
Figure 5. Metabolomics analysis of HSA‐Cre muscles.
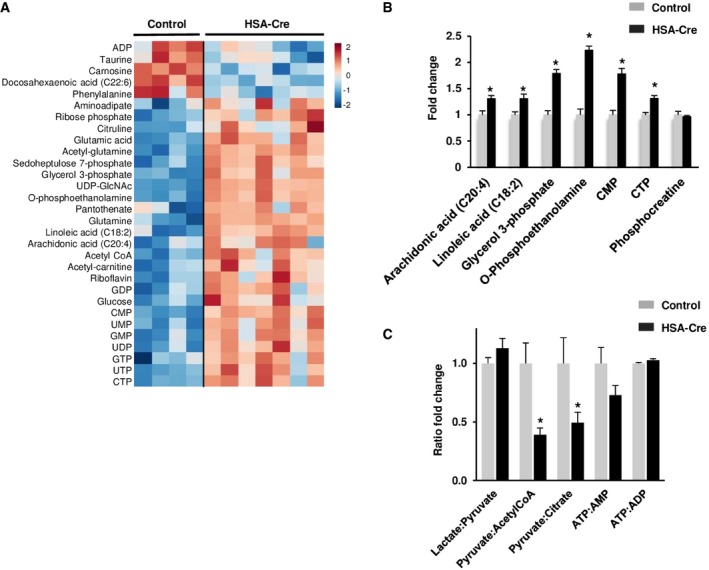
- Metabolomics profile of GC muscle of 4‐month‐old HSA‐Cre (n = 7) and control (n = 4) mice presented as heatmap visualization and hierarchical clustering analysis of compounds with P ≤ 0.05, Student's t‐test (see Materials and Methods for details). Rows: metabolites; columns: samples; color key indicates metabolite expression value (blue: lowest; red: highest).
- Fold change of phospholipid precursors in GC muscles of 4‐month‐old HSA‐Cre (n = 7) and control (n = 4) mice measured by liquid chromatography (LC) tandem mass spectrometry (MS/MS) (*P < 0.05).
- Fold change of Lactate/Pyruvate, Pyruvate/Acetyl‐CoA, Pyruvate/Citrate, ATP/AMP, and ATP/ADP ratios in GC muscles of 4‐month‐old HSA‐Cre (n = 7) and control (n = 4) mice (*P < 0.05).
To explain the cause of SREBP cleavage and the concomitant accumulation of both neutral‐ and phospholipids, we evaluated the stress of the endoplasmic reticulum (ER), named sarcoplasmic reticulum (SR) in skeletal muscle. The ER stress leads to the unfolded protein response (UPR), through the activation of the Xbp1 and Atf6 transcription factors controlling the expression of protein chaperones, such as Bip (Malhotra & Kaufman, 2007). A third branch of the UPR is the phosphorylation of the eIF2α translation initiation factor, leading to a general shutdown of protein synthesis while up‐regulating the Atf4‐C/EBP homologous protein (CHOP) axis. Interestingly, cytosolic lipin1 and SREBP proteins are mainly localized in the ER membrane, the site of triglyceride and phospholipid synthesis (Brown & Goldstein, 1997; Santos‐Rosa et al, 2005). We therefore asked whether lipin1 deficiency triggered ER stress in skeletal muscles. The active forms of Xbp1 and Atf6, respectively, the spliced Xbp1 and cleaved Atf6, were more abundant in mutant muscles as compared to control, while the effect on phosphorylated eIF2a and CHOP was minor (Figs 6A and EV4A). Consistently, the protein chaperones Bip and Hsp90b1 were induced together with the ER degradation‐enhancing alpha‐mannosidase‐like protein 1 (Edem1) and the cytokines Gdf15 and Fgf21 (Figs 6A and B, and EV4A and B). Of note, the latter is a target of the Atf6/Atf4 family of transcription factors and an important biomarker of myopathy conditions characterized by ER stress, mitochondrial fission, and respiratory defects (Suomalainen & Battersby, 2018). Our analysis of circulating Fgf21 levels in mouse plasma also revealed a 37% increase in lipin1 mutants as compared to controls (Fig EV4C).
Figure 6. Lipin1 deficiency triggers an ER stress in muscles and leads to Unfolded Protein Response activation.
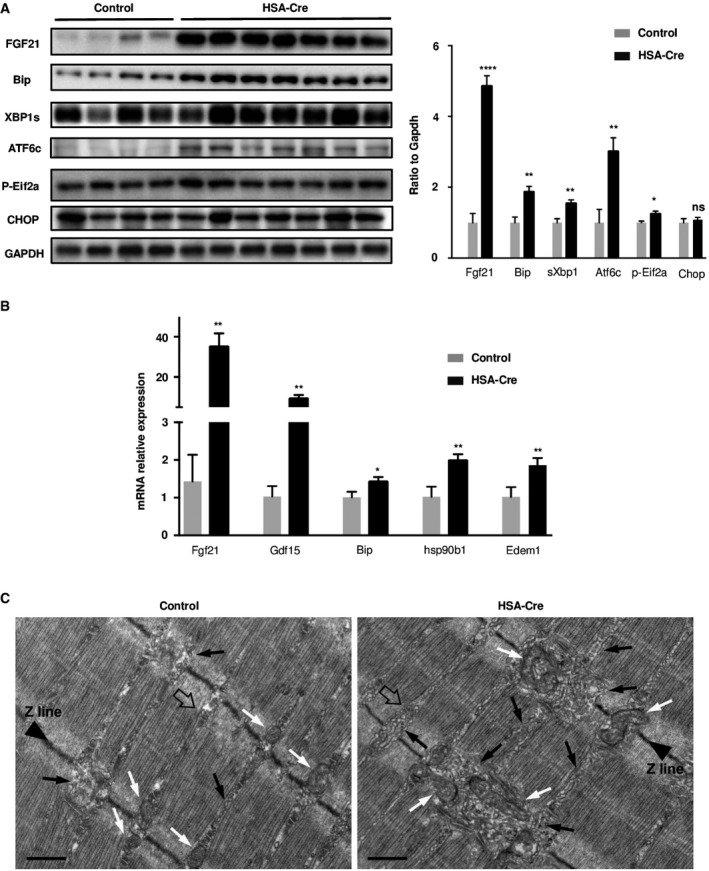
- UPR activation was analyzed by immunoblotting with indicated antibodies in GC muscles of 4‐month‐old HSA‐Cre (n = 7) and control (n = 4) mice. Quantification by densitometric analyses of Fgf21, Bip, sXbp1 Atf6 cleaved form, p‐Eif2a, and Chop protein levels is presented as a graph. Data are normalized to Gapdh and expressed as a fold change relative to the control mice. Data are mean ± SEM (*P < 0.05, **P < 0.01, ****P < 0.0001).
- Quantitative RT–PCR measurement of Fgf21, Gdf15, Bip/Grp78, hsp90b1, and Edem1 in GC muscles from 4‐month‐old HSA‐Cre (n = 7) and control (n = 4) mice. Data are mean ± SEM (*P < 0.05, **P < 0.01).
- EM analysis of EDL fibers of HSA‐Cre mice revealed the presence of areas in which the non‐junctional SR is more vesiculated and fragmented compared to control (black arrows). Remodeling of the SR is also accompanied by modification in the positioning of mitochondria (white arrows). A representative Calcium Release Unit (CRU) is indicated (empty arrow). Scale bars: 0.50 μm.
Figure EV4. Unfolded Protein Response activation in TA .
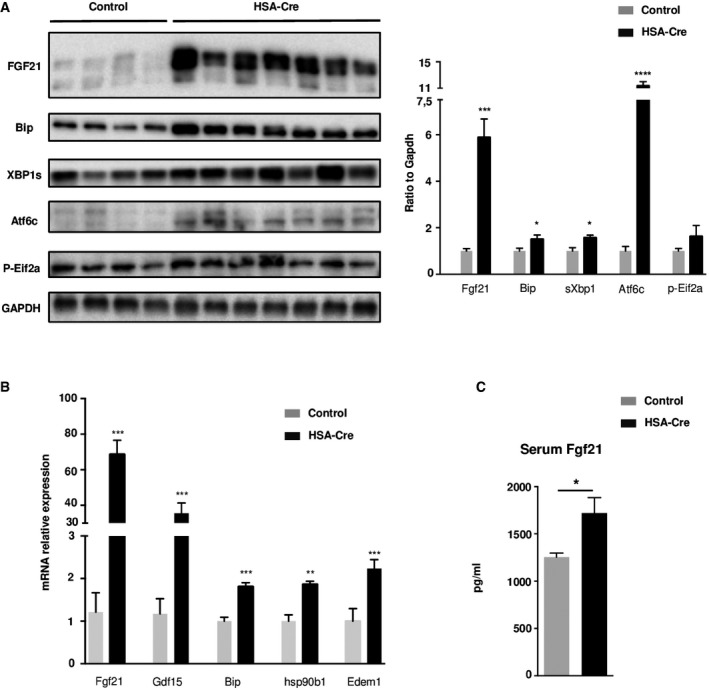
- UPR activation was analyzed by immunoblotting with indicated antibodies in TA muscles of 4‐month‐old HSA‐Cre (n = 7) and control (n = 4) mice. Quantification by densitometric analyses of Fgf21, Bip, sXbp1 Atf6 cleaved form, and p‐Eif2a protein levels is presented as a graph. Data are normalized to Gapdh and expressed as a fold change relative to the control mice. Data are mean ± SEM (*P < 0.05, ***P < 0.001, ****P < 0.0001).
- Quantitative RT–PCR measurement of Fgf21, Gdf15, Bip/Grp78, hsp90b1, and Edem1 in TA muscles from 4‐month‐old HSA‐Cre and control mice. Data are mean ± SEM (n = 4; **P < 0.01, ***P < 0.001).
- FGF21 plasma levels in HSA‐Cre (n = 7) and control (n = 5) mice were determined by ELISA. Data are mean ± SEM (*P < 0.05).
To visualize the alterations in the SR, electron microscopy (EM) was initially performed in extensor digitorum longus (EDL), a muscle containing predominantly fast twitch fibers (Fig 6C). This analysis revealed the presence, in EDL fibers of lipin1‐deficient mice, of areas in which the non‐junctional SR was more vesiculated and fragmented compared to control (black arrows in Fig 6C). To verify whether this modification resulted in changes in SR volume, we calculated the relative fiber volume occupied by non‐junctional SR: 18.6 ± 6.2% vs. 5.9 ± 1.7%, respectively, in lipin1‐deficient and control muscles. This finding was consistent with the increased phospholipid amount (Fig 2D). Remodeling of the SR was also accompanied by modification in the morphology and positioning of mitochondria, which in control fibers were almost exclusively positioned in close proximity of Z lines, while in lipin1‐deficient fibers they were often elongated at the A band, or clustered in an abnormal fashion (white arrows in Fig 6C). The structure of the Calcium Units was not altered, though their orientation was occasionally distorted by the amplification of the SR volume (Fig EV5A). Next, EM analysis was extended to soleus muscle, containing predominantly slow twitch fibers (Fig EV5B). Consistent with Oil Red O staining, lipid droplets were particularly abundant in slow twitch lipin1 mutant fibers (Fig EV5B, middle panel). Their presence also contributed to a severe disorganization of the SR and mitochondrial regions. In addition, increased numbers of abnormally enlarged mitochondria were evident along muscle fibers. Finally, few degenerating fibers with areas of myofibrillar disruption and Z line streaming were present in lipin1 mutant soleus muscles (Fig EV5B, right panel). Taken together, our data suggest that the alterations of SR volume and mitochondrial contacts may be important pathogenic mechanisms in the lipin1‐deficient myopathy in both types of fibers.
Figure EV5. Electron microscopy in EDL and Soleus.
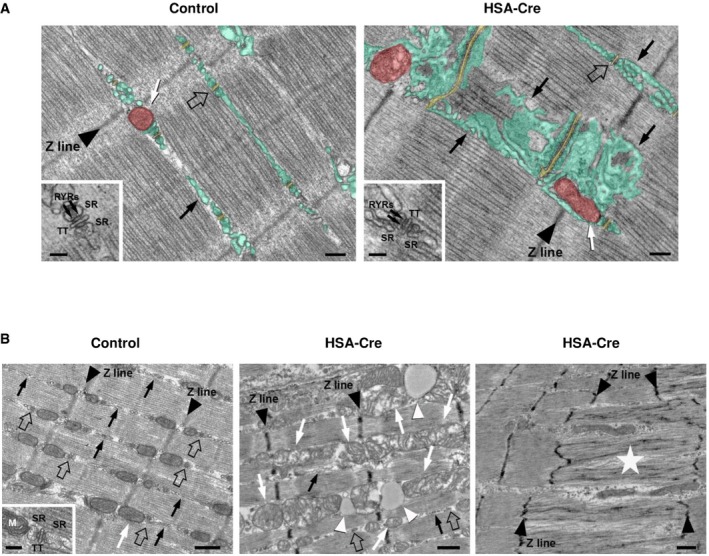
- EM analysis revealed than lipin1‐deficient EDL fibers present an increase in the non‐junctional SR volume (green), while the structure of CRUs is still normal, i.e., triads with two SR and one central T‐tubule (TT) (empty arrows and insets). SR terminal cisternae bear two rows of ryanodine receptor (RYR) feet (arrows in insets). Finally, remodeling of the SR is also accompanied by modification in the positioning and shape of mitochondria, which in control fibers are almost exclusively positioned in close proximity of Z lines, while in lipin1‐deficient (HSA‐Cre) fibers they are often elongated at the I band (white arrow). Color legend: SR is marked in light green, TT in light yellow and mitochondria in light red. Bars, control and HSA‐Cre: 0.20 μm; insets: 0.10 μm. The black arrow refers to the SR.
- In soleus fibers of control mice myofibrils are fairly aligned with one another (see Z lines pointed by arrowheads), triads are correctly positioned at the transition between I and A bands (a few of them pointed by empty arrows) in proximity of mitochondria (white arrows). The inset shows a triad next to a mitochondria. Soleus fibers from lipin1‐deficient mice display severe alterations (center panel): a) lipid droplets (white arrowheads); and b) mitochondrial swelling and damage (white arrows). (Right panel) A small portion of fibers present areas of Z line streaming (portion of the fiber indicated by white star, between the four arrowheads pointing to Z lines). Scale bars, control and HSA‐Cre: 0.50 μm; insets: 0.10 μm. The black arrow refers to the SR.
To specifically address mitochondrial function in fast twitch muscles, the mitochondrial DNA amount was quantified by quantitative PCR in GC and TA muscles (Fig 7A). Lipin1‐deficient muscles had a dramatic reduction in mitochondrial DNA relative to the controls. This resulted in decreased expression of mitochondria‐encoded genes, while the mRNA levels of mitochondrial proteins from nuclear‐encoded genes were unchanged (Fig 7B). Despite these differences at the DNA and mRNA level, immunoblot analysis did not reveal changes in the mitochondrial protein amount (Appendix Fig S1A). Moreover, polarography experiments in isolated mitochondria demonstrated that respiratory complex I to V activity was equivalent in mutant vs. control samples (Appendix Fig S1B). There was a slight decrease in glycerol 3‐phosphate quinone dichlorophenol indophenol reductase activity (GQDR; Appendix Fig S1C), corresponding to the mitochondrial glycerol‐3‐phosphate dehydrogenase enzyme (GPD2). Mass spectrometry also indicated that glycerol 3‐phosphate ratio to dihydroxyacetone phosphate (DHAP) was higher in mutant lipin1‐deficient mouse muscles (Appendix Fig S1D). This defect in glycerol‐3‐phosphate dehydrogenase activity was at least in part due to a 28% reduction in GPD2 levels, as assessed by immunoblot analysis (Appendix Fig S1E). The relative sparing of complex I to V respiratory activities was consistent with the preservation of high energy phosphates in lipin1 mutants (Fig 5B and C) and the phosphorylation of AMP‐activated kinase (AMPK) and its substrate acetyl‐coA carboxylase (ACC; Appendix Fig S1F). Moreover, lipin1‐deficient muscles did not present an increase in carbonylated proteins, a marker of reactive oxygen species (ROS) production (Appendix Fig S1G). Taken together, our characterization of mitochondrial function in GC muscles did not support a general alteration of respiratory capacity in fast twitch lipin1 mutant muscles but rather a selective loss of mitochondrial nucleoid integrity and in the glycerol 3‐phosphate–DHAP shuttling system.
Figure 7. mtDNA levels and mitochondrial morphology are impaired in HSA‐Cre muscles.
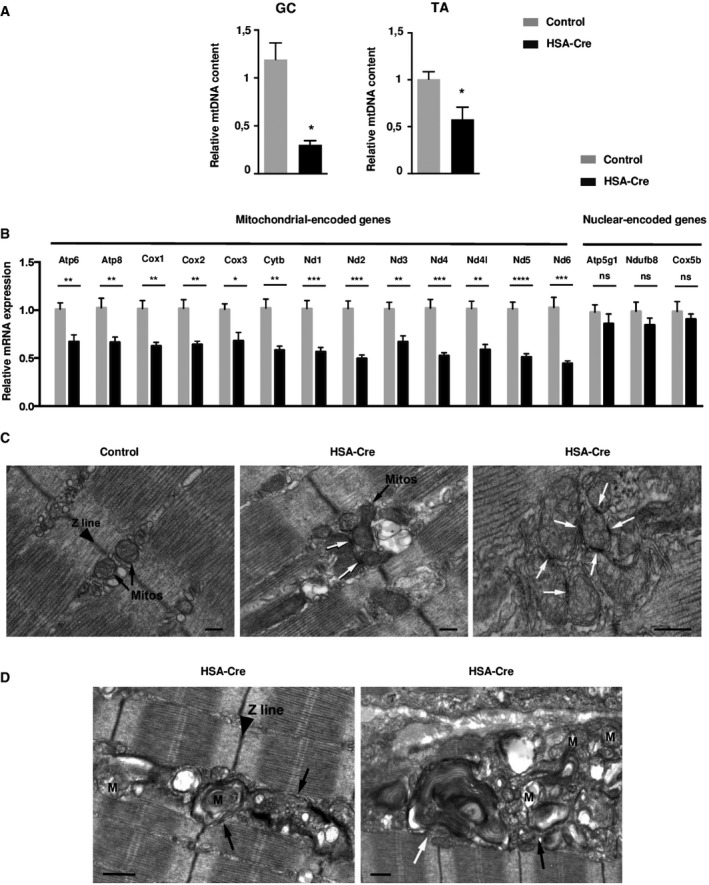
- The relative mtDNA copy number was determined by the ratio of mitochondrial DNA‐encoded cytochrome B (CytB) and nuclear‐encoded NADH dehydrogenase (ubiquinone) flavoprotein 1 (Ndufv1) genes in GC and TA from HSA‐Cre and control mice. Data are mean ± SEM (n = 4; *P < 0.05).
- Mitochondria‐encoded gene and nuclear‐encoded gene expression levels by quantitative RT–PCR in GC muscles from 4‐month‐old HSA‐Cre (n = 7) and control (n = 4) mice. Data are mean ± SEM (*P < 0.05, **P < 0.01, ***P < 0.001, ****P < 0.0001).
- Electron micrographs of HSA‐Cre EDL muscles of 3‐month‐old mice showed that mitochondria are almost exclusively positioned at the two sides of Z lines in EDL fibers from control mice (black arrows). On the other hand, in lipin1‐deficient EDL fibers mitochondria are more often clustered and display electron‐dense contact sites (white arrows). Scale bars: 0.20 μm.
- Ultrastructural analysis of HSA‐Cre EDL muscles revealed the presence of numerous autophagic vacuoles of different morphologies (autophagosomes and lysosomes, black arrows; multilamellar bodies, white arrow) containing amorphous material and possibly degraded mitochondria (M). Scale bars: 0.50 μm.
Interestingly, EM analysis showed that in the great majority (about 70%) of lipin1‐deficient EDL fibers, the contact sites of mitochondria grouped in clusters were often very narrow and electron‐dense (white arrows in Fig 7C). These dark contact sites likely represent the early stage of mitochondrial fragmentation (Yoon et al, 2003). This effect was accompanied by a slight up‐regulation of Mitofusins and dynamin‐related protein 1 (Drp1), GTPases involved in mitochondrial outer membrane fusion and fission, respectively (Appendix Fig S2A). Since these proteins are known to localize at ER‐mitochondria interface, their up‐regulation may reflect the increased volume of ER and number of contact sites with mitochondria. Next, we performed an immunoblot analysis to detect Opa1 processing, a marker of mitochondrial dynamics and stress (Appendix Fig S2B). Consistent with published work, we were able to detect five forms, labeled from a to e. The bands c and e are usually low abundant in healthy mitochondria, while they are actively produced by the Oma1 protease in stressed mitochondria. Our data show that Oma1 protease is not active in the lipin1‐deficient muscles, suggesting that mitochondria maintain a proper control of membrane potential over the inner membrane. Since PA levels were previously shown to promote mitochondrial fusion (Huang et al, 2011), and since there was an overall disturbance in PAP1 activity of lipin1 mutants, PA levels were assayed in isolated mitochondria. However, PA levels in mitochondrial membranes were equivalent in mutants vs. controls (Appendix Fig S2C). Immunofluorescence analysis of isolated muscle fibers using validated antibodies against endogenous lipin1 indicated that lipin1 was not localized in the Tom20‐positive mitochondria, but in adjacent structures (Appendix Fig S2D). Although we cannot rule out other possibilities, our data are consistent with a model in which lipin1 does not have a direct effect on mitochondrial morphology and function, but rather secondary to SR alterations.
Consistent with previous analysis (Zhang et al, 2014), lipin1‐deficient mutants also showed an accumulation of autophagosomes, lysosomes, containing amorphous material and degraded mitochondria (black arrows in Fig 7D), and multilamellar bodies (white arrow in Fig 7D). The autophagy defect was traced by the accumulation of the Lamp2‐positive lysosomes, the p62 cargo receptor and the LC3 proteins, that are normally degraded by autophagy (Appendix Fig S3A). PA was previously reported to affect mammalian target of rapamycin (mTOR) kinase activity, a well‐known negative regulator of autophagy (Yoon et al, 2015). To evaluate mTOR activity, we assessed the phosphorylation of rpS6 and Akt proteins, as markers of mTOR Complex 1 (mTORC1) and mTOR Complex 2 activities (mTORC2), respectively. Strikingly, both mTOR outputs were hyperphosphorylated, suggesting a possible mechanism of autophagy impairment (Appendix Fig S3A).
Next, we aimed at extending our observations to additional models of lipin1 deficiency that were previously established in the whole body: the FLD mice, carrying deletion and inversion at the Lpin1 locus and undetectable lipin1 protein1; the Hubr rats, carrying point mutations at the Lpin1 locus and catalytic dead protein (Mul et al, 2011). Importantly, all our key observations were reproduced in both models: increase of TAG levels and SR stress markers Bip and Fgf21, SREBP2 cleavage, mTOR up‐regulation of rpS6 phosphorylation, and autophagy defects leading to p62 and LC3 accumulation (Appendix Fig S3B–D).
To address the contribution of autophagy alterations in the myopathy of lipin1‐deficient mice, we treated the mice with the mTOR inhibitor temsirolimus. As expected, temsirolimus treatment decreased mTOR activity, as assessed by rpS6 phosphorylation, while ameliorating autophagy flux, as assessed by LAMP2 and LC3‐II levels (Appendix Fig S4A). The effects of temsirolimus on mTOR inhibition were more potent than on autophagy induction, consistent with previous work. However, mTOR inhibition in lipin1 mutants did not reduce the markers of ER stress, such as Bip, Fgf21, and cleaved SREBP2. Of note, temsirolimus treatment did not ameliorate the histopathological signs of necrotic fibers, TAG accumulation, and muscle weakness (Appendix Fig S4B–D). These results do not support a role for mTOR as therapeutic target in the lipin1 deficiency. It is possible that more potent autophagy reactivators might be beneficial for lipin1 deficiency. However, the ER stress markers seem better in predicting the efficacy of treatment, as compared to autophagy markers.
To address whether a rescue of the lipin1‐deficient muscle phenotype might be achieved by acting on the ER stress or the lipostasis, we tested other pharmacological interventions in this preclinical model of the disease. First, mutant mice were daily treated twice with 500 mg/kg of tauroursodeoxycholic acid (TUDCA) during 21 days and compared to placebo‐treated mice (Ozcan et al, 2006; Tezze et al, 2017). As shown in Fig 8A and B, and Appendix Fig S5A, this bile acid and chemical chaperone was effective in alleviating the molecular markers of ER stress, as assessed by Fgf21, Gdf15, Bip, cleaved SREBP2, and cleaved Atf6 levels. In addition, the lipid droplets and the triglyceride levels were also decreased after TUDCA treatment (Fig 8C and D), while mitochondrial gene expression was not rescued (Appendix Fig S5B). mTOR activity and LC3 levels were also not rescued by TUDCA treatment (Fig 8A). This selective effect on ER markers was consistent with previous reports on mouse mutants of the mitochondrial fusion machinery (Sebastian et al, 2012). Importantly, this short‐term treatment was already sufficient to ameliorate muscle strength as compared to placebo‐treated mutant mice (Fig 8E). In order to understand whether this increased normalized tetanic force in treated animals could be correlated to a better muscle histology, we quantified the number of necrotic fibers in the gastrocnemius muscle. Interestingly, the rate of fiber necrosis, as evidenced by the number of IgG‐positive fibers, was sharply reduced by TUDCA treatment (Fig 8F).
Figure 8. TUDCA treatment rescues lipin1‐deficient myopathy.
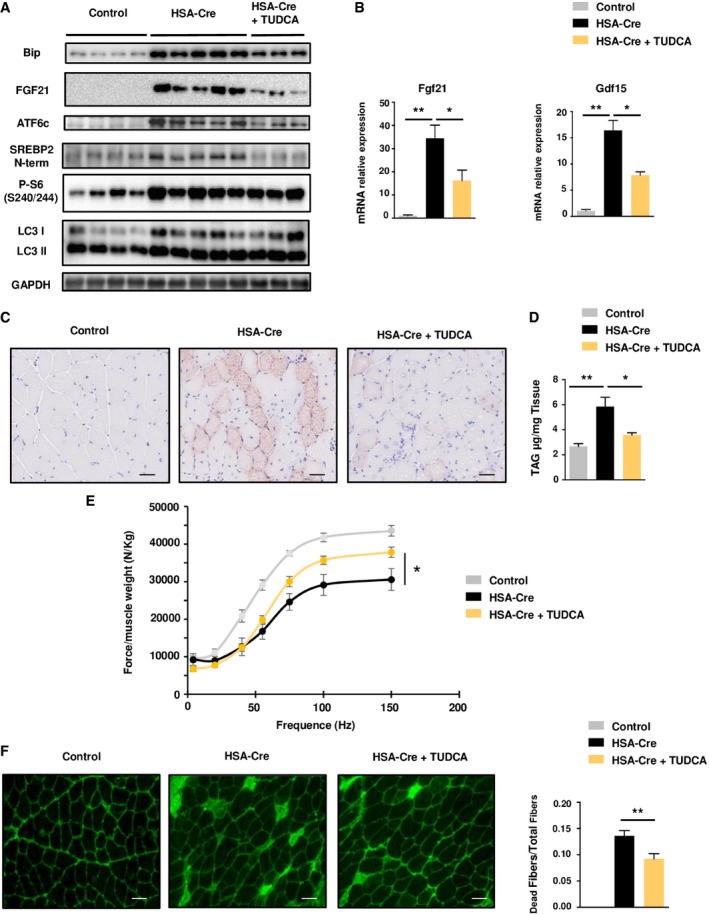
- Representative immunoblots from protein extract of GC muscles of 6‐month‐old control, HSA‐Cre untreated and HSA‐Cre TUDCA‐treated mice, with the indicated antibodies.
- Quantitative RT–PCR measurement of Fgf21 and GDF15 expression in GC muscle of 6‐month‐old control, HSA‐Cre untreated and HSA‐Cre TUDCA‐treated mice. Data are mean ± SEM (n = 4, *P < 0.05, **P < 0.01).
- Histological analysis of TA muscles of 6‐month‐old control, HSA‐Cre untreated and HSA‐Cre TUDCA‐treated mice by Oil Red O staining to detect the neutral lipids. Scale bars: 40 μm.
- TAG level measurement in GC muscles of 6‐month‐old control, HSA‐Cre untreated and HSA‐Cre TUDCA‐treated mice. Data are mean ± SEM (n = 4; *P < 0.05, **P < 0.01).
- In vivo force measurements performed on GC muscles of 6‐month‐old control, HSA‐Cre untreated and HSA‐Cre TUDCA‐treated mice. Data are mean ± SEM (n = 4; *P < 0.05).
- Representative staining of IgG‐positive fibers on frozen sections of TA of 6‐month‐old control, HSA‐Cre untreated and HSA‐Cre TUDCA‐treated mice. The sections were stained with a secondary fluorescent anti‐mouse IgG antibody. Quantification of the number of necrotic fibers over the total number of fibers. Data are mean ± SEM (n = 4; **P < 0.01). Scale bars: 40 μm.
Lipin1 has been previously shown to promote PPAR activity either through direct protein interaction and/or shuttling their endogenous ligands (Finck et al, 2006). Lipin1‐deficient muscles had decreased Mcad levels (Fig 4C), a transcriptional target of PPARα and δ. To reactivate the PPARα and δ transcription factors and rescue the FAO defects of lipin1‐deficient muscles, mice were treated daily with the pan‐PPAR activator bezafibrate during 21 days (Djouadi et al, 2005). Of note, this drug not only attenuated lipid droplets, but also the ER stress, muscle weakness, and fiber necrosis observed in mutant animals (Fig 9A–F, Appendix Fig S5C). These findings suggest that the ER stress may have an origin from the deregulated lipid metabolism. Taken together, both pharmacological treatments with TUDCA and bezafibrate strengthened the link between the ER stress, lipostasis, and the myopathy in lipin1 deficiency. Moreover, they indicated possible therapeutic interventions for this debilitating disease.
Figure 9. Bezafibrate treatment rescues Lipin1‐deficient myopathy.
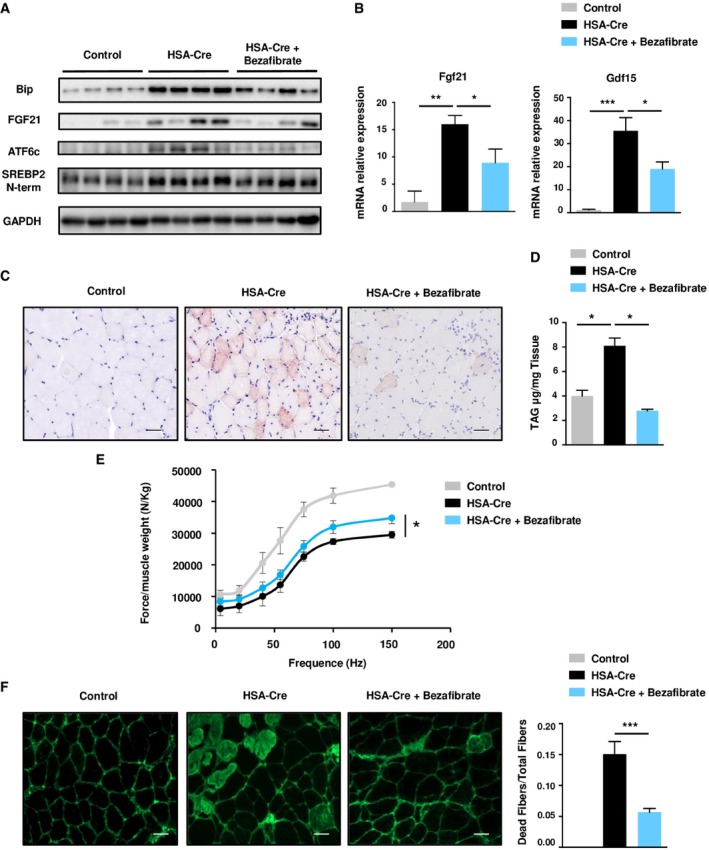
- Representative immunoblots from protein extract of GC muscles of 4‐month‐old control, HSA‐Cre untreated and HSA‐Cre Bezafibrate‐treated mice, with the indicated antibodies.
- Quantitative RT–PCR measurement of Fgf21 and GDF15 expression in GC muscle of 4‐month‐old control, HSA‐Cre untreated and HSA‐Cre Bezafibrate‐treated mice. Data are mean ± SEM (n = 4, *P < 0.05, **P < 0.01, ***P < 0.001).
- Histological analysis of TA muscles of 4‐month‐old control, HSA‐Cre untreated and HSA‐Cre Bezafibrate‐treated mice by Oil Red O staining to detect the neutral lipids. Scale bars: 40 μm.
- TAG level measurement in GC muscles of 4‐month‐old control, HSA‐Cre untreated and HSA‐Cre Bezafibrate‐treated mice. Data are mean ± SEM (n = 4; *P < 0.05).
- In vivo force measurements performed on GC muscles of 4‐month‐old control, HSA‐Cre untreated and HSA‐Cre Bezafibrate‐treated mice. Data are mean ± SEM (n = 4; *P < 0.05).
- Representative staining of IgG‐positive fibers on frozen sections of TA of 4‐month‐old control, HSA‐Cre untreated and HSA‐Cre Bezafibrate‐treated mice. The sections were stained with a secondary fluorescent anti‐mouse IgG antibody. Quantification of the number of necrotic fibers over the total number of fibers. Data are mean ± SEM (n = 4; ***P < 0.001). Scale bars: 40 μm.
Discussion
Mutations in genes encoding enzymes of glycolysis, glycogen storage, FAO, purine nucleotide cycle, respiratory electron transport chain, and the Krebs cycle are causes of metabolic myopathies, increasing the risk of rhabdomyolysis bouts in humans (Chan et al, 2015). Based on our data, here we propose that the lipin1 deficiency belongs to a new class of rhabdomyolysis‐prone metabolic myopathies, in which the ER stress response is central to the disease. That ER stress may be a major primary cause of the disease is based on the following consideration: (i) lipin1 is mainly localized in the ER (Santos‐Rosa et al, 2005); (ii) ER is also the site of phospholipid and lipid droplet production, which is greatly altered in the lipin1 mutants (Santos‐Rosa et al, 2005; Malhotra & Kaufman, 2007); (iii) a major UPR response is detected in lipin1 mutant muscle cells, similar to previous observation in cancer cells; (iv) pharmacological treatments ameliorating the ER stress have an impact on muscle strength and histology.
The PAP1 deficiency, combined to ER stress‐dependent SREBP activation (Figs 1, 4, and 8), leads to catastrophic de novo lipogenesis of both phospholipids and neutral lipids (Figs 2 and 3). In addition, the shutdown of the degradative pathways of FAO and autophagy aggravates the metabolic condition of lipidosis, as indicated by the beneficial effects of FAO activator bezafibrate (Fig 9). Glycolysis intermediates are channelled into lipid synthesis, while mitochondria undergo remodeling and mtDNA loss (Figs 5 and 7). Thus, lipin1 deficiency and ER stress indirectly cause important alterations of both glycolysis and mitochondrial functions, the two bioenergetic pathways in cells. These findings should be relevant to human disease, as lipin1‐deficient children may suffer of rhabdomyolysis with lipid droplets accumulation of unknown origin (Michot et al, 2010).
The observed accumulation of phospholipids and the deformation of the ER in lipin1‐deficient muscles (Figs 2D and 5C) are consistent with the first description of PAP mutants in yeast (Santos‐Rosa et al, 2005). The defect in PAP1 activity is expected to shift the balance toward an accumulation of PA to the detriment of diacylglycerol (DAG) levels (Han et al, 2007; Reue, 2007). However, we reveal both PA and DAG accumulation in mutant muscles (Fig 3), consistent with a recent report (Schweitzer et al, 2018). Since DAG is a precursor of both phospholipids and TAG, our data explain the increase in both lipid species. It is likely that the striking activation of SREBP1c and SREBP2 transcription factors is central to these metabolic adaptations, as they function as master regulators of lipid synthesis (Brown & Goldstein, 1997). Lipid precursors may be taken up from the circulation and used for biosynthesis under the action of the SREBP factors. SREBPs are activated by three main signals: cholesterol deprivation, the insulin/mTOR pathway, and the ER stress (Brown & Goldstein, 1997; Yecies et al, 2011). Although we cannot exclude additional factors, our data indicate an important contribution of the ER stress in the SREBP cleavage and induction. The markers of ER stress are greatly elevated in lipin1‐deficient muscles (Fig 6), and treatment with chemical chaperones alleviates the disease, while blunting SREBP cleavage (Fig 8). Besides the SREBP factors, we also show that activating PPARs and FAO by bezafibrate treatment also relieves ER stress and the myopathy (Fig 9). Therefore, it is possible to intervene on several factors and multiple levels on the lipidosis and ER stress of lipin1 mutants.
What are the causes of ER stress in lipin1 deficiency? The classical trigger of the unfolded protein response (UPR) is an overload of protein synthesis, accompanied by a decrease in translational fidelity and folding efficacy (Malhotra & Kaufman, 2007). In the lipin1 mutants, we detect the up‐regulation of the mTOR pathway (Fig 8), which is known to promote protein synthesis and ER stress in other systems (Ozcan, Ozcan et al, 2008). However, treatment with mTOR inhibitors does not significantly impact on ER stress and myopathy of lipin1 mutants, thus ruling out a marked contribution by proteostasis alterations (Appendix Fig S4). Interestingly, ER stress can also be triggered in conditions with no apparent protein unfolding, such as during inositol depletion or alterations in sterol synthesis, fatty acyl chain saturation, and length (Fu et al, 2011; Halbleib et al, 2017). It has been proposed that lipid stress affects ER membrane thickness and density, which is sensed by transmembrane proteins such as inositol‐requiring enzyme 1 (IRE1), the endoribonuclease involved in Xbp1 splicing (Halbleib et al, 2017). Of note, we find that the IRE1 branch of the UPR is more induced over the phospho‐eIF2α branch (Fig 6). These data, together with the efficacy of the FAO activator bezafibrate in relieving ER stress (Fig 9), would favor a major alteration of lipostasis rather than proteostasis as a trigger of ER stress. The final steps of fatty acyl chain desaturation and elongation, which are altered in lipin1‐deficient muscles (Fig 2), may become rate limiting due to the overload in lipid synthesis. Since fatty acyl saturation limits the reducing capacity of the ER (Fu et al, 2011), it is tempting to speculate that it may directly concur to the ER stress of lipin1‐deficient muscles.
The ER stress of lipin1 mutants is accompanied by important alterations of mitochondrial morphology and biochemical activities, including FAO. Importantly, the ER tubules have been shown to mark the site of mitochondrial division (Friedman et al, 2011; Lewis et al, 2016). In yeast, the endoplasmic reticulum (ER)‐mitochondria encounter structure (ERMES) and the endoplasmic reticulum membrane (EMC) are protein complexes tethering ER and mitochondria (Youngman et al, 2004; Murley et al, 2013; Lahiri et al, 2014; Fernandez‐Murray & McMaster, 2016). They function by controlling the transfer of lipids and metabolites between the two organelles and affecting their morphology. Interestingly, ERMES mutants in yeast have alterations in mitochondria fusion and mtDNA segregation, similar to lipin1 deficiency (Youngman et al, 2004; Murley et al, 2013). Recently, mammalian PDZD8 has been proposed to be an ER protein functionally orthologous to a member of the yeast ERMES complex (Hirabayashi et al, 2017). It will be interesting to address whether ERMES orthologues or other ER‐mitochondria tethering complexes are affected by the lipin1 deficiency. Mitochondrial fragmentation in the long term is known to cause important alterations in mitochondrial function. This has been mainly demonstrated by studies on Mitofusins and Opa1, large GTPases of the dynamin family which are respectively localized in the outer and inner membranes of the mitochondria and promote mitochondrial fusion (Frezza et al, 2006; Chen et al, 2010; Wai et al, 2015; Tezze et al, 2017). Their loss causes mitochondrial fission and a dramatic decrease in mtDNA content, replication fidelity, mitochondrial potential, and respiration. Of note, the mitochondrial remodeling of lipin1‐deficient muscles is also accompanied by a drop of mtDNA content and expression of mitochondrial‐encoded genes (Fig 7).
Lipin1 deficiency in muscles shares similarities with other myopathies that are positive for Fgf21, an increasingly used biomarker (Khan et al, 2017; Tezze et al, 2017). Fgf21 expression is massively induced in lipin1‐deficient muscles (Fig 6). The Fgf21 promoter contains amino acid response elements (AARE) for the Atf4 and Atf6 transcription factors (Schaap et al, 2013). Atf6 cleavage is a well‐known consequence of the ER stress and is triggered by lipin1 deficiency. Fgf21 is also induced in myopathies whose primary causes are mutations in mitochondrial DNA or in the mitochondrial fusion machinery (Khan et al, 2017; Pereira et al, 2017; Tezze et al, 2017). Interestingly, Opa1‐deficient muscles also respond to the chemical chaperone TUDCA (Tezze et al, 2017). Future studies should dissect additional upstream signals and transcriptional factors, others than ER stress and Atf4/Atf6 factors, impinging on Fgf21 regulation depending on the type of myopathy.
Lipin1 deficiency is a relatively common genetic cause of rhabdomyolysis in children with severe morbidity and mortality (Michot et al, 2010). The available treatment is limited to emergency care to control the rhabdomyolysis bouts, kidney, and heart failure. Our study may open new therapies of intervention attacking the cause of the disease. We show that TUDCA and bezafibrates rapidly improves muscle strength and histology, pointing to the benefits of nutritional and pharmacological interventions ameliorating the ER‐mitochondrial remodeling and the FAO.
Materials and Methods
Reagents
The following primary antibodies were used: anti‐p62 (SQSTM) (Abnova), anti‐LAMP2 (Abcam), anti‐FGF21 (abcam), anti‐Bip (BD Biosciences), anti‐Gapdh (Santa Cruz), anti‐SREBP1c (Santa Cruz), anti‐SREBP2 (abcam), anti‐ATF6 (abcam), anti‐LC3 (Nanotools), anti‐Tom20 (SantaCruz), anti‐lipin1 (SantaCruz, sc‐376874). All other antibodies were from Cell Signalling.
Animals and Generation of HSACre/+/Lpin1fEx3−4/fEx3‐4 mice
For generation of muscle‐specific Lpin1 knockout, Lpin1 floxed mice described previously (Nadra et al, 2008) were crossed with transgenic mice expressing Cre recombinase under the control of a human skeletal actin promoter (HSA‐Cre; Miniou et al, 1999). The double heterozygous mice (HSA Cre/+/Lp fEx2‐3/+) were crossed with homozygous Lpin1 fEx2‐3/fEx2‐3 mice, leading to the generation of conditional knockout mice (HSA Cre/+ /Lpin1 fE2‐3/fEx2‐3). The LpCond F (F1) and LpCond R primers were used for genotyping of the generated mice, amplifying a 780‐bp product from the Lpin1 fEx3‐4 allele and a 740‐bp product from the Lpin1 + allele. The HSA‐CreF and HSA‐CreR primer set amplifying the 110‐bp PCR product was used for the detection of the HSA Cre allele. The combination of primers F1, F2, and R1 was used to detect the Lpin1 ΔEx3‐4 with deleted exons 2 and 3. HSA Cre/+ /Lpin1 fEx2‐3/fEx2‐3 pups were obtained at the expected Mendelian frequency. Cre‐negative Lpin1 fEx2‐3/fEx2‐3 mice were used as controls. Mice were fed a standard diet (SD) rodent chow (2018 Teklad Global 18% Protein Rodent Diet, Harlan) composed of 60% carbohydrate fed ad libitum. Generation of Lpin1 1hubr mutant rats has been previously described (Mul et al, 2011). All animal studies were approved by the Direction Départementale des Services Vétérinaires, Préfecture de Police, Paris, France (authorization number 75‐1313).
In vivo drug administration
Drug treatment was started 3 weeks before the sacrifice, on adult mice of the indicated age (3–6 months old), already displaying a full‐blown phenotype. Tauroursodeoxycholic acid (TUDCA) was purchased from Merck (580549). TUDCA (500 mg/kg/day) was administered twice a day (8 am and 8 pm) for 3 weeks by oral gavage. Bezafibrate was administered with the standard chow diet (0.5% of bezafibrate by volume). Temsirolimus (LC Laboratories) was dissolved in 100% ethanol (25 mg/ml), aliquoted, and stored at −20°C. 1 mg/ml working solution was prepared in 5% Tween‐80, 5% PEG400, and 86% PBS before injection. Mice were injected i.p. with vehicle or temsirolimus (5 mg/kg) every day for 3 weeks.
In vivo force measurements
Contractile performance of the gastrocnemius muscle was measured in vivo using a muscle lever system (model 305B, Aurora Scientific) in mice anesthetized with a mixture of Xylazine and Zoletil, as described previously (Blaauw et al, 2008). Mice were placed on a thermostatically controlled table with the knee stationary and the foot firmly fixed to a footplate connected to the shaft of the motor. Contraction was elicited by electrical stimulation of the sciatic nerve. Teflon‐coated seven‐stranded steel wires (AS 632, Cooner Sales) were implanted with sutures on either side of the sciatic nerve proximal to the knee before its branching. At the distal ends of the two wires, the insulation was removed, and the proximal ends were connected to a stimulator (model S88, Grass). To avoid recruitment of the dorsal flexor muscles, the common fibular nerve was cut. The torque developed during isometric contractions was measured at stepwise increasing stimulation frequencies, with pauses of at least 30 s between stimuli to avoid effects due to fatigue. Duration of the trains never exceeded 600 ms. The force developed by plantar flexor muscles was calculated by dividing the torque by the lever arm length (taken as 2.1 mm) and then normalized to muscle weight.
Histology
Gastrocnemius, soleus, EDL, and TA muscles of male mice were embedded in Cryo‐Gel (Electron Microscopy Sciences), frozen in isopentane chilled in liquid nitrogen, and stored at −80°C. Transverse 10‐μm cross sections were collected along the entire length of the muscle at 300‐μm intervals with a cryostat (Leica CM 1850) and stained with hematoxylin and eosin solution or used for immunofluorescence, Oil Red O staining, ATPase (pH 4.35), cytochrome c oxidase (COX), and succinate dehydrogenase (SDH) activity assays. For analysis of necrotic fibers, muscle frozen sections were fixed with Paraformaldehyde (PFA) 4% for 15 min. Sections were stained for 1 h with Alexa Fluor® 488 Donkey Anti‐mouse antibody diluted in PBS—BSA 3% HS 3% Triton 0.1% solution. For muscle fiber isolation, EDL muscles of mice were dissected and transferred in a solution of 0.2% of collagenase (Sigma C0130 type 1) for 2 h at 37°C with periodic mechanical digestion. Fetal bovine serum was added to stop the digestion.
Quantitative PCR
Total RNA from skeletal muscle and mouse primary myotubes was isolated using the Qiagen RNeasy lipid tissue kit (Qiagen) following the manufacturer's instructions. RNA quality was verified by agarose gel and/or by the Qiaxcel capillary electrophoresis device (Qiagen), and the concentration was determined by a ND‐1000 Spectrophotometer (NanoDrop). Total RNA (500 ng–1,000 ng) was subjected to reverse transcription using the SuperScript II First‐Strand Synthesis System for RT–PCR (Invitrogen) following the manufacturer's instructions. The resulting cDNA was used as a template for relative quantitative RT–PCR. Results were normalized using the reference gene Pinin. A complete list of oligonucleotides is provided upon request.
Western blotting
Tissues were lysed in ice‐cold lysis buffer (20 mM Na2H2PO4, 250 mM NaCl, Triton X‐100 1%, SDS 0.1%) supplemented with complete protease inhibitor mix (Roche). Protein levels were quantified using the Bio‐Rad protein assay with BSA as a standard. Equal amounts of protein extracts were resolved by 10% SDS–PAGE and electro‐transferred onto a polyvinylidene difluoride (PVDF) membrane (Amersham Biosciences). Blots were blocked in Tris‐buffered saline containing 0.1% Tween (TBS‐T) supplemented with 5% bovine serum albumin (BSA) and subsequently incubated overnight at 4°C in the same buffer supplemented with indicated antibodies. After washing in TBS‐T, blots were exposed to the appropriate horseradish peroxidase‐conjugated secondary antibodies (Cell signaling) in TBS‐T for 1 h at room temperature. Finally, the blots were developed using ChemiDoc™ Imager from Bio‐Rad.
Myosin heavy chain (MHC) gel electrophoresis
The muscles were extracted on ice for 60 min in four volumes of extracting buffer (pH 6.5), as previously described (Agbulut et al, 2003). Following centrifugation, the supernatants were diluted 1:1 (vol/vol) with glycerol and stored at −20°C. MHC isoforms (MHC‐1, MHC‐2a, MHC‐2x, MHC‐2b) were separated on 8% polyacrylamide gels, which were made in the Bio‐Rad mini‐Protean II Dual slab cell system. The gels were run for 31 h at a constant voltage of 72 V at 4°C. Following migration, the gels were silver stained. The positions of the different MHC bands were confirmed by Western blot analysis using antibodies directed against different MHC isoforms. The gels were scanned using a video acquisition system.
PAP activity measurement
Tissue samples were disrupted using a dounce homogenizer at 4°C in 50 mM Tris–HCl (pH 7.5) buffer containing 0.25 M sucrose, 1 mM EDTA, 10 mM β‐mercaptoethanol, 1 mM benzamidine, 0.5 mM PMSF, 5 mg/ml of aprotinin, leupeptin, and pepstatin. The lysed cells were centrifuged at 1,000 g for 10 min at 4°C, and the supernatant was used as cell extract. Total PAP activity (Mg2+‐dependent and Mg2+‐independent) was measured at 37°C for 20 min in the reaction mixture (total volume of 100 ml) containing 50 mM Tris–HCl (pH 7.5), 1 mM MgCl2, 10 mM β‐mercaptoethanol, 0.2 mM [32P]PA (5,000 cpm/nmol), 2 mM Triton X‐100, and enzyme protein. The radioactive [32P]PA was synthesized enzymatically from diacylglycerol and [γ‐32P]ATP with Escherichia coli diacylglycerol kinase. The Mg2+‐independent PAP activity was measured in the same reaction mixture except that 2 mM EDTA was substituted for 1 mM MgCl2. The Mg2+‐dependent PAP activity was calculated by subtracting the Mg2+‐independent enzyme activity from total enzyme activity. A unit of PAP activity was defined as the amount of enzyme that catalyzed the formation of 1 nmol of product/min. Specific activity was defined as units/mg protein. The average standard deviation of the assays was ± 5%. The reactions were linear with time and protein concentration.
Quantitative mass spectrometry of lipids
Mass spectrometric analysis was performed essentially as described (Ozbalci et al, 2013; Tatsuta, 2017). To quantify phospholipids, cholesterol, and cholesteryl esters, lipids were extracted from isolated pure mitochondria or whole muscle in the presence of internal standards of major phospholipids (PC 17:0‐20:4, PE 17:0‐20:4, PI 17:0‐20:4, PS 17:0‐20:4, PG 17:0‐20:4, PA 17:0‐20:4), CL (CL mix I), cholesteryl esters 19:0, and D7 cholesterol (all from Avanti Polar Lipids). Extraction was performed according to Bligh and Dyer with modifications to improve extraction of PI, PG, PA, and CL. Briefly, mitochondria or muscle homogenate (equivalent to 10 μg or 50 μg protein, respectively) in 0.24 ml water and internal standards (100, 60, 35, 25, 15, 15, 24, 60, and 60 pmol of PC 17:0‐20:4, PE 17:0‐20:4, PI 17:0‐20:4, PS 17:0‐20:4, PG 17:0‐20:4, PA 17:0‐20:4, CLs, CE 19:0, and D7 cholesterol, respectively) mixed with 0.9 ml of chloroform/methanol [1:2 (v/v)] for 10 min. After addition of 0.3 ml chloroform and of 0.3 ml H2O, the sample was mixed again for 10 min, and phase separation was induced by centrifugation (800 g, 2 min). The lower chloroform phase was carefully transferred to a clean glass vial. 50 μl of the chloroform phase was taken to another clean glass vial for cholesterol analysis. The upper water phase was mixed with 10 μl 1 N HCl and 300 μl chloroform for 10 min. After phase separation, the lower chloroform phase was carefully transferred to the glass vial with the chloroform phase from the first extraction. The solvent was evaporated by a gentle stream of argon at 37°C. The lipid film from the 50 μl aliquot for cholesterol analysis was dissolved in 50 μl acetylchloride/chloroform (1:5 v/v) and was incubated for 2 h at RT to perform chemical derivatization of cholesterol to cholesterol acetate. Lipids were dissolved in 10 mM ammonium acetate in methanol, transferred to Twin.tec PCR plate sealed with Thermowell sealing tape, and analyzed on a QTRAP 6500 triple quadrupole mass spectrometer (SCIEX) equipped with nano‐infusion splay device (TriVersa NanoMate with ESI‐Chip type A, Advion) under following settings: (QT 6500) CUR, 20; CAD, medium; IHT, 90°C; EP, 10; Mode: Highmass; Step size, 0.1 Da; Setting time, 0 ms; Scan rate, 200 Da/s; Pause 5 ms; CEM, 2300; Sync, LC sync; Ccan mode, Profile (NanoMate) sample infusion volume, 12 μl; volume of air to aspirate after sample, 1 μl; air gap before chip, enabled; aspiration delay, 0 s; pre‐piercing, with Mandrel; spray sensing, enabled; temperature, 10°C; gas pressure, 0.4 psi; ionization voltage, 1.3 kV; polarity, positive; vent headspace, enabled; pre‐wetting, 1×; volume after delivery, 0.5 μl; contact closure delay, 1 s; volume timing delay, 0 s; aspiration depth, 1 mm; pre‐piercing depth, 9 mm; output contact closure, Rel 1/2.5 s duration. The quadrupoles Q1 and Q3 were operated at unit resolution. PC and cholesteryl esters analysis was carried out in positive ion mode by scanning for precursors of m/z 184 Da or 369 Da at a collision energy (CE) of 37 eV or 15 eV, respectively. PE, PI, PS, PG, PA, and cholesterol measurements were performed in positive ion mode by scanning for neutral losses of 141 Da, 277 Da, 185 Da, 189 Da, 115 Da, and 77 Da at CEs of 30 eV, 30 eV, 30 eV, 25 eV, 25 eV, and 15 eV, respectively. CL species were identified in positive ion mode by scanning for precursors of the masses (m/z 491.4, 493.4, 495.4, 505.5, 523.5, 535.5, 599.5, 601.5, 603.5, 631.5, 715.5, and 771.5 Da) corresponding DAG‐H2O fragments as singly charged ions at CEs of 45 eV. Mass spectra were processed by the LipidView Software Version 1.2 (SCIEX) for identification and quantification of lipids. Lipid amounts (pmol) were corrected by functions of the LipidView for isotopic overlap and for response differences between internal standards and endogenous lipids using experimentally validated response factors for individual lipid species provided by SCIEX. Corrections of isotopic overlap and of response difference in CL species were performed as described previously (Tatsuta, 2017). Amounts of lipids after corrections were summed up in each lipid class, and proportions of individual lipids in the class were calculated. The lipid species do not exceed 0.5% (PC, PE, and PI) or 1% (other lipid classes) in the class were omitted from the calculation to minimize the effect of background noise or the signals from contaminated molecules. The amounts of lipid species above the threshold were again summed up in each lipid classes, and the values were normalized by the protein amounts in the starting sample and shown as the total amounts of lipids (pmol) per μg of protein.
For the analysis of DAG and TAG species, mouse muscle homogenate aliquots equivalent to 100 μg (for TAGs) or 400 μg (for DAGs) of protein were diluted to 500 μl with Milli‐Q water and mixed with 1.875 ml of chloroform/methanol/37% hydrochloric acid 5:10:0.15 (v/v/v). 20 μl of 4 μM d5‐TG Internal Standard Mixture I (for TAGs) or 4 μM d5‐DG Internal Standard Mixtures I and II (for DAGs) (Avanti Polar Lipids) were added. Conditions of lipid extraction and Nano‐ESI‐MS/MS analysis have been previously described (Ozbalci et al, 2013). The detection of TAG and DAG species was conducted by scanning for the neutral losses of the ammonium adducts of distinct fatty acids: 245 (14:0), 271 (16:1), 273 (16:0), 295 (18:3), 297 (18:2), 299 (18:1), 301 (18:0), 321 (20:4), and 345 (22:6). For the analysis of TAGs, a mass range of m/z 750–1,100 Da was scanned with a collision energy (CE) of 40 eV, and for DAGs, the mass range was m/z 500–750 Da and the CE 25 eV. All scans were conducted in the positive ion mode at a scan rate 200 D/s with a declustering potential of 100 V, an entrance potential of 7 V, and a cell exit potential of 14 V (Ozbalci et al, 2013). Processing of mass spectra and quantification of lipid species was done as previously described (Kumar et al, 2015).
Targeted LC‐MS metabolites analyses
Frozen muscle tissue samples were powdered using Mikro‐Dismembrator S (Sartorius) according to manufactures instructions. Metabolites were extracted as described (Mackay et al, 2015). Briefly, 30 mg of frozen powdered muscle tissue was used for extraction. Extraction solution was composed of 50% methanol, 30% ACN, and 20% water. The volume of extraction solution added was adjusted to mass of the tissue (1 ml/100 mg). After addition of extraction solution, samples were vortexed for 5 min at 4°C and then centrifuged at 16,000 g for 15 min at 4°C. The supernatants were collected and stored at −80°C until analyses. LC/MS analyses were conducted on a QExactive Plus Orbitrap mass spectrometer equipped with an Ion Max source and a HESI II probe and coupled to a Dionex UltiMate 3000 UPLC system (Thermo, USA). External mass calibration was performed using the standard calibration mixture every 7 days as recommended by the manufacturer. 5 μl of each sample was injected onto Zic‐pHilic (150 mm × 2.1 mm i.d. 5 μm) with the guard column (20 mm × 2.1 mm i.d. 5 μm) (Millipore) for the liquid chromatography separation. Buffer A was 20 mM ammonium carbonate, 0.1% ammonium hydroxide (pH 9.2); buffer B was acetonitrile. The chromatographic gradient was run at a flow rate of 0.200 μl/min as follows: 0–20 min; linear gradient from 80% to 20% B; 20–20.5 min; linear gradient from 20% to 80% B; 20.5–28 min: hold at 80% B (Mackay et al, 2015). The mass spectrometer was operated in full scan, polarity switching mode with the spray voltage set to 2.5 kV, the heated capillary held at 320°C. The sheath gas flow was set to 20 units, the auxiliary gas flow was set to 5 units, and the sweep gas flow was set to 0 unit. The metabolites were detected across a mass range of 75–1,000 m/z at a resolution of 35,000 (at 200 m/z) with the AGC target at 106, and the maximum injection time at 250 ms. Lock masses were used to insure mass accuracy below 5 ppm. Data were acquired with Thermo Xcalibur software (Thermo). The peak areas of metabolites were determined using Thermo TraceFinder software (Thermo), identified by the exact mass of each singly charged ion and by known retention time on the HPLC column. Statistical and pathway analyses were performed using Metaboanalyst 4.0 software (Xia & Wishart, 2016).
Electron microscopy (EM)
Extensor digitorum longus (EDL) and soleus muscles were carefully dissected from control (n = 3) and lipin1‐deficient mice (n = 3). Muscles were fixed at room temperature (RT) in 3.5% glutaraldehyde in 0.1 M sodium cacodylate buffer (pH 7.4) for 2 h and kept in fixative till further use. For standard embedding preparations, small bundles of fixed fibers were post‐fixed in 2% OsO4 in 0.1 M sodium cacodylate buffer for 2 h and block‐stained in aqueous saturated uranyl acetate. Specimens, after dehydration, were embedded in an epoxy resin (Epon 812). For EM, ultrathin sections (50 nm) were cut and, after staining in 4% uranyl acetate and lead citrate, examined with a Morgagni Series 268D electron microscope (ThermoFisher Scientific, FEI Czech Republic, Brno), equipped with Megaview III digital camera. For quantitative analysis, the relative fiber volume occupied by the sarcoplasmic reticulum (SR) was determined in longitudinal sections of EDL fibers from control (n = 3) and lipin1‐deficient (n = 3) mice using the well‐established stereology point‐counting techniques (Loud et al, 1965; Mobley & Eisenberg, 1975) in EM micrographs taken at 22,000× of magnification after superimposing to the electron micrographs an orthogonal array of dots at a spacing of 0.20 μm. The ratio between numbers of dots falling within the SR profiles and the total number of dots covering the whole image was used to calculate the relative volume of fiber occupied by the SR. Number of fibers analyzed in each mouse: n = 5.
Biochemical measurements
For circulating Fgf21 levels, plasma was obtained from blood collected from HSA‐Cre and control mice. Blood FGF21 levels were determined using Rat/Mouse FGF21 Enzyme‐linked Immunosorbent ELISA Kit (Millipore, EZRMFGF21‐26K). Data are expressed in pg/mL. For respiratory chain measurements, activity of respiratory chain complexes was spectrophotometrically assayed as previously described (Benit et al, 2006). TAG levels in muscle tissue were determined using the Triglycerides FS Kit (Diasys). Fifty of powdered muscle tissue was used for acetone extraction. For mtDNA assay, the DNA from skeletal muscle was isolated using the DNeasy blood and tissue kit (Qiagen) following the manufacturer's instructions. The quantity and purity of the DNA was assayed using a Nanodrop 2000 spectrophotometer (Thermo Scientific, Wilmington, DE, USA), and all DNA samples had OD260/OD280 values of 1.7–2.0. Then, total DNA samples were stored at −70°C until use. Using qPCR, the relative mtDNA copy number was determined by the ratio of mitochondrial DNA‐encoded Cytb gene and nucleus‐encoded Ndufv1 gene. 8 ng of DNA was used for the qPCR.
Oxiproteome analysis
Protein oxidation analysis was performed by OxiProteomics (www.oxiproteomics.fr). Extracted proteins were quantified by the Bradford method and split into equal amounts for analyses. Carbonylated proteins were labeled with specific functionalized fluorescent probes, and samples were resolved high‐resolution electrophoresis separation. Total proteins were post‐stained with SyproRuby™ protein gel stain. Image acquisition for carbonylated and total proteins was performed using the Ettan® DIGE imager (GE Healthcare). Image processing and analysis was performed using ImageJ (Rasband, W.S., ImageJ, U. S. National Institutes of Health, Bethesda, Maryland, USA, http://imagej.nih.gov/ij/, 1997‐B014). Density histograms and lane profile plots were obtained from each sample, both for carbonylated and total proteins. Carbonylated protein signal was normalized by total proteins signal for each sample in order to obtain their Carbonyl score. Statistical analyses were accomplished using GraphPad Software (La Jolla, California, USA).
Statistical analysis
A two‐tailed Student's t‐test was used for statistical analysis. All data are expressed as means ± SEM, and significance was established at the P ≤ 0.05 level.
Data availability
The targeted metabolomics mass spectrometry data from this publication have been deposited to the EMBL‐EBI MetaboLights database (https://doi.org/10.1093/nar/gks1004; PubMed PMID: 23109552) with the identifier MTBLS750.
Author contribution
TR and IN designed and conducted most of the experiments, analyzed the data, and co‐wrote the manuscript. CP and FP performed and interpreted electron microscopy analysis. TT, SB, and TL performed and interpreted phospholipidomics analysis. PC and DV performed part of histology and immunoblot analysis. PB and PR performed and interpreted polarography experiments. MAB performed carbonylation assays. OA performed fiber typing assays. RC provided the mutant mice. BB performed and interpreted force measurements. AO, HF, and MP obtained funding. MP, PL, and HF conceived the study. MP directed the work, analyzed the data, and wrote the manuscript. All authors discussed the results and commented on the manuscript.
Conflict of interest
The authors declare that they have no conflict of interest.
Supporting information
Appendix
Expanded View Figures PDF
Source Data for Appendix
Review Process File
Source Data for Figure 4
Acknowledgements
We are grateful to the members of INSERM‐U1151 for support. We thank Robert Ernst and Timothy Wai for critically reading the manuscript and helpful discussions. We thank the histology and viral vector facilities at the SFR Necker for the technical help. We thank Estelle Leborgne for art work. T.R. was supported by a fellowship from the ANRT‐Cifre program and Sanofi. This work was supported by grants from the European Research Council, AFM, Agence Nationale de la Recherche to M.P. and grant from Italian Ministry of Health (Rome, Italy) GR‐2011‐02350912 to C.P.
The EMBO Journal (2019) 38: e99576
References
- Agbulut O, Noirez P, Beaumont F, Butler‐Browne G (2003) Myosin heavy chain isoforms in postnatal muscle development of mice. Biol Cell 95: 399–406 [DOI] [PubMed] [Google Scholar]
- Benit P, Goncalves S, Philippe Dassa E, Briere JJ, Martin G, Rustin P (2006) Three spectrophotometric assays for the measurement of the five respiratory chain complexes in minuscule biological samples. Clin Chim Acta 374: 81–86 [DOI] [PubMed] [Google Scholar]
- Blaauw B, Mammucari C, Toniolo L, Agatea L, Abraham R, Sandri M, Reggiani C, Schiaffino S (2008) Akt activation prevents the force drop induced by eccentric contractions in dystrophin‐deficient skeletal muscle. Hum Mol Genet 17: 3686–3696 [DOI] [PubMed] [Google Scholar]
- Brown MS, Goldstein JL (1997) The SREBP pathway: regulation of cholesterol metabolism by proteolysis of a membrane‐bound transcription factor. Cell 89: 331–340 [DOI] [PubMed] [Google Scholar]
- Chan EK, Kornberg AJ, Ryan MM (2015) A diagnostic approach to recurrent myalgia and rhabdomyolysis in children. Arch Dis Child 100: 793–797 [DOI] [PubMed] [Google Scholar]
- Chen H, Vermulst M, Wang YE, Chomyn A, Prolla TA, McCaffery JM, Chan DC (2010) Mitochondrial fusion is required for mtDNA stability in skeletal muscle and tolerance of mtDNA mutations. Cell 141: 280–289 [DOI] [PMC free article] [PubMed] [Google Scholar]
- Djouadi F, Aubey F, Schlemmer D, Ruiter JP, Wanders RJ, Strauss AW, Bastin J (2005) Bezafibrate increases very‐long‐chain acyl‐CoA dehydrogenase protein and mRNA expression in deficient fibroblasts and is a potential therapy for fatty acid oxidation disorders. Hum Mol Genet 14: 2695–2703 [DOI] [PubMed] [Google Scholar]
- Donkor J, Sariahmetoglu M, Dewald J, Brindley DN, Reue K (2007) Three mammalian lipins act as phosphatidate phosphatases with distinct tissue expression patterns. J Biol Chem 282: 3450–3457 [DOI] [PubMed] [Google Scholar]
- Ferguson PJ, Chen S, Tayeh MK, Ochoa L, Leal SM, Pelet A, Munnich A, Lyonnet S, Majeed HA, El‐Shanti H (2005) Homozygous mutations in LPIN2 are responsible for the syndrome of chronic recurrent multifocal osteomyelitis and congenital dyserythropoietic anaemia (Majeed syndrome). J Med Genet 42: 551–557 [DOI] [PMC free article] [PubMed] [Google Scholar]
- Fernandez‐Murray JP, McMaster CR (2016) Lipid synthesis and membrane contact sites: a crossroads for cellular physiology. J Lipid Res 57: 1789–1805 [DOI] [PMC free article] [PubMed] [Google Scholar]
- Finck BN, Gropler MC, Chen Z, Leone TC, Croce MA, Harris TE, Lawrence JC Jr, Kelly DP (2006) Lipin 1 is an inducible amplifier of the hepatic PGC‐1alpha/PPARalpha regulatory pathway. Cell Metab 4: 199–210 [DOI] [PubMed] [Google Scholar]
- Frezza C, Cipolat S, Martins de Brito O, Micaroni M, Beznoussenko GV, Rudka T, Bartoli D, Polishuck RS, Danial NN, De Strooper B, Scorrano L (2006) OPA1 controls apoptotic cristae remodeling independently from mitochondrial fusion. Cell 126: 177–189 [DOI] [PubMed] [Google Scholar]
- Friedman JR, Lackner LL, West M, DiBenedetto JR, Nunnari J, Voeltz GK (2011) ER tubules mark sites of mitochondrial division. Science 334: 358–362 [DOI] [PMC free article] [PubMed] [Google Scholar]
- Fu S, Yang L, Li P, Hofmann O, Dicker L, Hide W, Lin X, Watkins SM, Ivanov AR, Hotamisligil GS (2011) Aberrant lipid metabolism disrupts calcium homeostasis causing liver endoplasmic reticulum stress in obesity. Nature 473: 528–531 [DOI] [PMC free article] [PubMed] [Google Scholar]
- Halbleib K, Pesek K, Covino R, Hofbauer HF, Wunnicke D, Hanelt I, Hummer G, Ernst R (2017) Activation of the unfolded protein response by lipid bilayer stress. Mol Cell 67: 673–684.e8 [DOI] [PubMed] [Google Scholar]
- Han GS, Siniossoglou S, Carman GM (2007) The cellular functions of the yeast lipin homolog PAH1p are dependent on its phosphatidate phosphatase activity. J Biol Chem 282: 37026–37035 [DOI] [PubMed] [Google Scholar]
- Harris TE, Finck BN (2011) Dual function lipin proteins and glycerolipid metabolism. Trends Endocrinol Metab 22: 226–233 [DOI] [PMC free article] [PubMed] [Google Scholar]
- Hirabayashi Y, Kwon SK, Paek H, Pernice WM, Paul MA, Lee J, Erfani P, Raczkowski A, Petrey DS, Pon LA, Polleux F (2017) ER‐mitochondria tethering by PDZD8 regulates Ca2+ dynamics in mammalian neurons. Science 358: 623–630 [DOI] [PMC free article] [PubMed] [Google Scholar]
- Huang H, Gao Q, Peng X, Choi SY, Sarma K, Ren H, Morris AJ, Frohman MA (2011) piRNA‐associated germline nuage formation and spermatogenesis require MitoPLD profusogenic mitochondrial‐surface lipid signaling. Dev Cell 20: 376–387 [DOI] [PMC free article] [PubMed] [Google Scholar]
- Khan NA, Nikkanen J, Yatsuga S, Jackson C, Wang L, Pradhan S, Kivela R, Pessia A, Velagapudi V, Suomalainen A (2017) mTORC1 regulates mitochondrial integrated stress response and mitochondrial myopathy progression. Cell Metab 26: 419–428.e5 [DOI] [PubMed] [Google Scholar]
- Kumar V, Bouameur JE, Bar J, Rice RH, Hornig‐Do HT, Roop DR, Schwarz N, Brodesser S, Thiering S, Leube RE, Wiesner RJ, Vijayaraj P, Brazel CB, Heller S, Binder H, Loffler‐Wirth H, Seibel P, Magin TM (2015) A keratin scaffold regulates epidermal barrier formation, mitochondrial lipid composition, and activity. J Cell Biol 211: 1057–1075 [DOI] [PMC free article] [PubMed] [Google Scholar]
- Lahiri S, Chao JT, Tavassoli S, Wong AK, Choudhary V, Young BP, Loewen CJ, Prinz WA (2014) A conserved endoplasmic reticulum membrane protein complex (EMC) facilitates phospholipid transfer from the ER to mitochondria. PLoS Biol 12: e1001969 [DOI] [PMC free article] [PubMed] [Google Scholar]
- Lewis SC, Uchiyama LF, Nunnari J (2016) ER‐mitochondria contacts couple mtDNA synthesis with mitochondrial division in human cells. Science 353: aaf5549 [DOI] [PMC free article] [PubMed] [Google Scholar]
- Loud AV, Barany WC, Pack BA (1965) Quantitative evaluation of cytoplasmic structures in electron micrographs. Lab Invest 14: 996–1008 [PubMed] [Google Scholar]
- Mackay GM, Zheng L, van den Broek NJ, Gottlieb E (2015) Analysis of cell metabolism using LC‐MS and isotope tracers. Methods Enzymol 561: 171–196 [DOI] [PubMed] [Google Scholar]
- Malhotra JD, Kaufman RJ (2007) The endoplasmic reticulum and the unfolded protein response. Semin Cell Dev Biol 18: 716–731 [DOI] [PMC free article] [PubMed] [Google Scholar]
- Michot C, Hubert L, Brivet M, De Meirleir L, Valayannopoulos V, Muller‐Felber W, Venkateswaran R, Ogier H, Desguerre I, Altuzarra C, Thompson E, Smitka M, Huebner A, Husson M, Horvath R, Chinnery P, Vaz FM, Munnich A, Elpeleg O, Delahodde A et al (2010) LPIN1 gene mutations: a major cause of severe rhabdomyolysis in early childhood. Hum Mutat 31: E1564–E1573 [DOI] [PubMed] [Google Scholar]
- Miniou P, Tiziano D, Frugier T, Roblot N, Le Meur M, Melki J (1999) Gene targeting restricted to mouse striated muscle lineage. Nucleic Acids Res 27: e27 [DOI] [PMC free article] [PubMed] [Google Scholar]
- Mobley BA, Eisenberg BR (1975) Sizes of components in frog skeletal muscle measured by methods of stereology. J Gen Physiol 66: 31–45 [DOI] [PMC free article] [PubMed] [Google Scholar]
- Mul JD, Nadra K, Jagalur NB, Nijman IJ, Toonen PW, Medard JJ, Gres S, de Bruin A, Han GS, Brouwers JF, Carman GM, Saulnier‐Blache JS, Meijer D, Chrast R, Cuppen E (2011) A hypomorphic mutation in Lpin1 induces progressively improving neuropathy and lipodystrophy in the rat. J Biol Chem 286: 26781–26793 [DOI] [PMC free article] [PubMed] [Google Scholar]
- Murley A, Lackner LL, Osman C, West M, Voeltz GK, Walter P, Nunnari J (2013) ER‐associated mitochondrial division links the distribution of mitochondria and mitochondrial DNA in yeast. Elife 2: e00422 [DOI] [PMC free article] [PubMed] [Google Scholar]
- Nadra K, de Preux Charles AS, Medard JJ, Hendriks WT, Han GS, Gres S, Carman GM, Saulnier‐Blache JS, Verheijen MH, Chrast R (2008) Phosphatidic acid mediates demyelination in Lpin1 mutant mice. Genes Dev 22: 1647–1661 [DOI] [PMC free article] [PubMed] [Google Scholar]
- Ozbalci C, Sachsenheimer T, Brugger B (2013) Quantitative analysis of cellular lipids by nano‐electrospray ionization mass spectrometry. Methods Mol Biol 1033: 3–20 [DOI] [PubMed] [Google Scholar]
- Ozcan U, Yilmaz E, Ozcan L, Furuhashi M, Vaillancourt E, Smith RO, Gorgun CZ, Hotamisligil GS (2006) Chemical chaperones reduce ER stress and restore glucose homeostasis in a mouse model of type 2 diabetes. Science 313: 1137–1140 [DOI] [PMC free article] [PubMed] [Google Scholar]
- Ozcan U, Ozcan L, Yilmaz E, Duvel K, Sahin M, Manning BD, Hotamisligil GS (2008) Loss of the tuberous sclerosis complex tumor suppressors triggers the unfolded protein response to regulate insulin signaling and apoptosis. Mol Cell 29: 541–551 [DOI] [PMC free article] [PubMed] [Google Scholar]
- Pascual F, Carman GM (2013) Phosphatidate phosphatase, a key regulator of lipid homeostasis. Biochem Biophys Acta 1831: 514–522 [DOI] [PMC free article] [PubMed] [Google Scholar]
- Pereira RO, Tadinada SM, Zasadny FM, Oliveira KJ, Pires KMP, Olvera A, Jeffers J, Souvenir R, McGlauflin R, Seei A, Funari T, Sesaki H, Potthoff MJ, Adams CM, Anderson EJ, Abel ED (2017) OPA1 deficiency promotes secretion of FGF21 from muscle that prevents obesity and insulin resistance. EMBO J 36: 2126–2145 [DOI] [PMC free article] [PubMed] [Google Scholar]
- Peterfy M, Phan J, Xu P, Reue K (2001) Lipodystrophy in the fld mouse results from mutation of a new gene encoding a nuclear protein, lipin. Nat Genet 27: 121–124 [DOI] [PubMed] [Google Scholar]
- Peterson TR, Sengupta SS, Harris TE, Carmack AE, Kang SA, Balderas E, Guertin DA, Madden KL, Carpenter AE, Finck BN, Sabatini DM (2011) mTOR complex 1 regulates lipin 1 localization to control the SREBP pathway. Cell 146: 408–420 [DOI] [PMC free article] [PubMed] [Google Scholar]
- Reue K (2007) The role of lipin 1 in adipogenesis and lipid metabolism. Novartis Found Symp 286: 58–68 [DOI] [PubMed] [Google Scholar]
- Santos‐Rosa H, Leung J, Grimsey N, Peak‐Chew S, Siniossoglou S (2005) The yeast lipin Smp2 couples phospholipid biosynthesis to nuclear membrane growth. EMBO J 24: 1931–1941 [DOI] [PMC free article] [PubMed] [Google Scholar]
- Schaap FG, Kremer AE, Lamers WH, Jansen PL, Gaemers IC (2013) Fibroblast growth factor 21 is induced by endoplasmic reticulum stress. Biochimie 95: 692–699 [DOI] [PubMed] [Google Scholar]
- Schweitzer GG, Collier SL, Chen Z, McCommis KS, Pittman SK, Yoshino J, Matkovich SJ, Hsu FF, Chrast R, Eaton JM, Harris TE, Weihl CC, Finck BN (2018) Loss of lipin 1‐mediated phosphatidic acid phosphohydrolase activity in muscle leads to skeletal myopathy in mice. FASEB J: fj201800361R [DOI] [PMC free article] [PubMed] [Google Scholar]
- Sebastian D, Hernandez‐Alvarez MI, Segales J, Sorianello E, Munoz JP, Sala D, Waget A, Liesa M, Paz JC, Gopalacharyulu P, Oresic M, Pich S, Burcelin R, Palacin M, Zorzano A (2012) Mitofusin 2 (Mfn2) links mitochondrial and endoplasmic reticulum function with insulin signaling and is essential for normal glucose homeostasis. Proc Natl Acad Sci USA 109: 5523–5528 [DOI] [PMC free article] [PubMed] [Google Scholar]
- Suomalainen A, Battersby BJ (2018) Mitochondrial diseases: the contribution of organelle stress responses to pathology. Nat Rev Mol Cell Biol 19: 77–92 [DOI] [PubMed] [Google Scholar]
- Tatsuta T (2017) Quantitative analysis of glycerophospholipids in mitochondria by mass spectrometry. Methods Mol Biol 1567: 79–103 [DOI] [PubMed] [Google Scholar]
- Tezze C, Romanello V, Desbats MA, Fadini GP, Albiero M, Favaro G, Ciciliot S, Soriano ME, Morbidoni V, Cerqua C, Loefler S, Kern H, Franceschi C, Salvioli S, Conte M, Blaauw B, Zampieri S, Salviati L, Scorrano L, Sandri M (2017) Age‐associated loss of OPA1 in muscle impacts muscle mass, metabolic homeostasis, systemic inflammation, and epithelial senescence. Cell Metab 25: 1374–1389.e6 [DOI] [PMC free article] [PubMed] [Google Scholar]
- Wai T, Garcia‐Prieto J, Baker MJ, Merkwirth C, Benit P, Rustin P, Ruperez FJ, Barbas C, Ibanez B, Langer T (2015) Imbalanced OPA1 processing and mitochondrial fragmentation cause heart failure in mice. Science 350: aad0116 [DOI] [PubMed] [Google Scholar]
- Xia J, Wishart DS (2016) Using MetaboAnalyst 3.0 for comprehensive metabolomics data analysis. Curr Protoc Bioinformatics 55: 14.10.1–14.10.91 [DOI] [PubMed] [Google Scholar]
- Yecies JL, Zhang HH, Menon S, Liu S, Yecies D, Lipovsky AI, Gorgun C, Kwiatkowski DJ, Hotamisligil GS, Lee CH, Manning BD (2011) Akt stimulates hepatic SREBP1c and lipogenesis through parallel mTORC1‐dependent and independent pathways. Cell Metab 14: 21–32 [DOI] [PMC free article] [PubMed] [Google Scholar]
- Yoon Y, Krueger EW, Oswald BJ, McNiven MA (2003) The mitochondrial protein hFis1 regulates mitochondrial fission in mammalian cells through an interaction with the dynamin‐like protein DLP1. Mol Cell Biol 23: 5409–5420 [DOI] [PMC free article] [PubMed] [Google Scholar]
- Yoon MS, Rosenberger CL, Wu C, Truong N, Sweedler JV, Chen J (2015) Rapid mitogenic regulation of the mTORC1 inhibitor, DEPTOR, by phosphatidic acid. Mol Cell 58: 549–556 [DOI] [PMC free article] [PubMed] [Google Scholar]
- Youngman MJ, Hobbs AE, Burgess SM, Srinivasan M, Jensen RE (2004) Mmm2p, a mitochondrial outer membrane protein required for yeast mitochondrial shape and maintenance of mtDNA nucleoids. J Cell Biol 164: 677–688 [DOI] [PMC free article] [PubMed] [Google Scholar]
- Zhang P, Verity MA, Reue K (2014) Lipin‐1 regulates autophagy clearance and intersects with statin drug effects in skeletal muscle. Cell Metab 20: 267–279 [DOI] [PMC free article] [PubMed] [Google Scholar]
Associated Data
This section collects any data citations, data availability statements, or supplementary materials included in this article.
Supplementary Materials
Appendix
Expanded View Figures PDF
Source Data for Appendix
Review Process File
Source Data for Figure 4
Data Availability Statement
The targeted metabolomics mass spectrometry data from this publication have been deposited to the EMBL‐EBI MetaboLights database (https://doi.org/10.1093/nar/gks1004; PubMed PMID: 23109552) with the identifier MTBLS750.


